


ABSTRACT
Efficient industrial fermentation of lignocellulosic waste containing a large part of glucose and xylose is desirable to implement a circular economy. Mixed culture biotechnologies can aid in realizing this goal. The effect of feeding equivalent substrates to a microbial community, such a xylose and glucose, is not well understood in terms of the number of dominant species and how these species compete for the substrates. We compared the metabolism and microbial community structure in a continuous-flow stirred tank reactor (CSTR) and a sequencing batch reactor (SBR) fed with a mixture of xylose and glucose, inoculated with bovine rumen at pH 8, 30°C and a hydraulic retention time of 8 h. We hypothesised that a CSTR will select for generalist species, taking up both substrates. We used 16S rRNA gene sequencing and fluorescent in situ hybridisation to accurately determine the microbial community structures. Both enrichments were stoichiometrically and kinetically characterised. The CSTR enrichment culture was dominated by Clostridium intestinale (91% ± 2%). The SBR showed an abundance of Enterobacteriaceae (75% ± 8%), dominated by Citrobacter freundii and a minor fraction of Raoultella ornithinolytica. C. freundii ferments xylose and glucose in a non-diauxic fashion. Clearly, a non-diauxic generalist outcompetes specialists and diauxic generalists in SBR environments.
INTRODUCTION
Glucose and xylose are the two most abundant monomers found in lignocellulosic waste streams (Anwar, Gulfraz and Irshad 2014). Fermentation of these two carbohydrates to valuable compounds such as volatile fatty acids (VFAs), lactic acid, hydrogen, or ethanol can enable new biobased processes to be developed (Guo et al. 2010; Dionisi et al. 2015; Kleerebezem et al. 2015). Enrichment culturing offers the potential to apply selective conditions to direct a process towards a certain product, e.g. butyrate in carbohydrate fermentation (Kleerebezem and van Loosdrecht 2007), poly-β-hydroxyalkanoates in an aerobic feast–famine process (Johnson et al. 2009) or medium chain fatty acids from volatile fatty acids and an electron donor like ethanol or lactate (Steinbusch et al. 2011). Enrichment cultures select for specific microorganisms based on competition for a growth rate limiting substrate (Beijerinck 1901). Most fermentative enrichment studies have been performed using a continuous-flow stirred tank reactor (CSTR) set-up (Fang and Liu 2002; Temudo, Kleerebezem and van Loosdrecht 2007; Rafrafi et al. 2013). A CSTR is a system where the fermentable substrate is continuously available at a low concentration. This is similar to anaerobic digestion of lignocellulosic waste. The hydrolysis of the macromolecular substrate, e.g. cellulose, is the rate-limiting step in the fermentation leading to the hydrolysed monomer substrate, e.g. glucose, to be continuously available in low residual concentrations (Noike et al. 1985; Kleerebezem et al. 2015).
In a previous study we have demonstrated this effect. In a CSTR enrichment culture limited with glucose we indeed observed one species dominating (>90%) the population. For xylose we however observed a community with at least three dominant species, indicating that other mechanisms besides direct substrate competition are complicating the microbial community structure (Rombouts et al. 2019).
Two types of microbial species can compete in a mixed-culture CSTR, a specialist taking up only one substrate and a generalist, taking up both substrates simultaneously. If we assume the generalist and specialist species possess similar kinetic properties on xylose and glucose (µmaxKs−1), then the generalist, by converting both xylose and glucose simultaneously, can lower the residual concentration of xylose and glucose beyond the capacity of the specialist species, resulting in wash-out of the specialists (Kuenen 2015). This effect has been demonstrated in pure culture competition experiments with two specialists and one generalist (Gottschal, de Vries and Kuenen 1979; Kuenen 1983). We thus expect a generalist species to dominate the CSTR environment.
The sequencing batch reactor (SBR) environment offers the opportunity to select for a microbial community based on the maximum biomass-specific growth rate (µmax). When feeding a mixture of xylose and glucose to a microbial community at high concentrations, carbon catabolite repression (CCR) or diauxic behaviour is expected to be favoured for substrate uptake, where glucose is first taken up prior to xylose. The preference for glucose is mediated through a cyclic adenosine monophosphate (cAMP)-regulated pathway in Escherichia coli; therefore, glucose is preferably metabolised (Deutscher 2008). CCR is an abundant mechanism amongst heterotrophic bacteria (Görke and Stülke 2008). It has been demonstrated that in a batch environment, specialist species will outcompete a diauxic generalist species (Gottschal, de Vries and Kuenen 1979). This theory has been confirmed for an enrichment of microorganisms accumulating PHA on a mixture of acetate and lactate, where Plasticicumulans acidivorans was identified the acetate specialist and Thauera selenatis as the lactate specialist (Jiang et al. 2011). Thus, we believe a competitive CCR-type species will take up the glucose, leaving a niche for a sole xylose specialist to take up the xylose. In other words, we expect that in an SBR enrichment culture fed with a mixture of glucose and xylose, two specialist species will be enriched in the microbial community.
The fed-batch environment is typically used in industrial fermentations using pure cultures to convert sugars to a desired product (Meyer, Minas and Schmidhalter 2017). When using a mixture of substrates in a fed batch, CCR can induce accumulation of the non-preferred substrate, e.g. xylose in a dual xylose and glucose fermentation (Kim, Block and Mills 2010). A way to deal with this problem is to avoid CCR and create a non-diauxic xylose- and glucose-fermenting generalist (Kim et al. 2015) or to design xylose- and glucose-specialist species and performing fermentation with this synthetic consortium (Verhoeven et al. 2018). The ecological significance of CCR and the observed microbial diversity in a mixed-substrate SBR environment fed with xylose and glucose can be used to design novel microbial-based processes using defined mixtures of pure cultures.
Using enrichment culturing with a mixture of xylose and glucose in a CSTR and SBR environment, we aimed to elucidate here the impact of mixed-substrate conditions on the microbial diversity and fermentative niche establishment in both environments. This was facilitated by comparing our results to previously published results for similar enrichment cultures with fermenting xylose or glucose in CSTR or SBR environments, inoculated with the same bovine rumen and also operated at pH 8, a temperature of 30°C and a hydraulic retention time (HRT) of 8 h (Rombouts et al. 2019). Furthermore, we aim to evaluate the ecological significance of CCR using our enrichment culturing approach.
MATERIAL AND METHODS
All enrichment procedures and analytical methods are described in detail in Rombouts et al. (2019). The main adaptations for the mixed-substrate experiments are given hereafter.
Fermentative enrichment culturing
The enrichment procedure was executed as described in Rombouts et al. (2019), with the adaptation that 2 g L−1 of xylose and 2 g L−1 of glucose were fed as a mixture instead of 4 g L−1 of one of the individual substrates, resulting in a similar chemical oxygen demand (COD) influent concentration as in the single-substrate enrichments. The same cow rumen inoculum was used and seeded in the same way in the CSTR and SBR. The reactors were operated at 30°C ± 0.1, pH of 8.0 ± 0.1 and an HRT of 8 h. The reactors were continuously stirred at 300 rpm and the solid retention time (SRT) is the same as the HRT applied. Steady state was assumed if during a period of at least 5 d no significant variation in the concentrations of fermentation products was observed.
Analytical methods and cycle analysis
The concentrations of the residual glucose and xylose substrates and of VFAs (formate to valerate), lactate, succinate, and ethanol were analysed using a high-performance liquid chromatograph as described in Rombouts et al. (2019). Quantification was accurate in the range of 100–0.5 mM. For high butyrate concentrations above 1 mmol L−1, samples were analysed using gas chromatography for butyrate and ethanol overlap in the refractive index (RI) spectrum and butyrate can be quantified from the ultraviolet (UV) spectrum, as described in Rombouts et al. (2019). The off-gases were monitored online for H2 and CO2 using a spectrophotometric method as described in Rombouts et al. (2019) and were accurately quantified in the range from 0.1% to 5%.
Biomass concentration was measured using a standard method that relies on centrifugation to separate the cells from the medium, drying to obtain total suspended solids, and burning at 550°C to obtain volatile suspended solids (APHA 1998). This analysis was coupled to an optical density (OD) measurement at 660 nm to establish a correlation. OD values were used to calculate the biomass concentration during the batch experiments.
To characterise the kinetics of the cultures in SBR mode, one full cycle was sampled, and metabolite and biomass concentrations were measured in parallel to H2 and CO2 in the off-gas. In the CSTR, a batch test was conducted by removing 1 L of reactor broth and replacing it by 1 L of medium to finally obtain a concentration of 1 g L−1 of xylose and 1 g L−1 of glucose together with a stoichiometric amount of other nutrients. Sampling and off-gas analysis were carried out as in the SBRs over 5 h.
To characterise the mixed substrate uptake of the single-substrate-limited SBR enrichments, these enrichments were reinoculated with 10 mL effluent from the xylose- or glucose-limited SBR enrichments obtained previously (Rombouts et al. 2019). Effluent frozen with 10% glycerol at −80°C was used to reinoculate an SBR either on xylose or glucose using the previously described cultivation methods. These SBRs were operated for one week on either xylose or glucose, reaching steady state. Then, a batch cycle was characterized using a mixture of 1 g L−1 of xylose and 1 g L−1 of glucose.
Microbial community analysis
Genomic DNA was extracted from 2-mL samples of reactor suspension and the bacterial community compositions analysed as described in Rombouts et al. (2019). Analysis of V3–V4 16S rRNA gene-based amplicon sequencing was executed as described in Rombouts et al. (2019) to get an overview of the predominant populations selected in the enrichments over time. Cloning and sequencing of full-length 16S rRNA genes was conducted following Rombouts et al. (2019) to obtain species-level information, picking 38 clones for the CTSR and 24 for the SBR enrichment. Primers used are listed in Table S1 (Supporting Information). Amplicon sequencing data is available at NCBI under SRR8718538-SRR8718547 and full 16S clone sequences are available under MK185473-MK185614.
Cell fixation and fluorescence in situ hybridisation (FISH) were carried out as described by Rombouts et al. (2019). Staining with 4′,6-diamidino-2-phenylindole (DAPI) was used to map all microbial cells. Cell surface area quantification was carried out using the Quantimet Interactive Programming System (QUIPS) feature of the Leica QWin V3 software (Leica, Wetzlar, Germany).
Mathematical modelling of the batch tests
COD and carbon balances
At steady state, carbon and chemical oxygen demand balances were set up using the method described in Rombouts et al. (2019) and the elemental matrix given in the supplementary information of Rombouts et al. (2019). Nicotinamide adenine dinucleotide (NADH) and acetyl-CoA yields were set up by multiplying the values in the supplementary table of Rombouts et al. (2019) with the yield on glucose and xylose. A biomass composition of C1H1.8O0.5N0.2 was used (Roels 1983).
RESULTS
Fermentations in SBR and CSTR enrichment cultures result in different product spectra
The two enrichment cultures operated with a mixture of xylose and glucose in SBR and CSTR mode showed different fermentation product spectra (Fig. 1). The SBR enrichment initially produced predominantly acetate, ethanol and propionate (data not shown). When the steady state was reached, the SBR enrichment shifted to a product spectrum dominated by acetate and ethanol. The CSTR enrichment developed within 20 SRTs to a stable fermentation pattern, producing primarily ethanol, acetate and butyrate (Fig. 1). Mass and electron balances were almost closed with carbon and COD recovered to acceptable amounts (Table 1), indicating that all relevant fermentation products were identified.

Steady state fermentation product spectra of glucose- and xylose-fed SBR and CSTR in Cmol or mol product per Cmol substrate on the basis of three measurements in time. Samples were taken at 38, 47 and 53 SRTs for SBR and 63, 66 and 75 SRTs for the CSTR.
Carbon and COD balances, product yields and biomass yields in the glucose- and xylose-fed SBR and CSTR enrichment cultures. Acetyl-CoA derivates and formate and hydrogen yields and NADH yields were calculated on the basis of our previously published biochemical network (Rombouts et al. 2019). Yields are given per C-mol substrate.
| Carbon [%] | COD [%] | Acetyl-CoA derivates [mol Cmol−1] | Formate + H2 [mol Cmol−1] | NADH [mol Cmol−1] | Yx,s [Cmol Cmol−1] | |
|---|---|---|---|---|---|---|
| SBR | 99 ± 2 | 99 ± 1 | 0.25 ± 0.01 | 0.25 ± 0.02 | −0.07 ± 0.01 | 0.15 ± 0.00 |
| CSTR | 97 ± 5 | 96 ± 2 | 0.25 ± 0.01 | 0.24 ± 0.01 | −0.04 ± 0.00 | 0.15 ± 0.00 |
Xylose and glucose were taken up simultaneously, while xylose uptake was slower than glucose uptake
A cycle analysis or batch experiment was performed to estimate the |$q^{\mathrm{ max}}_{\mathrm{ s}}$| and µmax values of the enrichment cultures. Xylose and glucose were both instantly taken up by the enrichment cultures (Fig. 2), indicating no carbon catabolite repression of glucose on xylose uptake in either culture. The xylose uptake rate was 2.7 and 1.7 times slower the glucose uptake rate in the SBR and CSTR enrichment cultures, respectively. Both xylose and glucose uptake rates were higher in the SBR than in the CSTR enrichment culture (Table 2), with the summed |$q^{\mathrm{ max}}_{\mathrm{ s}}$| values being 2.3 times higher for the SBR than for the CSTR culture. Noteworthy is the fact that the mixed-substrate CSTR enrichment culture displayed a combined µmax only 31% above the applied dilution rate of 0.11 h−1.
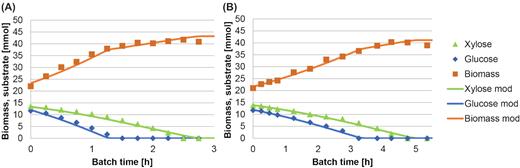
Measured and modelled glucose, xylose and biomass concentrations during the cycle analysis in the SBR (A) and CSTR (B) enrichment cultures. Both modelled results showed an R2 > 0.99.
Modelled |$q^{\mathrm{ max}}_{\mathrm{ s}}$| and µmax for glucose or xylose during the cycle analysis for the mixed-substrate SBR enrichment and CSTR enrichment (measured data in Fig. 2). The σqsmax was calculated using error propagation and the covariance of the Cs and Cx,0 measurement, while σµmax was calculated using error propagation and the covariance of the Cx and Cx,0 measurement. Biomass yields used to estimate the growth rate are taken from the enrichments on solely xylose or glucose as the growth substrate (Rombouts et al. 2019).
| Mixed-substrate SBR | Mixed-substrate CSTR | ||
|---|---|---|---|
| Glucose | |$q^{\mathrm{ max}}_{\mathrm{ s}}$| [Cmols Cmolx−1 h−1] | 2.01 ± 0.03 | 0.78 ± 0.01 |
| µmax [h−1] | 0.26 ± 0.01 | 0.11 ± 0.01 | |
| Xylose | |$q^{\mathrm{ max}}_{\mathrm{ s}}$| [Cmols Cmolx−1 h−1] | 0.79 ± 0.01 | 0.46 ± 0.01 |
| µmax [h−1] | 0.09 ± 0.01 | 0.06 ± 0.01 | |
| Summed | |$q^{\mathrm{ max}}_{\mathrm{ s}}$| [Cmols Cmolx−1 h−1] | 2.80 ± 0.04 | 1.24 ± 0.02 |
| µmax [h−1] | 0.36 ± 0.04 | 0.17 ± 0.03 |
Feeding a mixture of xylose and glucose led to one dominant microbial species in both CSTR and SBR enrichments
According to the dynamics of operational taxonomic units (OTUs) revealed by V3–V4 16S rRNA gene amplicon sequencing (Fig. 3), the sequencing reads from the mixed-substrate CSTR were dominated by four populations affiliating with the genus Citrobacter, the family of Enterobacteriaceae, the family of Lachnospiraceae, and the genus Clostridium. All four populations stabilised after 20 SRTs, after an initial predominance of Raoultella and Citrobacter populations during the initial batch phase after which the reactor was switched to CSTR mode.
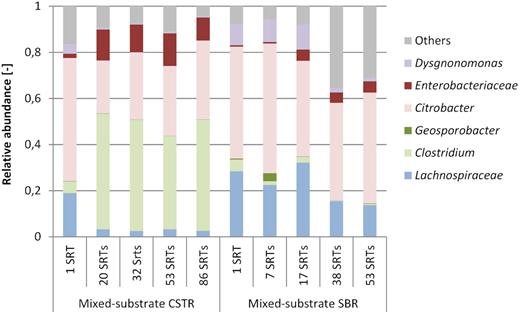
Relative abundance of genera obtained from V3–V4 16S rRNA gene amplicon sequencing read counts. Genera of the Enterobacteriaceae family are shown in red colours and genera of the Clostridiaceae are shown in green colours. OTUs accounting for less than 3% of the reads were bundled into ‘others’ (grey).
The sequencing reads of the mixed-substrate SBR were dominated by Citrobacter and Enterobacteriaceae. The same Lachnospiraceae genus as detected in the CSTR corresponded initially to 28% of the reads, stabilising at 13–15% later. Initially Dysgonomonas were present in significant amounts (11%, respectively, at 16 SRTs), decreasing to less than 2% at 38 SRTs of the reads. The fractions of other microbial groups in the SBR reads remained quite high at the end of the enrichment (31–35%), being composed mostly of Proteobacteria, Firmicutes, Actinobacteria and Bacteriodetes.
The clone library of full-length 16S rRNA gene sequences established at the end of the enrichment was efficient at identifying the dominant phylotypes with a species-level resolution (Fig. 4). The amplicon sequencing results were reflected by the sequenced clone library. The predominance of Citrobacter freundii, Clostridium intestinale and two uncultivated Lachnospiraceae species gave a similar distribution in the CSTR enrichment (Fig. 4). The composition of OTUs of the mixed-substrate SBR was also confirmed, with a predominance of C. freundii and an 8% fraction of the full 16S rRNA gene sequences corresponding to Raoultella ornithinolytica. An amount of 24 clones was picked for this library, which did not result in enough resolution to also identify the Lachnospiraceae population or species from the others' fractions.
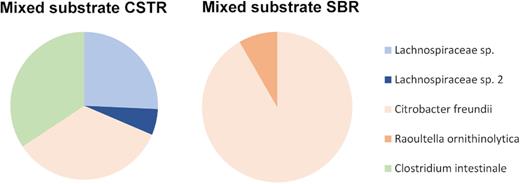
Microbial composition of the mixed-substrate CSTR and SBR enrichments as estimated by cloning and sequencing of full-length 16S rRNA gene sequences of the bacterial populations. Lachnospiraceae species are denoted in blue colours, Enterobacteriaceae species in red colours and Clostridiaceae species in green colours. The data acquired from the samples used are taken at 86 SRTs for CSTR and 53 SRTs for SBR.
The FISH analysis revealed that the mixed-substrate SBR enrichment was dominated by Enterobacteriaceae, with 75% of the cell surface area showing fluorescence of the Ent183 probe (Table 3). A side population of Lachnospiraceae was also detected (8%). No cells hybridised with the Clostridium-targeting Chis150 probe. A significant fraction of 17% of microbial populations of the SBR enrichment remained unresolved by FISH. The CSTR enrichment was dominated by Clostridium (91%), with a side population of Enterobacteriaceae (11%) and a minor fraction of Lachnospiraceae (1%) (Table 3). Thus, the SBR enrichment was dominated by Enterobacteriaceae species and the CSTR enrichment to an even higher extent by Clostridium species. There is a clear discrepancy between the FISH observations and the DNA-sequencing-based observations, which will be discussed below.
Microbial composition analysis based on FISH quantification (average of three different measurements) of dominant populations in the mixed-substrate SBR and CSTR. Percentages denote relative abundances calculated from the target-probe surface compared to EUB338 surface. Unidentified populations were calculated as the remaining percentage after summing up the relative abundances of the known populations in the first three columns. The last column shows the amount of surface probed by EUB338 compared to DAPI. Samples used were taken at 86 SRTs for CSTR and 37 SRTs for SBR. ND = not detected.
| Chis150 vs. EUB338 [%] | Lac435 vs. EUB338 [%] | Ent183 vs. EUB338 [%] | Unidentified vs. EUB338 [%] | EUB338 vs. DAPI [%] | |
|---|---|---|---|---|---|
| Mixed-substrate SBR | ND | 8±6 | 75±8 | 17 | 103±24 |
| Mixed-substrate CSTR | 91±2 | 1±1 | 11±6 | −2 | 102±24 |
| Chis150 vs. EUB338 [%] | Lac435 vs. EUB338 [%] | Ent183 vs. EUB338 [%] | Unidentified vs. EUB338 [%] | EUB338 vs. DAPI [%] | |
|---|---|---|---|---|---|
| Mixed-substrate SBR | ND | 8±6 | 75±8 | 17 | 103±24 |
| Mixed-substrate CSTR | 91±2 | 1±1 | 11±6 | −2 | 102±24 |
DISCUSSION
Mixed-substrate enrichment led to a similar spectrum of fermentation products as single-substrate enrichments
In this study we observed enrichment cultures on a mixture of glucose and xylose cultivated in the same way as previous enrichment cultures on the individual substrates (Rombouts et al. 2019). A comparison was made between a CSTR regime (always substrate-limited uptake rates) and SBR regime (maximal substrate uptake rates). The product spectrum obtained when enriching a microbial community on a mixture of xylose and glucose was similar to the summation of the product spectra obtained on the single substrates (Fig. S1, Supporting Information) using the same inoculum and enrichment procedure. The formate and H2/CO2 ratio was different between the mixed-substrate SBR and the single-substrate SBRs summed up. The reason for this difference is not known, but the kLa is likely excluded. The kLa is the mass transfer coefficient and influences the transfer of liquid to gas phase. If this term changes under similar hydrogen production rates, a different hydrogen partial pressure is obtained, which can potentially affect the ratio of formate and hydrogen as the Gibbs energy change of the equilibrium between formate and hydrogen is assumed to be a constant value (Temudo, Kleerebezem and van Loosdrecht 2007). We observed previously that different gas flow rates did not affect the formate and hydrogen ratio (Rombouts et al. 2019).
The mixed-substrate CSTR was producing more butyrate and less acetate and ethanol than the sum of the individual product spectra would suggest, though the spectrum is similar. Feeding a mixture of xylose and glucose to a CSTR fermentative community enriched on xylose has previously yielded a similar observation: the product spectrum of a mixed-substrate enrichment has been similar to but not exactly the same as the theoretical summed product spectrum of a single-substrate enrichment (Temudo et al. 2009).
Pathway analysis of the enrichments reveals a pentose phosphate pathway (PPP) for xylose fermentation and no homoacetogenesis and electron bifurcation
When comparing the products derived from acetyl-CoA and the formate and hydrogen yields (Table 1), it can be concluded that in both enrichment cultures acetate, ethanol, and butyrate were produced with a direct stoichiometric coupling with hydrogen or formate, through the decarboxylation of pyruvate to acetyl-CoA (Temudo, Kleerebezem and van Loosdrecht 2007; Rombouts et al. 2019). The NADH balance showed that slightly more NADH was consumed than produced in both enrichments (Table 1). This can be corrected by assuming a net NADH neutral production of succinate through both the reductive and oxidative pathways, equal to −0.04 and −0.02 mol Cmol−1 for the SBR and CSTR cultures, respectively.
The PPP was assumed active in both enrichments since acetate and ethanol were produced in equimolar amounts and no excess of acetyl-CoA derivates over formate and hydrogen was detected (Table 1). The phosphoketolase pathway PKP produces directly one acetate and shuttles three carbon into glycolysis, leading to lesser production of formate and hydrogen and more acetate than ethanol. Furthermore, the nearly closing NADH balance and the equimolar amounts of acetyl-CoA derivates and formate and hydrogen indicate that homoacetogenesis and electron bifurcation did not play a significant role in these enrichments, as proposed by Regueira et al. (2018).
Microbial community analysis showed a difference in biomass quantification between FISH and 16S-based methodologies
In the mixed-substrate CSTR the 16S rRNA amplicon sequencing and the full 16S clone library suggested that a Clostridium, a Citrobacter and a Lachnospiraceae population were present in equal amounts in the community (Figs 3 and 4). The FISH analysis however showed a dominance of Clostridium (Table 3 and Fig. S3B, Supporting Information). This difference can arise from a DNA extraction bias or PCR amplification bias (Brooks et al. 2015) or from the fact that the Clostridium cells contain an equal amount of 16S DNA but are 5–10 times bigger than the Citrobacter and Lachnospiraceae cells, as visible using light microscopy (Fig. S5, Supporting Information).
The amount of biomass (or biovolume), rather than the cell number, is representative for the share in substrate turnover in a microbial community. This amount of biomass is assessed by FISH where a quantification is made based on cell surface area. Recently in other studies a similar discrepancy between biovolume and cell numbers due to differences in cell size has been reported (Saccà 2016; Domaizon et al. 2017; Rubio-Rincón et al. 2019) A ‘full cycle rRNA analysis’ of a microbial community structure, as proposed by Amann, Ludwig and Schleifer (1995), is needed to get a quantitative view of a microbial community structure. Such as cycle consists of first identifying the dominant taxa in a given sample (e.g. 16S rRNA amplicon sequencing), and then using a quantitative tool like FISH to estimate the fractions of these taxa in a sample.
The CSTR enrichment resulted in a dominance of a generalist species
We originally hypothesised that a CSTR enrichment based on a mixture of equivalent substrates would lead to the dominance of a generalist species over specialist species. The microbial community analysis showed that the mixed-substrate CSTR enrichment was dominated by a Clostridium population (Table 3, Fig. S3, Supporting Information) mainly composed of C. intestinale (Fig. 4). This species was also dominating a glucose-limited CSTR enrichment (Rombouts et al. 2019) and can be linked to butyrate production, as the CSTR produces a significant amount of butyrate where the SBR does not. Apparently, this species is competitive in both a sole glucose-limited CSTR environment and a dual xylose- and glucose-limited CSTR environment.
To dominate under dual limitations, C. intestinale needs to have a high-affinity uptake system for glucose and for xylose expressed. For glucose, the phosphotransferase system (PTS) and methyl-galactoside transport system ATP-binding protein (Mgl) have both been described as high-affinity transporters (Jahreis et al. 2008). For xylose, the xylose ATP-binding cassette (ABC) transport operon (XylFGH) is known as a high-affinity uptake system (Sumiya et al. 1995). The closest related strain for which a genome is available is the C. intestinale strain JCM 7506 (NCBI:txid1121320), also known as strain DSM 6191 (99% identity). This strain contains all three subunits of the PTS system in its genome and the xylose-binding protein XylF, enabling it to competitively take up glucose and xylose in a continuous substrate-limited environment, leading to its dominance in a mixed-substrate environment (Fig. 5). XylG and XylH are not found in its genome, but other ABC-type ATP-binding proteins and membrane spanning proteins found in the genome could fulfil these roles.
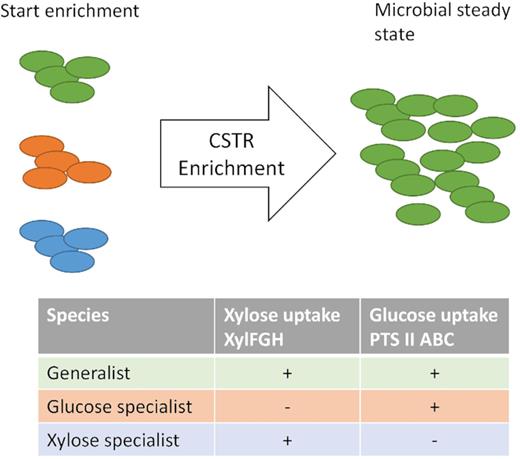
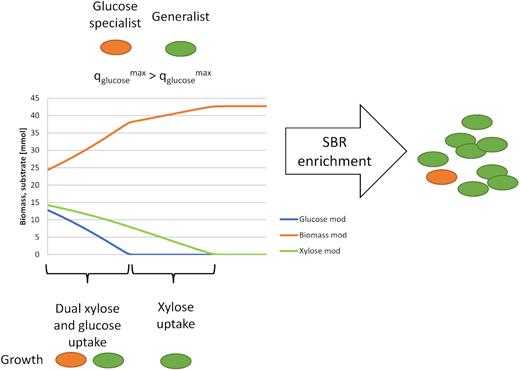
A theoretical outcome of a CSTR enrichment with three different types of microbial species present at the start of the enrichment, a generalist (green), a xylose specialist (blue) and a glucose specialist (orange).
Previously, Temudo et al. (2008) have characterised the effect of switching from feeding xylose or glycerol to feeding an equal amount of xylose and glucose or glycerol and glucose. They have observed that a similar amount or even fewer bands were observed in the molecular fingerprint of the bacterial community obtained after one week or 21 SRTs of enrichment by denaturing gradient gel electrophoresis. This indicated that adding a mixture of limiting substrates does not necessarily lead to more microbial diversity, confirming our observation in the mixed-substrate CSTR, where aC. intestinale was dominating the microbial community in terms of biovolume.
SBR enrichment leads to dominance of a dual xylose- and glucose-fermenting species
In the mixed substrate SBR, a dominance of Enterobacteriaceae with a side population of Lachnospiraceae affiliates was observed (Table 3, Fig. S4, Supporting Information). Previously we have reported the dominance (>90%) of Enterobacteriaceae affiliates on SBRs limited on either glucose or xylose (Rombouts et al. 2019). The significant side population of Lachnospiraceae present in the mixed-substrate SBR enrichment might have been caused by rather long cleaning intervals of wall biofilm. In this study the SBR was cleaned every 3–9 SRTs versus 3 SRTs in Rombouts et al.(2019) (Table S6, Supporting Information). The biofilm formed was presumably adding microbial diversity to the community in the form of Lachnospiraceae. We expect that a 3 SRT cleaning schedule would have led to an enrichment dominated completely (>90%) by Enterobacteriaceae.
Well-studied microorganisms such as E. coli display CCR in batch (Deutscher 2008). Therefore, we hypothesised that a diauxic generalist species fermenting first glucose and then xylose would coexist with a specialist for xylose. We find C. freundii as the dominant Enterobacteriaceae in the mixed-substrate SBR enrichment, when assuming DNA extraction, copy number and PCR biases to be similar in this family (Fig. 4) and a non-diauxic uptake of xylose and glucose (Fig. 2). This species was also dominant in the xylose SBR enrichment (Rombouts et al. 2019), and showed a non-diauxic uptake for xylose when subjected to a cycle with xylose and glucose (Fig. S2B, Supporting Information).
C. freundii strains are known to ferment both xylose and glucose (Farmer et al. 1985). The |$q^{\mathrm{ max}}_{\mathrm{ s}}$| of the sole xylose enrichment was 2.28 ± 0.10 CmolS CmolX−1 h−1 (Rombouts et al. 2019), while the mixed-substrate SBR enrichment showed a combined |$q^{\mathrm{ max}}_{\mathrm{ s}}$| of 2.80 ± 0.04 Cmols Cmolx−1 h−1, which is similar to the value of the xylose SBR subjected to glucose and xylose, 2.68 ± 0.04 Cmols Cmolx−1 h−1. The dominant C. freundii species outcompetes xylose specialists by attaining a higher overall |$q^{\mathrm{ max}}_{\mathrm{ s}}$| on xylose and glucose, and therefore a higher |$q^{\mathrm{ max}}_{\mathrm{ s}}$| than what is achievable on xylose as the sole carbon source. It has been shown that E. coli can achieve a higher catabolic flux when taking up glucose compared to xylose (Gonzalez, Long and Antoniewicz 2017). This can underlie why dual xylose–glucose uptake in our study led to higher overall flux. Apparently, a xylose specialist or a CCR-type generalist is outcompeted by a non-diauxic dual-fermenting generalist.
XylE is a xylose symporter that is associated with a high rate and low affinity (Sumiya et al. 1995), which makes this transporter likely to be expressed at high growth conditions with substrate in excess, e.g. batch cultivation. Outer membrane protein C (OmpC) and OmpF allow glucose to diffuse into the cell at high substrate concentration (>0.2 mM) while lambda receptor protein B (LamB) is induced under lower glucose concentrations (Luo, Zhang and Wu 2014). The dominant strain in the mixed SBR enrichment is the C. freundii strain P10159 (CP012554.1, 100% identity), which was also the dominant strain in the xylose SBR enrichment (Rombouts et al. 2019). This strain contains the genes to express XylE, OmpC and LamB, which argues for its competitive uptake of both substrates. Xylose uptake is inhibited through a cAMP-mediated pathway (Luo, Zhang and Wu 2014). Since this species exhibited no CCR in our enrichments, it would be of interest to identify how this species regulates its glucose and xylose uptake.
A niche is present for a glucose specialist, fermenting glucose at a µmax and |$q^{\mathrm{ max}}_{\mathrm{ s}}$| higher than that of the generalist. A minor fraction of Raoultella ornithinolytica was detected (Fig. 4), which was also detected in a minor amount in the glucose SBR enrichment (Rombouts et al. 2019). Potentially, this species takes up glucose at a higher rate than the generalist, enabling them to coexist (Fig. 6). Since the generalist grows on both xylose and glucose, this species is assumed to dominate the enrichment, which was reflected by the clone library (Fig. 4).
Competition between a high-rate glucose specialist (orange) and a dual xylose- and glucose-fermenting generalist (green). In the first phase, glucose is taken up by both species, while in the second phase xylose is only taken up the generalist.
It has been shown that repeated batch cultivation at 60°C (5 SRTs) leads to the presence of three populations for glucose, one for xylose and four for a mixture of glucose and xylose (Hniman, O-Thong and Prasertsan 2011). Since this study only characterised the microbial community after 5 SRTs, it is quite possible that the microbial diversity would have decreased for all three enrichments. Microbial population dynamics can lead to a relatively long time for communities to stabilize, which is visible in the mixed substrate SBR (Fig. 4). A Dysgonomonas population emerged in the reads at 7 SRTs and then became a minor fraction at 38 SRTs, indicating that some microbial interaction takes place in this timespan which causes a more diverse community structure.
Here we conclude that enriching in a CSTR using mixed substrates leads to a dominant generalist species, confirming our hypothesis and the chemostat theory that describes the competitive advantage of a generalist in a chemostat. In the SBR, a generalist species was fermenting the xylose and glucose without carbon catabolite repression, which was not expected, postulating that contrary to many pure culture studies xylose and glucose are taken up in the environment by generalists without CCR. In dual substrate uptake, xylose fermentation is slower than glucose fermentation and product spectra of a mixture of xylose and glucose are similar to product spectra from solely xylose or glucose. Microbiologists designing an industrial mixed substrate fermentation of a lignocellulosic residue containing glucose and xylose should consider that a non-diauxic generalist is competitive in such an environment.
FUNDING
This work was supported by the Soenhgen Institute for Anaerobic Microbiology (SIAM), SIAM gravitation grant, the Netherlands Organization for Scientific Research, (024.002.002).
ACKNOWLEDGEMENTS
The authors thank Cor Ras and Max Zomerdijk for technical assistance in analytics, Ben Abbas for help with the clone libraries and sequencing, Lars Puiman for his help in improving the FISH hybridisation for Gram+ microorganisms and Stef van Hateren for constructing the Leica V3 software to quantify FISH targeted cell surfaces, all at the Delft University of Technology.
Conflicts of interest. The authors declare that they have no conflicts of interest.
REFERENCES
Author notes
Shared senior authorship.
