


ABSTRACT
Methanogens are among the oldest forms of life on Earth and are detectable in a wide range of environments, but our knowledge of their overall diversity and functioning is limited. Peatlands in particular host a broad range of methanogens that contribute large amounts of methane to the atmosphere, but are largely under-represented in pure cultures. Here, we anaerobically enriched peat with common growth substrates, supplements and antibiotics to identifying novel methanogen sequences and potential growth conditions. Over 3 years, we obtained 28 new mcrA sequences from taxa that have remained previously uncultured and undescribed beyond distantly related clones or sequences detected in environmental samples. Evidence suggests that the novel methanogens, representing five of the seven known orders, were capable of growing on H2 as well as acetate and at temperatures ranging from 6 to ca. 22°C. Methods involving the use of ampicillin proved useful, although obtaining high methane production in the absence of H2 was difficult. Our results also indicate that many methanogens may rely on bacterial symbionts (commonly Clostridium spp.). Such enrichment approaches represent a useful intermediary between maker-gene detection and isolation, allowing us to broaden our understanding of methanogen physiological ecology while potentially providing valuable sequence data.
INTRODUCTION
Methanogens are thought to be some of the first life to have evolved on Earth and are found globally in environments ranging from the intestinal tracts of ruminants, termites (Schlesinger and Bernhardt 2013) and humans (Whitford, Teather and Forster 2001; Dridi et al. 2012) to anaerobic digesters (Mudhoo and Kumar 2013), ocean sediments (Newberry et al. 2004) and wetland soils (Basiliko et al. 2003; Juottonen et al. 2005; Godin et al. 2012). As their name implies, methanogens produce methane, a potent greenhouse gas, giving them particular relevance for research on global climate change. While methanogens do play a significant role in greenhouse gas production, both naturally (peatlands, etc.) and from anthropogenic sources (rice cultivation, cattle, etc.), there are relatively few pure culture representatives for such a diverse phylogenetic group (Liu 2010). This presents a challenge when trying to use modern DNA-fingerprinting-based approaches to understand both the diversity as well as the functioning as methodologies rely on a library of known sequences. This lack of cultured representatives is in large part due to the relative difficulty in isolating and maintaining cultures of strict anaerobes, such as methanogens (Narihiro and Kamagata 2013).
Anaerobic culturing is rooted in work by Hungate (1969) who first developed methodologies of excluding oxygen and growth on reduced media. These methods were further developed by Balch and Wolfe (1976); Balch et al. (1979) and summarized further by Sowers and Noll (1995). In the past two decades, culturing in general, and especially anaerobic culturing, has been much overlooked with the rapid development in sequencing technologies beyond that of the Sanger sequencing method; prompted in large part by the human genome project around 2001 (Collins et al. 2004). Since then, cost has decreased substantially and modern high-throughput sequencing has grown exponentially making discoveries using mass datasets possible (Earl et al. 2003; Steinberg and Regan 2008; Borrel et al. 2011; Sinclair et al. 2015). For example, recent metagenomic work has indicated that there may be microorganisms outside of the Euryarchaeota capable of methanogenesis (Evans et al. 2015); yet, all currently cultured methanogens are in the Euryarchaeota. This apparent contradiction between culture-based and molecular-based work highlights the fact that there is an evident need for enrichments and culture data that will complement and support environmental sequencing data.
Even in the age of next generation sequencing, some researchers continue to focus on culturing-based methods to answer numerous remaining questions that cannot simply be answered by mass DNA sequence information and data processing alone (e.g. Cadillo-Quiroz et al. 2008; Dedysh 2011; Harbison et al. 2016). Anaerobic culturing is a difficult and lengthy process requiring specialized lab equipment, but the use of enrichment techniques in combination with sequencing allows us to determine broad constraints on growth for a particular habitat while obtaining important genetic information with relative ease. In this study, we attempted to enrich and isolate novel methanogens while at the same time leveraged molecular fingerprinting tools to gain progressively more information at each step of the process. The overall goals of this work were to: (i) identify local peatlands with potentially novel organisms with global relevance, (ii) use a series of enrichments under varied conditions intended to promote methane production and growth of methanogens, (iii) track bacterial and methanogen communities in enrichments via molecular fingerprinting approaches to determine the complexity and composition in successful enrichments and (iv) attempt to isolate the methanogen species in pure culture on an artificial growth medium. Peatlands are important carbon-accumulating wetland ecosystems that play multiple roles in the global climate system, including as persistent sources of atmospheric CH4, and although they are the target system in this study, the approach presented could be applied subsequently in other methanogen habitats.
METHODS
Site selection and sampling
Multiple peatland study sites in Northern Ontario were sampled in the summer of 2014. Past molecular work by Godin et al. (2012) that indicated the presence of novel methanogens (high abundance of members of the Rice Cluster II clade) in the White River, ON (48°21'15.19" N, 85°20'14.10" W) peatland lead us to conduct initial enrichments with this peat. Sites in and around Sudbury, ON were screened in more depth using TRFLP (below) profiles and two additional sites were selected for this study including Cartier Forest (informal name 46°39'46.72" N, 81°31'15.00" W), Clear Water (informal name 46°22'9.40" N, 81°3'43.9" W) and Daisy Lake (informal name 46°27'14.57" N, 80°52'34.99" W). In each case, peat was collected anaerobically by digging a hole approximately 30 cm deep, or just below the water table. A 125 ml glass Mason jar was then submerged, and peat was packed into the jar and capped. Peat was stored on ice during transport to the lab and was either refrigerated or frozen prior to starting enrichments. Figure 1 depicts the general workflow post sampling that is further elaborated on below.
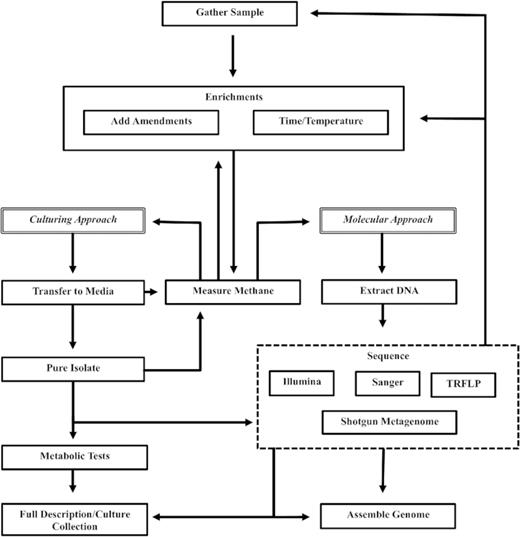
Schematic of Enrichment Methods. Traditional culturing methods follow the pathway on the left where after successful enrichment cultures are grown on artificial media. The right side of the figure depicts the modern approach where successful enrichments are sequenced and enrichment condition information is paired with modern sequencing analysis.
DNA extraction and PCR amplifications
Subsamples of peat from each site were extracted with the Power SoilTM DNA kit (MoBio, USA), following the manufacturer's protocol modified to include 0.5 g of peat in the bead tube and three washes with 500 μl of 5.5 M guanidine thiocyanate (humic compound removal) prior to the addition of the C5 solution. Enrichment DNA (below) extractions were also done using the Power SoilTM DNA kit and used 1 ml of enrichment media in place of peat. Extractions followed the manufacturer's protocol with the addition of a 10 min heat treatment at 65°C prior to bead beating. PCR amplifications were done using multiple primer pairs. The 16S rRNA 1AF(5′-TCY GKT TGA TCC YGS CRG AG-3′)—1100R (5′-TGG GTC TCG CTC GTTG-3′) pair (Hales et al. 1996) was used to broadly screen for methanogens and for TRFLP analysis. A methanogen specific mcrA gene was amplified using the mlasF-mod (5′- GGY GGT GTM GGD TTC ACM CAR TA-3′)—mcrAR (5′-CGT TCA TBG CGT AGT TVG GRT AGT-3′) (Luton et al. 2002; Juottonen, Galand and Yrjälä 2006; Angel, Claus and Conrad 2012). Bacterial PCRs were conducted using the broad spectrum 16S 27F–1492R primer pair (Suzuki and Giovannoni 1996). PCRs were done using ThermoFisher Phire Green Hot Start II master mix following the manufacturer's recommendations for amplification times with annealing temperatures of 55, 56 and 61°C for the 1AF–1100R, mlasF-mod–mcrAR and 27F–1492R, respectively. PCR products were confirmed by electrophoresis in a 1% agarose gel prior to downstream analyses.
Terminal restriction fragment length polymorphism (TRFLP)
A PCR using the 1AF–1100R primer pairing with a 6FAM fluorescent tag added to the terminal (3′) end of the reverse primer was carried out, and product cleaned with a GenElute™ PCR clean up kit (Sigma Aldrich). Fluorescently labeled DNA fragments were digested with HhaI and Sau96I enzymes (New England BioLabs) at 37°C for 120 min and then 65°C for 20 min and sent to the University of Guelph Laboratory Services for analysis on an Applied Biosystems 3730 DNA Analyzer. Peak locations were adjusted by 4 bp to correct for systematic read error, quality filtered to peaks >1% abundance and between 50 and 800 bp, and matched to a set of user defined known peaks based on prior TRFLP/cloning studies (Cadillo-Quiroz et al. 2006; Vianna et al. 2009; Yrjälä et al. 2011; Angel, Claus and Conrad 2012) using a custom R script that binned peaks into user defined ranges.
Enrichment technique
Methanogen enrichments were set up following the methods of Bräuer et al., (2006a,b). Peat was placed into a Coy anaerobic glove box (Grass Lake, MI), mixed with water in Balch style tubes (Chemglass CLS-4209–10), and capped with butyl rubber stoppers and crimp rings. Sterilized water and peat were added to tubes in a 9:1 ratio, respectively. Tubes were capped, crimped to seal, and removed from the glove box. Sample slurries were bubbled horizontally with an 80/20 mixture of N2/CO2 gas for 5 min to ensure anaerobic conditions using a vacuum manifold. Amendments and growth substrates common to peatlands and bacterial fermentative byproducts (e.g. acetate, H2) and other less common but potentially ecologically important byproducts (e.g. methanol, TMA) leading to methanogenesis were then added to the tubes using anaerobic culturing techniques outside of the glove box (see SI 1–4, Supporting Information, for full list). Amendments were added one at a time (typically in 0.1 ml volumes) and the process was repeated to obtain the desired mix of amendments in a particular enrichment tube (e.g. SI 2–4, Supporting Information). For tubes that required H2 in the headspace, an inline 0.45-micron filter was attached to flexible rubber tubing and a needle was fitted to the end. Hydrogen gas was added at 10 PSI for a 5 s count. Enrichments were then kept in the dark at either room temperature (ca. 22°C) or refrigerated at 6°C for varied durations. For more detailed methodological explanations of anaerobic enrichment processes see Wolfe (2011).
Methane measurements
Methane production was measured periodically to determine if enrichments and/or cultures were active. Samples (0.5 ml) were injected directly into the sample port of a SRI 8610C gas chromatograph (Torrance, CA) fitted with a flame ionization detector. Both methane and CO2 (after reduction in an in-line methanizer) were detected as methane. Instrument parameters included a column temperature of 105°C and a run time of 3 min.
Transfers to media
In an attempt to isolate methanogens in pure culture, or maintain stable mixed culture lines, enrichment substrate was anaerobically transferred to prepared growth media from Bräuer and references cited therein (2006a,b; SI 1, Supporting Information). Sterilized Balch tubes first had 5 or 10 ml of media (SI 1, Supporting Information) dispersed to tubes which were then capped with 20 mm thick butyl rubber stoppers (Chemglass CLS-4209-14), flushed with 80/20 mixture of N2/CO2, and autoclaved. Tubes were inoculated with 0.05 ml of liquid from highly methanogenic enrichments (avoiding peat) and anaerobic amendments (Rifampicin, Ampicillin, MES (2-(N-morpholino)ethanesulphonic acid)) at a 6 or 6.75 pH, TiNta, Vitamins, Yeast Extract, methyl Coenzyme M (CoM); SI 1, Supporting Information) were added (0.01 ml/ml of peat media). Appropriate carbon substrates were added (e.g. acetate) and tubes requiring H2 in the headspace were over pressured. Tubes were again monitored for methane production and visible growth; however, only bacterial growth was observed.
Sequencing
Following a successful enrichment and subculturing, DNA was extracted and PCR confirmed the presence of the mcrA and/or bacterial 16S rRNA genes. DNA was then sent for either capillary Sanger sequencing on an Applied Biosystem 3730xl DNA Analyzer at the Genome Quebec facility (McGill University, Montreal, Canada), or for amplicon sequencing using the Illumina MiSeq platform at Metagenom Bio Inc. (Waterloo, Ontario). Sanger sequencing was preformed on the mcrA specific primer pair (above) and the 27F-1492 R primer pair, and trace files were cleaned in MEGA version 6.06 (Tamura et al. 2007) before being compared to known sequences on the NCBI database using BLASTn (Leinonen, Sugawara and Shumway 2011). Illumina data for methanogens was again generated using the mcrA primer pair while bacteria were analyzed using the prokaryotic 341F (5′—CCT ACG GGN BGC ASC AG - 3′)—805R (5′—GAC TAC NVG GGT ATC TAA TCC - 3′) primer pairing (Sinclair et al. 2015). Output forward and reverse reads were put though a custom pipeline on Ontario's Compute Canada network (www.sharcnet.ca). Briefly, forward and reverse reads were quality filtered, adapter/primers trimmed and aligned into individual reads using the BBMap package (Bushnell 2016). QIIME commands were then used to merge data into one FASTA file and then to dereplicate sequences. Sequences were then abundance sorted and singletons discarded using USEARCH8 (Edgar 2010). Bacterial sequences were clustered at 97% while mcrA sequences were clustered at 85% (Hunger et al. 2011; Yang et al. 2014). Chimeric sequences were removed and taxonomy was assigned to OTUs using a greengenes database for bacteria and a custom mcrA library (Yang et al. 2014). Methanogen OTUs were checked to confirm that they were protein coding using Framebot (Wang et al. 2013). Final OTU tables were exported and further analysis done in R version 3.3.1 (R Core Team 2016). Sequences are available through the SRA database under SRA accession PRJNA503934.
RESULTS AND DISCUSSION
Enrichment strategy
Initial enrichments yielded methanogens closely related to those already isolated from peatlands (Bräuer et al. 2006a,b, 2011). TRFLP profiles in Fig. 2 panel A show that the original White River peat community was varied but converged on one dominant organism following enrichment with rifampicin (antibiotic targeting transcription initiation primarily in bacteria) and a homopipes buffer (an organic buffer that does not appear to supply methanogen substrate precursors; pH 5.4). Methane production was increased 10x in the rifampicin/homopipes sample compared to the H2N2CO2 control (7.68% and 0.76% CH4, respectively). Following TRFLP profiling, both microscopic work (Fig. 3) and Sanger sequencing of the 16S rRNA gene identified this organism as being 98% similar to Methanoregula boonei, the organism isolated and described in Bräuer et al. (2011). Most likely this is due to using similar methodology and conditions to enrich the peat and indeed it was shown that post isolation, obtaining the same organism again was relatively easy using the predetermined conditions and growth substrates (Bräuer, Yavitt and Zinder 2004; Bräuer et al. 2006b). Thus, our results indicate that the same organism can be isolated under similar conditions from distant peatlands. Taking these factors into consideration, we shifted focus with later enrichments and attempted to isolate not only hydrogenotrophic methanogens but also aceticlastic and/or diverse metabolic methanogens with abilities to grow on varied carbon substrates (i.e. Methanosarcinales; see Liu (2010). With this in mind, the ca. 100 bp peak in panels C and D of Fig. 2 indicated potential presence of aceticlastic methanogens, and peat from these sites became the focus of later enrichments.

TRFLP Electropherograms of archaeal SSU rRNA genes amplified with 1AF-1100R-HEX and restricted with HhaI and Sau96I using DNA extracts of from (A), White River Fen peat, (B), a 30-day anaerobic enrichment of White River Fen peat in a 9:1 (water:peat) mix amended with 0.1 ml of homopipes buffer (pH 5.4) and 0.1 mg of rifampicin, (C), Clear Water peat, and (D), Cartier Forest peat.
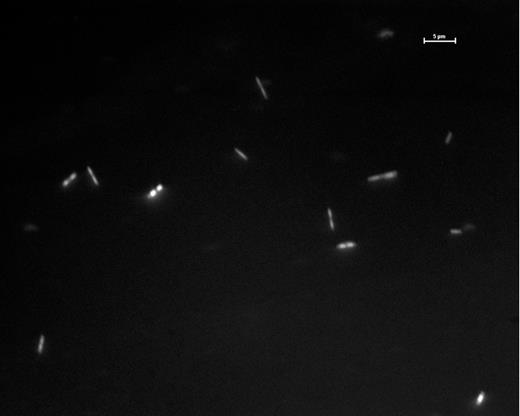
Epiflorescence image of cells from White River Fen peat enriched anaerobically in a peat/water slurry with homopipes buffer (pH 5.4) viewed at 1000x, and stained with acridine orange (white bar = 5 μm).
On December 7, 2014 we used peat from both Clear Water and Cartier Forest (Fig. 2, panels C and D) to attempt the enrichment and isolation of a novel RCII species (Großkopf, Stubner and Liesack 1998). Enrichment treatments are outlined in SI 2 and SI 3 (Supporting Information) and are the product of numerous shorter trial enrichments (data not shown) using similar substrates and amendments (concentrations are listed in SI 1, Supporting Information). Isolation of methanogens has historically focused on environments that have one type of extreme condition. For example, temperature extremes (ca. 55–57°C) have been used to isolate novel methanogens from both natural environments (Harris, Pinn and Davis 1984) as well as in artificial settings such as anaerobic digesters (Kamagata and Mikami 1991). This strategy has been relatively successful to date; however, enrichment and isolation from environments with less extreme conditions are uncommon (Narihiro and Kamagata 2013). In this study, we used low temperature (6°C) to mimic conditions in most northern latitude peatlands and to target novel species. Time, however, became a factor and substantial amounts of methane (>5%) normally obtained in other enrichment trials were not seen at any point in the incubation. For instance, it took nearly 2 years to accumulate samples with >2% methane concentrations (SI 2–3, Supporting Information). This lengthy process has been shown in other enrichment studies (Vartoukian, Palmer and Wade 2010) and highlights the difficulty in isolating novel/slow-growing organisms. In contrast, the second set of enrichments (Daisy Lake) discussed in this study began nearly a year later and only took 2 months to reach headspace methane values far in excess of 5% at an incubation temperature of 22°C (SI 4, Supporting Information). In this case, we took advantage of a peatland that has historically been impacted by smelting activities and subsequent sulphur and metals contamination. This allowed us to enrich peat at a higher pH than conditions that had previously led to re-obtaining M. boonei (6.75 MES buffer compared to 5.4 homopipes) in other enrichment attempts.
Methanogen communities
Results of enrichments indicate that there is a strong preference for the presence of hydrogen in the headspace gas mixture, with few samples reaching above 2% methane concentrations when only N2CO2 gas was available (Table 1 and SI 2–4, Supporting Information). In principle, the absence of hydrogen should lead to the aceticlastic methanogens (Kamagata and Mikami 1991; Ma, Liu and Dong 2006; Mori et al. 2012), but these enrichments proved to be the most difficult. We noticed no difference in sequence counts for samples sequenced from the enrichment media (Cartier Forest, Clear Water) and samples that were sequenced from the first transfer to artificial media (Daisy Lake samples); mcrA reads averaged ca. 4450 per sample (Table 2). We advise that during transfer to artificial media a portion of the sample is retained and frozen for later DNA-based work, as transfers are rarely successful and the large number of samples likely means that routine sequencing at every step is often not practical. The methanogens obtained in this work, to our knowledge, are uncultured, but have been found in multiple environments using DNA extraction and marker-gene sequencing based community fingerprinting approaches (Table 3). In large part, the closest related sequences had good coverage and identity and were also obtained from peatland habitats globally, indicating that these methanogens may have a broad distribution.
Sequenced Enrichments and Transfers. Experimental layout for enrichment samples that had significant accumulation of methane. Enrichment additions consisted of 0.1 mL into a 9:1 water to peat mixture following concentrations in SI 1 (Supporting Information). Methane was measured in all samples on three dates. Daisy Lake samples were incubated for approximately 2 months and Cartier Forest and Clear Water for 2 years.
| Sample | Headspace | Enrichment Additions | Temperature | ||
|---|---|---|---|---|---|
| Daisy Lake 6–6 | H2N2CO2 | MES | Ampicillin | Methanol | 22 |
| Daisy Lake 6–6.75 | H2N2CO2 | MES | Ampicillin | Methanol | 22 |
| Daisy Lake 8–6 | H2N2CO2 | MES | Ampicillin | TMA | 22 |
| Daisy Lake 8–6.75 | H2N2CO2 | MES | Ampicillin | TMA | 22 |
| Daisy Lake 9–6 | H2N2CO2 | MES | Ampicillin | Acetate | 22 |
| Daisy Lake 15–6 | H2N2CO2 | TMA | 22 | ||
| Daisy Lake 15–6.75 | H2N2CO2 | TMA | 22 | ||
| Daisy Lake 16–6 | H2N2CO2 | Acetate | 22 | ||
| Daisy Lake 16–6.75 | H2N2CO2 | Acetate | 22 | ||
| Daisy Lake 23–6 | N2CO2 | MES | Rifampicin | TMA | 22 |
| Daisy Lake 23–6.75 | N2CO2 | MES | Rifampicin | TMA | 22 |
| Cartier Forest 30 | H2N2CO2 | Ampicillin | PM1 | 6 | |
| Clear Water 26 | H2N2CO2 | Ampicillin | Acetate | 6 | |
| Clear Water 27 | H2N2CO2 | Ampicillin | CoM | 6 | |
| Clear Water 30 | H2N2CO2 | Ampicillin | PM1 | 6 | |
Daisy Lake samples were sequenced following the first transfer to artificial growth media and all had MES buffer added at either a pH of 6 or 6.75 reflected in the samplename Cartier Forest and Clear Water were sequenced directly from enrichments.
Details on enrichment additions can be found in SI1 and complete original enrichments in SI 2–4 (Supporting Information).
MES (2-(N-morpholino)ethanesulphonic acid)), PM1 (Peat Media 1 see SI (Supporting Information) for composition), CoM (methyl Coenzyme M, TMA (trimethylamine).
Methanogen OTU amplicon counts from Illumina sequencing of the mcrA gene. Of 28 total OTUs detected across all enrichment samples, only 10 OTUs had total read counts over 200; less abundant OTUs were excluded from analysis. The numbers in the sample names indicate treatments listed in SI 2–4 (Supporting Information) and MES buffer pH (Cartier and Clear Water samples were unbuffered).
| OTU | Daisy Lake 6–6 | Daisy Lake 6–6.75 | Daisy Lake 8–6 | Daisy Lake 8–6.75 | Daisy Lake 9–6 | Daisy Lake 15–6 | Daisy Lake 15–6.75 | Daisy Lake 16–6 | Daisy Lake 16–6.75 | Daisy Lake 23–6 | Daisy Lake 23–6.75 | Cartier Forest 30 | Clear Water 26 | Clear Water 27 | Clear Water 30 |
|---|---|---|---|---|---|---|---|---|---|---|---|---|---|---|---|
| 1 | 1753 | 892 | 2225 | 14 | 475 | 1264 | 9526 | 2529 | 467 | 1088 | 3996 | 1592 | 1989 | 2718 | 1004 |
| 2 | 0 | 956 | 0 | 1 | 4304 | 24 | 0 | 1593 | 0 | 13 | 719 | 978 | 0 | 556 | 1368 |
| 3 | 1915 | 74 | 1114 | 69 | 828 | 717 | 306 | 276 | 722 | 2818 | 384 | 230 | 2673 | 184 | 4313 |
| 4 | 31 | 1 | 16 | 908 | 69 | 5 | 849 | 14 | 724 | 33 | 3 | 18 | 24 | 1 | 5 |
| 5 | 0 | 280 | 0 | 0 | 1 | 0 | 0 | 695 | 0 | 0 | 74 | 309 | 0 | 338 | 2 |
| 6 | 0 | 9 | 0 | 1 | 73 | 7 | 6 | 159 | 8 | 8 | 279 | 198 | 1 | 107 | 6 |
| 7 | 119 | 1 | 41 | 19 | 1 | 10 | 3 | 1 | 105 | 405 | 0 | 1 | 61 | 0 | 11 |
| 8 | 0 | 2 | 0 | 1 | 16 | 22 | 0 | 61 | 0 | 365 | 42 | 19 | 0 | 23 | 26 |
| 9 | 38 | 3 | 21 | 9 | 18 | 11 | 17 | 21 | 81 | 187 | 14 | 24 | 31 | 10 | 83 |
| 10 | 0 | 6 | 2 | 0 | 0 | 1 | 4 | 172 | 5 | 44 | 213 | 76 | 8 | 86 | 0 |
| Total | 3856 | 2224 | 3419 | 1022 | 5785 | 2061 | 10 711 | 5521 | 2112 | 4961 | 5724 | 3445 | 4787 | 4023 | 6818 |
Methanogen OTU identification. A BLAST search of sequences associated with each methanogen OTU. The clone with the highest identity and related publication and accession number are presented. The finest known taxonomic classification is also included from metagenomic processing.
| OTU | Coverage (%) | Identity (%) | Closest Methanogen Clone | Accession Number | Citation | Taxonomic Classification |
|---|---|---|---|---|---|---|
| 1 | 100 | 96 | OA_E11 | HE774285 | Franchini and Zeyer, 2012 | Archaea |
| 2 | 100 | 99 | SpM13 | AB570067 | Narihiro et al. 2011 | Archaea |
| 3 | 100 | 99 | GKC12 | LN716320 | Hunger, Gößner and Drake 2015 | Methanosaetaceae |
| 4 | 100 | 100 | BogVII | AJ586247 | Galand et al. 2005 | Archaea |
| 5 | 100 | 98 | SpM9 | AB570063 | Narihiro et al. 2011 | Euryarchaeota |
| 6 | 100 | 97 | 329_19g | KT225456 | Söllinger et al. 2016 | Archaea |
| 7 | 99 | 97 | Kd3 | LT632529 | Unpublished | Archaea |
| 8 | 100 | 99 | OA_B01 | HE774271 | Franchini and Zeyer, 2012 | Euryarchaeota |
| 9 | 99 | 100 | Ac32 | LT632444 | Unpublished | Archaea |
| 10 | 100 | 99 | A21F12 | LN716961 | Hunger, Gößner and Drake 2015 | Methanosaetaceae |
In total, 10 distinct methanogenic strains across five of the seven methanogenic orders were enriched in 15 different enrichment tubes (>200 reads, Table 2). Of the most abundant sequences, OTU 1 and 3 appear to be hydrogenotrophic methanogens likely in the Methanomicrobiales, and potentially related to M. boonei but probably representing distinct species or strains (Fig. 4). Franchini and Zeyer (2012) recovered a clone related to the ‘fen cluster’ that formed a distinct OTU in their study from an alpine fen in Oberaar, Switzerland that was related closely to our OTU 1. This sequence was most common in Daisy Lake samples (pH 5.1), 8–6, 15–6.75 and 23–6.75, which were all amended with trimethylamine (TMA) and Clear Water 27 that only had CoM added. Given our data, it appears that the relatively culturable strains of this organism from these sites grew well at a high pH, and that TMA are a potential energy source. It should be noted that M. boonei was isolated from an acidic (pH 3.4–4.3) peat bog (Bräuer et al. 2011) and related sequences have been found to be abundant in low pH sites (Hales et al. 1996). OTU 1 appeared in samples that had either H2 or TMA present, and demonstrated in highest relative abundance and highest methane production (7.67%) in enrichments containing the combination of the two (Daisy Lake 15-6.75; SI 4, Supporting Information). A phylogenetically close relative of OTU 1 is OTU 3 (Fig. 4), and was the most abundant sequence in four of the samples, however, it was only dominant in Clear Water 30 (pH 3.7) and moderately so in Daisy Lake 23, with high rates of co-occurrence with OTU 1. OTU 3 was abundant in enrichments that had varied substrate additions (methanol, TMA, acetate and peat media) but it is unclear if these served as substrates for bacterial growth and H2 production, or directly for methanogen growth. Given the phylogenetic positioning (Fig. 4), OTU 3 is likely a hydrogenotrophic methanogen. The most closely related clone (LN716320) to OTU 3 was not abundant in sites studied by Hunger, Gößner and Drake (2015). However, like OTU 3 in this study, the most abundant clone in their study (LN716347) was also most closely related to M. boonei and was found in two bogs (pH 4.9 and 3.9) and an acidic fen (pH 4.3) in Germany, but was absent from a neutral (pH 7.6) fen in the same study. Similarly, Hunger, Gößner and Drake (2015) found that substrate additions of glucose, acetate and H2 led to high rates of methane production. Taken together, it appears that OTU 3 is likely a closely related strain of M. boonei that also grows at low pH, while OTU 1 is more likely a distinct species that could grow at higher pH conditions more commonly found in richer fens.
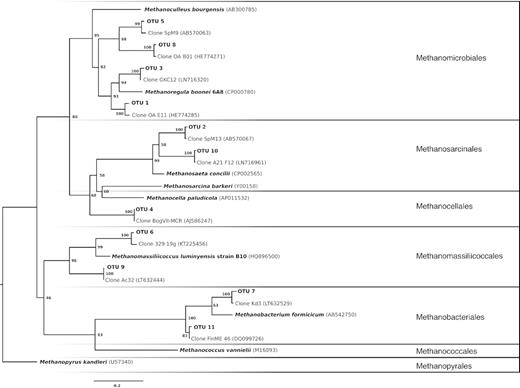
Phylogenetic tree of mcrA gene. Maximum likelihood tree of enrichments from Daisy Lake, Cartier Forest and Clear Water. A Bayesian model with 1000 replicates was used and node labels indicate bootstrap values. Branches are arranged by methanogen orders according to cultured representatives. The tree was rooted to Methanopyrus kandleri. Clones represent the closest published match by BLAST search.
There was evidence of non-hydrogenotrophic OTUs dominating four of our enrichments (Table 2). OTU 2 clustered within the Methanosarcinales (Fig. 4), and also grew well in the presence of acetate, providing additional support that hydrogenotrophy was not the primary energy source. OTU 2 was most abundant in Daisy Lake 6–6.75 but was less than 50% of the reads in that enrichment. However, OTU 2 was both abundant and dominant in Daisy Lake 9–6 (Table 2). A closely related clone (99% ID across 426 nucleotides) was found in a Japanese bog where Methanomicrobiales dominated and Methanosaeta spp. accounted for only 4.9% of the mcrA community (Narhiro et al. 2011). OTU 4 was also a dominant sequence, although read numbers were low and sometimes OTUs 1 and 3 were also abundant (e.g. Daisy Lake 16–6.75). Daisy Lake 8–6.75 did contain a large proportion of OTU 4. However, the total read count for mcrA was low in this sample, potentially indicating low methanogen abundance. Phylogenetic resolution is a bit unclear as it does not cluster well with either the Methanosarcina or Methanosaeta and may in fact be related to the Methanocellas and RCI lineage, which includes hydrogenotrophic methanogens (Sakai et al. 2008).
Dynamics of the putative methanogen syntrophs
Bacterial communities were not the main focus of this work, however, when transferring to artificial media it became apparent that anaerobic bacterial growth was easier to obtain than methanogenic growth. Herein, we will focus on three enrichments that had dominant and abundant methanogen communities and their associated bacterial communities (Table 4). Daisy Lake 9 contained one dominant bacterial OTU (b-OTU; b-OTU 4) most closely related to Clostridium magnum, a common anaerobic soil species that produces acetate in the presence of H2 (Bomar, Hippe and Schink 1991) and in some cases is resistant to ampicillin (Brook, Wexler and Goldstein 2013). Interestingly, this enrichment did have H2 present as well as acetate, and the methanogen OTU 2 which dominated this enrichment clustered well with known aceticlastic methanogens which can use multiple methanogenesis pathways; indicating either a potential mutualistic relationship where C. magnum benefits from the presence of H2 and the methanogen from the subsequent production of acetate or potentially the methanogen is also hydrogenotrophic and neither organism benefit from the presence of acetate. Of the other methanogen enrichments, Daisy Lake 23–6.75 also had a dominant (>900 reads) bacterial affiliate (Table 4). In this case, the associated bacteria were in the b-OTU 3, closely related to the proposed Desulfonatronum parangueonese sp. nov. (Table 5; Perez-Bernal et al. 2017). This species is anaerobic and known to grow on lactate, formate, pyruvate and ethanol in the presence of sulphate, and to produce acetate. The dominant methanogen in this enrichment was likely hydrogenotrophic (methanogen OTU 1), so there is little evidence of a direct link between the two species. However, one species of Methanoregula, M. formicica can grow on formate (Yashiro et al. 2011), so it is possible that this strain of D. paraangueonese may also ferment formate as well as acetate. Finally, the Daisy Lake 15–6.75 enrichment had a co-culture of bacteria, both belonging to Clostridium (Tables 4 and 5). The more abundant of the two was again the Clostridium magnum strain also seen in Daisy Lake 9-6, and the other abundant species was related to a Clostridium aciditolerans strain isolated from a constructed wetland (Lee, Romanek and Wiegel 2007). The C. aciditolerans strain is obligately anaerobic, grows on a variety of substrates, and is known to produce acetate, butyrate and ethanol from glucose (Lee, Romanek and Wiegel 2007). The strain is not known to use H2 and subsequently, in contrast to the Daisy Lake 9–6 sample where an aceticlastic methanogen dominated, the hydrogenotrophic methanogen OTU 1 was dominant. The presence of Clostridium spp. in the enrichments is also interesting as the strains present are known to form endospores (Chin et al. 1998; Lee, Romanek and Wiegel 2007) making them ideal for surviving harsh environmental conditions such as those in peatlands for long periods of time.
Bacterial OTU (b-OTU) amplicon counts from Illumina sequencing of the 16S rRNA gene. Only OTUs with total read counts over 1000 were included in analysis, excluding 69 of the total 78 OTUs across all enrichment samples. Removed OTUs were never a dominant component of the community composition. The numbers in the sample names indicate treatments listed in SI 2–4 (Supporting Information) and MES buffer pH (Cartier and Clear Water samples were unbuffered).
| b-OTU | Daisy Lake 6–6 | Daisy Lake 6–6.75 | Daisy Lake 8–6 | Daisy Lake 8–6.75 | Daisy Lake 9–6 | Daisy Lake 15–6 | Daisy Lake 15–6.75 | Daisy Lake 16–6 | Daisy Lake 16–6.75 | Daisy Lake 23–6 | Daisy Lake 23–6.75 | Cartier Forest 30 | Clear Water 26 | Clear Water 27 | Clear Water 30 |
|---|---|---|---|---|---|---|---|---|---|---|---|---|---|---|---|
| 1 | 24 | 326 | 2095 | 15 179 | 25 | 0 | 0 | 83 | 68 | 0 | 0 | 0 | 0 | 0 | 0 |
| 2 | 0 | 0 | 0 | 0 | 0 | 0 | 0 | 0 | 0 | 0 | 0 | 1827 | 3 | 9439 | 0 |
| 3 | 0 | 0 | 0 | 0 | 0 | 0 | 0 | 0 | 0 | 4195 | 3713 | 0 | 0 | 0 | 0 |
| 4 | 833 | 0 | 553 | 170 | 11 250 | 4909 | 3591 | 1074 | 532 | 0 | 2 | 0 | 0 | 0 | 0 |
| 5 | 13 | 0 | 3 | 4 | 39 | 104 | 82 | 3675 | 2396 | 0 | 0 | 0 | 0 | 0 | 0 |
| 6 | 0 | 0 | 0 | 0 | 0 | 0 | 0 | 0 | 0 | 0 | 0 | 0 | 3875 | 0 | 199 |
| 7 | 0 | 0 | 0 | 0 | 0 | 0 | 0 | 0 | 0 | 0 | 0 | 0 | 0 | 96 | 1911 |
| 8 | 526 | 0 | 573 | 195 | 312 | 3030 | 2078 | 6 | 1 | 0 | 0 | 0 | 0 | 0 | 0 |
| 9 | 9 | 0 | 0 | 0 | 0 | 0 | 0 | 0 | 4 | 568 | 559 | 0 | 0 | 0 | 0 |
| Total | 1405 | 326 | 3224 | 15 548 | 11 626 | 8043 | 5751 | 4838 | 3001 | 4763 | 4274 | 1827 | 3878 | 9535 | 2110 |
Bacterial OTU (b-OTU) identification. A BLAST search of sequences associated with each b-OTU. The clone or species with the highest identity and related publication and accession number are presented.
| b-OTU | Coverage (%) | Identity (%) | Closest-Published Bacteria | Accession Number | Citation |
|---|---|---|---|---|---|
| 1 | 100 | 96 | Paludibacter propionicigenes | CP002345 | Gronow et al. 2011 |
| 2 | 100 | 100 | clone A14E04 | LN715329 | Hunger, Gößner and Drake 2015 |
| 3 | 100 | 95 | Desulfonatronum sp. strain PAR190 | KY041866 | Pérez-Bernal et al. 2017 |
| 4 | 100 | 99 | Clostridium magnum strain 120ft5 | MG648150 | Unpublished |
| 5 | 100 | 98 | Clostridium sp. strain RPec1 | Y15985 | Chin et al. 1998 |
| 6 | 100 | 99 | Bacterium K-5b10 | AF524859 | Sizova et al. 2003 |
| 7 | 100 | 99 | Rhodospirillaceae bacterium IA_FO_10 | LN831188 | Labadie et al. 2015 |
| 8 | 100 | 98 | Clostridium aciditolerans strain JW/YJL-B3 | NR_04 3557 | Lee, Romanek and Wiegel 2007 |
| 9 | 100 | 98 | Desulfovibrio sp. LG-2009 | FN557161 | Unpublished |
Future directions for mixed culture studies
Herein, methanogenic archaea were enriched with one or more specific bacteria, suggesting a strong inter-relationship between these organisms. Syntrophic associations between methanogens and bacteria are well represented in the literature (Mcinerney, Sieber and Gunsalus 2009; Sieber et al. 2010) and appear to be widespread in the environment (Chin et al. 1998; Morris et al. 2013; Kouzuma, Kato and Watanabe 2015). It is clear given our data that enrichments with bacterial and methanogens present are far easier to obtain than subsequent attempts to separate the organisms, all of which failed in our repeated attempts. Methods such as physical separation, use of antibiotics and a variety of other strategies have been proposed and attempted with limited success (Vartoukian, Palmer and Wade 2010; Pham and Kim 2012). For example, a novel isolate Methanocella paludicola (Sakai et al. 2008) was first enriched and co-cultured with Syntrophobacter fumaroxidans, before going through a series of serial dilutions (lasting a year) to eventually obtain the pure methanogen isolate (Sakai et al. 2007). In this case, Sakai et al. (2007) used S. fumaroxidans as a source of H2 for the methanogen, finding that overpressure in the headspace enabled other already isolated methanogens to outcompete M. paludicola. Our results along with those in the literature indicate that molecular- and/or genetic-based tools can be successfully combined with co-culturing or enrichments as a realistic method of obtaining valuable information such as substrate limitations or temperature optima from novel species in mixed culture. If mutualistic and/or syntrophic relationships are as frequent in methanogens as evidenced here, then the central dogma surrounding methane production needs to shift to include bacterial interactions. Future research should consider not only the functions of methanogens, but rather the functions and interactions of co-cultures and/or mixed cultures. While enrichment work does not meet IJSEM standards for culturing, it does provide far more information than is currently available with clone and amplicon sequences that are abundant in sequence databases. Furthermore, by obtaining whole genomes, genetic potential via gene analysis can be determined to further aid attempts to isolate organisms should that become an eventual end goal. This need for quality long DNA reads is not unique to the archaeal or methanogen world, but environmental microbiology in general could adopt these concepts to move the field forward as a whole and obtain critical information from the ‘99% of unculturable’ microorganisms (Pham and Kim 2012).
CONCLUSIONS
Our work indicates that novel methanogens from at least five of the seven methanogenic orders are present in peatland ecosystems. Given the importance of these sites in global methane production and emissions to the atmosphere, work to identify these organisms beyond a single marker gene is of critical importance. While isolation of novel methanogens has proven to be difficult, both here and elsewhere, by combining classical isolation and enrichment techniques with modern sequencing technologies, we are able to obtain a reasonable amount of information to describe novel organisms. This approach will help to bolster the overall number of sequences in our reference libraries, while providing a broad sense of potential growth conditions and methanogen phylogeny. A deeper understanding of the physiological ecology of peatland methanogens is of utmost importance, as few relevant methanogenic isolates have been cultured from these habitats (Cadillo-Quiroz, Yavitt and Zinder 2009; Bräuer et al. 2011; Cadillo-Quiroz et al. 2014), and our overall understanding of this guild is largely dependent on work done in other ecosystems. Novel methanogens in peatlands, and other habitats, will likely be found in areas with unique ‘defining’ characteristics (selective pressures) such as high metal concentrations or a pH extreme that allows for a unique approach in enrichment work. That is to say directly replicating past work will likely not lead to discovery of novel organisms. Additionally, future work should attempt to go beyond amplicon sequencing and incorporate shotgun metagenomic approaches in an attempt to obtain whole genomes of both methanogens as well as their potential syntrophic bacterial partners. While work in obtaining isolates is still viewed as important and should be attempted, this should not be the sole goal in the modern age of sequencing technology.
ACKNOWLEDGEMENTS
We would like to thank Laurentian University's Department of Biology and the Vale Living with Lakes Centre. In addition, we thank Thomas Merrit who supplemented our funding for the addition of a Coy anaerobic glovebox to our lab and Nadia Mykytczuk who aided in sequence submission.
AUTHOR CONTRIBUTIONS
MC and SB conceived of the study and enrichment methods work. All authors contributed to site selection and overall study goals as well as edits to the manuscript. MC did the lab work and data analysis as well as the writing of the manuscript.
FUNDING
This work was supported by the Ontario Trillium Foundation, which awarded an Ontario Trillium Scholarship for international PhD students [to MC]; and research funding from the Natural Sciences and Engineering Research Council Discovery and Canada Research Chair programs [grant numbers 341381, 228457 to NB].
Conflict of interest: None declared.
