


ABSTRACT
We measured Vibrio spp. distribution and community profile in the tropical estuary of Port Klang and coastal water of Port Dickson, Malaysia. Vibrio spp. abundance ranged from 15 to 2395 colony forming units mL−1, and was driven by salinity and chlorophyll a (Chl a) concentration. However, the effect of salinity was pronounced only when salinity was <20 ppt. A total of 27 Vibrio spp. were identified, and theVibrio spp. community at Port Dickson was more diverse (H′ = 1.94 ± 0.21). However species composition between Port Dickson and Port Klang were similar. Two frequently occurring Vibrio spp. were V. owensii and V. rotiferianus, which exhibited relatively higher growth rates (ANCOVA: F > 4.338, P < 0.05). Co-culture experiments between fast- and slow-growing Vibrio spp. revealed that fast-growing Vibrio spp. (r-strategists) were overwhelmed by slower-growing Vibrio spp. (K-strategists) when nutrient conditions were set towards oligotrophy. In response to resource availability, the intrinsic growth strategy of each Vibrio spp. determined its occurrence and the development of Vibrio spp. community composition.
INTRODUCTION
Vibrio spp. are Gram negative heterotrophic bacteria indigenous in estuaries and coastal waters (Thompson, Iida and Swings 2004a). There are at least 115 known Vibrio spp. and they hold critical roles in nutrient and dissolved organic matter cycling (Thompson, Iida and Swings 2004a; Lin et al.2018). Some Vibrio spp. (e.g. V. cholera, V. parahaemolyticus, V. vulnificus, V. coralliilyticus) are known to cause diseases in humans and marine organisms like fishes, shrimps and corals (Lightner and Redman 1998; Rosenberg and Falkovitz 2004; Thompson, Iida and Swings 2004a; Ang et al.2010). Therefore, it is important to understand Vibrio spp. distribution in the environment.
Temperature, salinity and nutrient concentrations are among the important environmental factors that influence Vibrio spp. dynamics (Eiler, Johansson and Bertilsson 2006; Oberbeckmann et al.2012; Froelich et al.2013; Takemura, Chien and Polz 2014). In temperate waters, temperature is an important driver where Vibrio spp. are usually abundant in summer but are greatly reduced in winter (Turner et al.2009; Takemura, Chien and Polz 2014). In contrast, the effects of salinity on Vibrio spp. varies according to the range of salinity at a particular site (Hsieh, Fries and Noble 2008; Turner et al.2009; Oberbeckmann et al.2012). Vibrio spp. show a mostly positive correlation with salinity but this relationship can also be masked by increased temperature and nutrient concentration (Hsieh, Fries and Noble 2008; Oberbeckmann et al.2012). Others have shown how the effects of nutrients differ. For example, ammonium aids in Vibrio spp. proliferation but silicic acid and phosphate have an opposite effect on Vibrio spp. population (Asplund et al.2011; Oberbeckmann et al.2012). In tropical countries where temperatures are relatively stable, Vibrio spp. seasonality is also observed (Asplund et al.2011; Vijayan and Lee 2014). Factors other than temperature may play a more important role in the tropics.
Other than environmental factors, the combined effects of growth and loss (e.g. grazing mortality) also determine Vibrio spp. dynamics. Grazing by predators is able to reduce Vibrio spp. persistence in the aquatic environment but this is usually counter-balanced by rapid growth in favourable conditions (Worden et al.2006). Most studies on Vibrio spp. emphasized survival and growth of pathogenic Vibrio spp. and the factors regulating them (Eiler et al.2007; Böer et al.2013; Takemura, Chien and Polz 2014), and less is known about the factors that lead to the development of other predominating Vibrio sp. As each species possesses unique physiological responses for adaptation to environmental change (Kjelleberg, Marshall and Hermansson 1985; Fierer, Bradford and Jackson 2007; Hibbing et al.2010), we hypothesized that intrinsic growth strategies (i.e. r- and K- growth strategies) influence the development of Vibrio spp. community structure.
In this study, we compared observations at both a tropical estuary and coastal waters in order to elucidate the environmental factors that drive Vibrio spp. dynamics. The relatively stable temperature regime should allow us to discern the importance of other factors. Other than environmental factors, we also measured both Vibrio spp. growth and grazing loss rates to supplement our understanding of the Vibrio spp. distribution observed. Co-culture experiments with two Vibrio spp. were also carried out, and the differences in Vibrio spp. growth patterns at different nutrient concentrations revealed the importance of intrinsic r- and K- growth strategies in the development of Vibrio spp. community structure.
MATERIALS AND METHODS
Environmental parameters
We collected 5 L of surface water using acid-cleaned bottles at Port Klang and Port Dickson (Fig. 1), monthly from Sept 2013 until Oct 2015. Both stations are located along the west coast of Peninsular Malaysia. Port Klang (03°00.1′N, 101°23.4′E) is a busy port with extensive manufacturing facilities, located at an estuary whereas Port Dickson (02°29.5′N, 101°50.3′E) is an oligotrophic coastal water system popular for recreational activities (Lee and Bong 2008). Physical parameters such as temperature (±0.1°C) and salinity (±0.1 ppt) were measured in situ using a conductivity meter (YSI Pro 30, USA). Dissolved oxygen (DO) was fixed in situ using manganese (II) chloride and alkaline iodide solution, and then measured in triplicate via Winkler's method (Grasshoff, Kremling and Ehrhardt 1999). Samples for total bacteria counts were preserved on site with glutaraldehyde (1% final concentration) whereas samples for bacterial culture were collected using autoclaved bottles (121°C, 15 min) and kept cold in an ice-box before processing in the laboratory within 3 h.
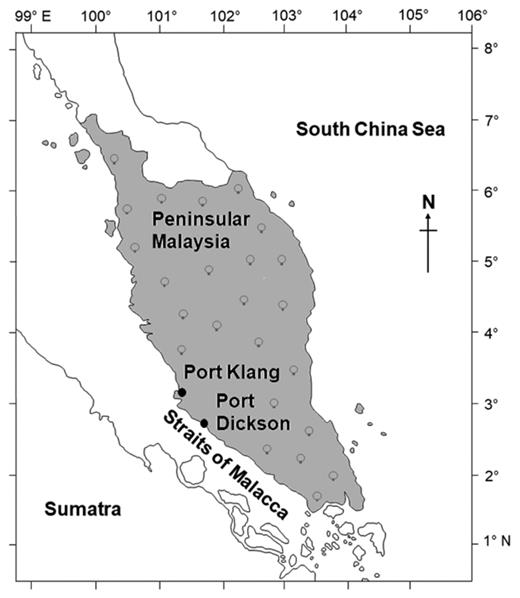
Map showing the location of Port Klang (03°00.1′N, 101°23.4′E) and Port Dickson (02°29.5′N, 101°50.3′E), west of Peninsular Malaysia.
In the laboratory, 500 mL of water sample was filtered with GF/F filter (Whatman, UK) and the filtrate was kept frozen (‒20°C) until determination of inorganic nutrient concentrations [ammonium (NH4), nitrate (NO3), nitrite (NO2), phosphate (PO4), and silicate (SiO4)] via colorimetric analysis (spectrophotometer U‒1900 Hitachi, Japan) (Parsons, Maita and Lalli 1984). The filter used in filtration was dried at 70°C for at least 1 week, and weighed to obtain total suspended solids (TSS). The same filter was combusted at 500°C for 3 h, and the weight loss was measured to obtain particulate organic matter (POM). Another 500 mL of water was filtered using a separate GF/F filter and this filter was immersed in 90% acetone at ‒20°C overnight for chlorophyll a (Chl a) extraction. Chl a was then measured in a spectrofluorometer (PerkinElmer LS55, USA) at an excitation/emission wavelength of 440/680 nm (Lohrenz, Weidemann and Tuel 2003). For estimation of Chl a concentration, the fluorescence intensity was normalized to a commercially available Chl a standard (Sigma‒Aldrich cat no. C5753, UK).
Some of the filtrate was acidified to ≤pH 2 using 37% HCl (Merck, USA) and kept at −20°C before dissolved organic nutrient measurement. Analysis was set at three injections of 150 µL per sample with a maximum integration time of 5 min using a Total Carbon Analyser that is equipped with a Total Nitrogen unit (Shimadzu TOC-L, Japan). Dissolved organic carbon (DOC) and total dissolved nitrogen concentrations were detected simultaneously (Lee, Bong and Hii 2009a). Concentrations were obtained by comparing against six-point standard curves of potassium hydrogen phthalate and KNO3 for total carbon and total nitrogen, respectively. A mixture of Na2CO3 and NaHCO3 were also used to prepare a standard curve for inorganic carbon concentration. Dissolved organic nitrogen (DON) concentrations were obtained by subtracting dissolved inorganic nitrogen (NH4+NO3+NO2) from total dissolved nitrogen.
For the estimation of total bacterial abundance, preserved samples were stained for 7 min with 4′6-diamidino-2-phenylindole (DAPI, final concentration 0.1 μgL−1) and filtered onto 0.2 µm pore-size black polycarbonate membrane filter (Isopore membrane filter, Merck Millipore, USA) (Porter and Feig 1980). The stained sample was then viewed under an epifluorescence microscope (Olympus BX60, Japan) with a U‒MWU filter cassette (excitor 330–385 nm, dichroic mirror 400 nm, barrier 420 nm). The same field was also observed under a U‒MWG filter cassette (excitor 510–550 nm, dichroic mirror 510 nm, barrier 590 nm) to correct for auto-fluorescing picoplankton.
Abundance and growth of Vibrio spp.
For Vibrio spp. enumeration, each sample was cultured using both spread plating and membrane filtration methods on Thiosulfate Citrate Bile salt Sucrose (TCBS) agar (BD Difco, USA) at 30.0 ± 0.2°C for 24 h. On this selective and differential medium, green and yellow colonies were isolated as presumptive Vibrio spp. and further purified for identification.
As Vibrio spp. abundance is the sum of both Vibrio spp. growth and grazing loss, it is essential to measure both these process rates. To reduce grazing pressure and to provide adequate nutrients, 20 mL of unfiltered water samples were diluted with 80 mL of <0.2 μm filtrate to make a final volume of 100 mL, and the microcosm was then incubated at 30.0 ± 0.2°C. Colony forming units (cfus) on TCBS were measured every 6 h over a 24 h incubation. As Vibrio spp. reached stationary phase after 12 h, the slope of the natural logarithmic increase in Vibrio spp. counts within the 12 h incubation was measured as Vibrio spp. growth rate (µ) (Beardsley et al.2003). Although we did not identify the cfus here, TCBS was shown to be highly specific for Vibrio spp. (up to 97%). We therefore presumed the resulting growth to represent that of Vibrio spp. A concurrent microcosm was set up using an unfiltered water sample, and the difference in Vibrio spp. growth rates between this and diluted samples was estimated as grazing loss rate. These experiments were carried out in triplicate.
Identification of Vibrio spp.
Presumptive Vibrio spp. isolates were screened using Polymerase Chain Reaction - Restriction Fragment Length Polymorphism (PCR‒RFLP) before identification via DNA sequencing (Urakawa, Kita‒Tsukamoto and Ohwada 1997). Presumptive Vibrio spp. were re‒streaked at least three times using Tryptic Soy Agar (TSA) (BD Difco, USA) with 2% NaCl final concentration. A single colony was picked and dispensed into 100 μL of sterile ultrapure water before heating at 94°C for 10 min. The mixture was then cooled immediately at ‒20°C for 10 min, and used as PCR template. Universal primers, 27F (5′‒AGA GTT TGA TCA TGG CTC AG‒3′) and 1492R (5′‒CGG TTA CCT TGT TAC GAC TT‒3′) were used to amplify the 16S rRNA of presumptive Vibrio spp. (Weisburg et al.1991; Urakawa, Kita‒Tsukamoto and Ohwada 1997). PCR was carried out in a 20 µL reaction with 0.4 µM of primers, 1 × MgCl2-free buffer, 1.5 mM MgCl2, 0.25 mM dNTPs, and 0.03 U µl−1 i-Taq DNA polymerase (iNtRON Biotechnology Inc., Austria). The conditions for amplification were as follows: initial denaturation at 94°C for 2 min, followed by 25 cycles of 2 min denaturation at 94°C, 1.5 min of annealing at 45°C, 2 min of extension at 72°C before final extension at 72°C for 3 min (Urakawa, Kita‒Tsukamoto and Ohwada 1997). The presence of a 1.5 kb amplicon was then checked along a 1 kb DNA ladder (New England Biolabs, USA) using 1% agarose gel electrophoresis (85 V for 40 min). For RFLP, targeted amplicons were digested with each of the following restriction enzymes separately: RsaI, DdeI, Sau3A1 and CfoI (Roche, Switzerland). RFLP patterns were screened with a 2-log DNA ladder (New England Biolabs, USA) on 2% agarose gel electrophoresis (80 V for 45 min). Isolates with similar RFLP digestion patterns were grouped and a representative was sent for DNA sequencing. DNA sequences obtained were checked and trimmed where necessary using Sequence Scanner Software v2.0 (Applied Biosystems, Foster City, CA, USA) and BioEdit software (Hall 1999). Trimmed DNA sequences were then compared against the NCBI GenBank using the Basic Local Alignment Search Tool (BLASTn) (Altschul et al.1990) and Ribosomal Database Project (RDP-II release 11) (Cole et al.2013). Identities of presumptive Vibrio spp. were matched to published sequences in GenBank with ≥97% similarity and RDP S_ab score >0.900 (Holben et al.2002). All the 16S rRNA sequences obtained were deposited in GenBank under the accession numbers MK968155–MK968181.
Co-culture experiment
We hypothesized that Vibrio spp. growth rates determine their community structure. Therefore we selected six Vibrio spp. that were isolated at varying frequencies, and measured their growth rates. Each of the selected isolates was adjusted to 103 cfu mL−1 using McFarland 0.5 standard before culturing in 200 mL Marine Broth 2216 (BD Difco, USA) at 30.0 ± 0.2°C. Each batch culture was incubated with shaking at 150 rpm for 24 h, and its absorbance at 600 nm wavelength was measured every 4 h. The linear increase in absorbance against time was calculated as Vibrio spp. growth rate.
We then carried out a semi-continuous co-culture experiment pairing two different Vibrio spp. (i.e. fast growing and slow growing). CHROMagar™ Vibrio (CHROMagar, USA) was used as it was able to differentiate the co-cultured Vibrio spp. via chromogenic differences between cfus. Inocula were standardized using McFarland 0.5 before culturing in 200 mL Marine Broth 2216 (BD Difco, USA). The co-culture was incubated with shaking at 150 rpm at 30.0 ± 0.2°C. We transferred 1% of the culture into fresh Marine Broth 2216 at the end of every day for 7 days. Counts of Vibrio spp. at the start, before and after each culture transfer (about every 24 h) were estimated via spread plating. The co-culture experiment was also carried out using half-strength and 1/10-strength Marine Broth 2216 concurrently. The salinity in the half-strength and 1/10-strength Marine Broth 2216 was maintained by the addition of NaCl. The predominance of a Vibrio sp. was determined when counts from the last five overnight cultures (72nd, 96th, 120th, 144th and 168th h) showed significant differences by Student's t‒test (after log-transformation). Co-culture experiments were carried out in triplicate.
Statistical analysis
Student's t-test, correlation analyses and linear regression were carried out according to Zar (1999) using Microsoft Excel (MS Office 2013, USA). All bacterial counts were log-transformed before statistical analyses. Diversity of Vibrio spp. communities was determined using Shannon's index whereas analysis of covariance (ANCOVA) was used for multiple comparisons of slopes and one‒way analysis of similarity (ANOSIM) was used to compare the composition of Vibrio spp. communities. ANCOVA and ANOSIM were carried out with the statistical software PAST version 2.17 (Hammer, Harper and Ryan 2001).
RESULTS
Environmental parameters
Seawater temperature at Port Klang and Port Dickson were not different (P > 0.05), ranging from 25.4 to 32.5°C and from 25.3 to 33.0°C, respectively (Table 1). TSS and POM were also not different between the two stations. In contrast, salinity, pH and DOCs were lower at Port Klang whereas inorganic nutrients (NH4, NO2, NO3 and PO4) concentrations were higher at Port Klang. For dissolved organic nutrients, DOC was similar between both stations but DON was higher at Port Klang. For biological variables, Chl a concentration, which was used as a proxy for phototrophic biomass, was higher at Port Klang (1.15 to 50.53 µg L−1) than Port Dickson (0.18 to 9.70 µg L−1) (Student's t = 2.15, degree of freedom, df = 30, P < 0.05). Similarly, total bacterial count was also higher at Port Klang (0.6 × 10⁶–6.0 × 10⁶ cells mL−1) than Port Dickson (0.3 × 10⁶–1.2 × 10⁶ cells mL−1) (t = 5.04, df = 38, P < 0.001) (Fig. 2).
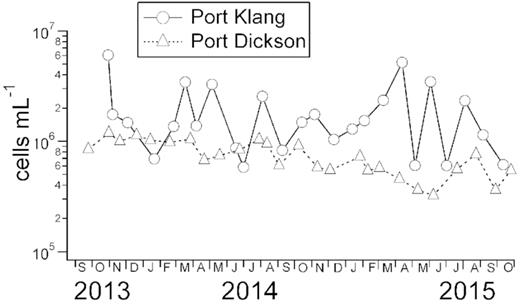
Total bacterial counts (cells mL−1) measured at Port Klang and Port Dickson from October 2013 to October 2015.
Mean (±Standard Deviation, S.D.) of environmental variables measured at Port Klang and Port Dickson. Comparison of measurements between Port Klang and Port Dickson were carried out using Student's t-test. *, **, *** indicate significant P-values of < 0.05, < 0.01 and < 0.001, respectively.
| Port Klang | Port Dickson | |
|---|---|---|
| Temperature (°C) | 29.2 ± 2.5 | 29.3 ± 1.5 |
| Salinity (ppt)** | 24.0 ± 8.4 | 30.3 ± 4.1 |
| Dissolved oxygen (µM)*** | 130 ± 70 | 210 ± 50 |
| Total suspended solid (mg L−1) | 113 ± 48 | 107 ± 24 |
| Particulate organic matter (mg L−1) | 33 ± 16 | 29 ± 8 |
| NH4 (µM)** | 34.80 ± 52.08 | 1.81 ± 2.20 |
| NO2 (µM)*** | 2.78 ± 2.56 | 0.13 ± 0.13 |
| NO3 (µM)*** | 3.71 ± 2.97 | 0.63 ± 0.49 |
| PO4 (µM)*** | 2.25 ± 2.01 | 0.25 ± 0.20 |
| SiO4 (µM)*** | 25.59 ± 21.35 | 5.65 ± 2.64 |
| Dissolved organic carbon (µM) | 645 ± 1030 | 361 ± 487 |
| Dissolved organic nitrogen (µM)* | 22.36 ± 25.85 | 6.66 ± 2.78 |
Vibrio spp. dynamics and diversity
At Port Klang, Vibrio spp. fluctuated over a wide range, from 15 to 2395 cfu mL−1 (Fig. 3). In contrast, Vibrio spp. abundance at Port Dickson varied over a smaller range (20 to 655 cfu mL−1), and was not different from that at Port Klang (P > 0.95). On six occasions, Vibrio spp. growth and grazing loss rates were also measured. Growth rates varied between 0.07 and 0.38 h−1 at Port Klang and between 0.26 and 0.36 h−1 at Port Dickson whereas grazing loss rates were 0.03–0.14 h−1 and 0.09–0.18 h−1 at Port Klang and Port Dickson, respectively (Fig. 4).
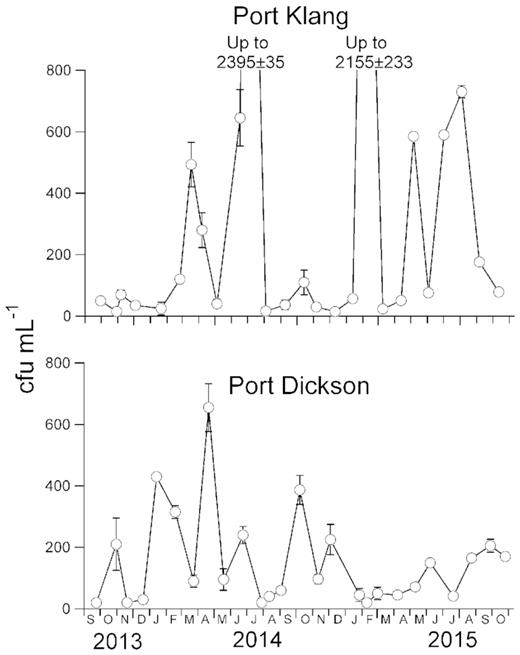
Vibrio spp. abundance (cfu mL−1) estimated at Port Klang and Port Dickson from September 2013 to October 2015. Error bars represent the standard deviation and are shown except when smaller than symbol.
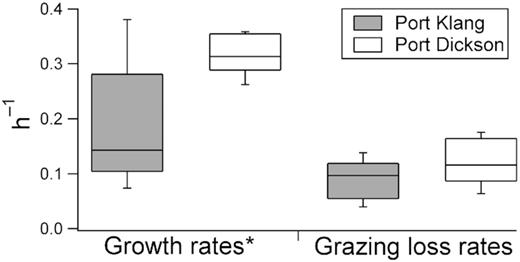
Vibrio spp. growth and grazing loss rates measured at Port Klang and Port Dickson from May 2015 to October 2015 (n = 6). * indicates significant difference at P < 0.05 between the growth rates measured in Port Klang and Port Dickson.
A total of 460 presumptive Vibrio spp. were isolated, of which 240 isolates were from Port Klang, and 220 isolates from Port Dickson (Table 2). Most isolates were confirmed as Vibrio spp. via 16S rRNA sequence but 2.8% (13 isolates) were identified as Photobacterium spp. A total of 27 Vibrio spp. were identified, of which 19 species were found at Port Klang and 22 species were found at Port Dickson. The most frequently isolated Vibrio sp. at both stations was V. owensii, which occurred at a frequency of 34.4 ± 23.0% at Port Klang and 24.5 ± 9.3% at Port Dickson. Other Vibrio spp. that were isolated in high frequency were V. rotiferianus, V. harveyi and V. natriegens. Five species (V. fluvialis, V. furnissii, V. hangzhouensis, V. ponticus, V. vulnificus) were detected only at Port Klang whereas eight species (V. agarivorans, V. aestivus, V. breoganii, V. diabolicus, V. diazotrophicus, V. fortis, V. tubiashii and V. xuii) were isolated only at Port Dickson. Using Shannon's diversity index, theVibrio spp. community at Port Dickson (H′ = 1.94 ± 0.21) was more diverse than Port Klang (H′ = 1.56 ± 0.29) (t = 1.79, df = 11, P < 0.05).
List of Vibrio spp. identified from Port Klang and Port Dickson.
| Species (Accession number) | Port Klang (n = 235) | Port Dickson (n = 212) |
|---|---|---|
| Vibrio agarivorans (MK968155) | ‒ | 8 |
| Vibrio aestivus (MK968156) | ‒ | 1 |
| Vibrio alginolyticus (MK968157) | 8 | 10 |
| Vibrio azureus (MK9681558) | 1 | 1 |
| Vibrio brasiliensis (MK968159) | 3 | 7 |
| Vibrio breoganii (MK968160) | ‒ | 5 |
| Vibrio campbellii (MK968161) | 1 | 1 |
| Vibrio diabolicus (MK968162) | ‒ | 2 |
| Vibrio diazotrophicus (MK968163) | ‒ | 1 |
| Vibrio fluvialis (MK968164) | 1 | ‒ |
| Vibrio fortis (MK968165) | ‒ | 1 |
| Vibrio furnissii (MK968166) | 2 | ‒ |
| Vibrio hangzhouensis (MK968167) | 2 | ‒ |
| Vibrio harveyi (MK968168) | 33 | 23 |
| Vibrio hepatarius (MK968169) | 1 | 6 |
| Vibrio jasicida (MK968170) | 1 | 6 |
| Vibrio mediterranei (MK968171) | 11 | 8 |
| Vibrio natriegens (MK968172) | 29 | 12 |
| Vibrio neptunius (MK968173) | 4 | 5 |
| Vibrio nigripulchritudo (MK968174) | 2 | 4 |
| Vibrio owensii (MK968175) | 71 | 56 |
| Vibrio ponticus (MK968176) | 1 | ‒ |
| Vibrio rotiferianus (MK968177) | 52 | 49 |
| Vibrio sinaloensis (MK968178) | 1 | 2 |
| Vibrio tubiashii (MK968179) | ‒ | 1 |
| Vibrio vulnificus (MK968180) | 11 | ‒ |
| Vibrio xuii (MK968181) | ‒ | 3 |
Vibrio spp. co-culture
We measured the growth rates of two frequently isolated Vibrio spp. (V. owensii and V. rotiferianus) and four Vibrio spp. that were isolated at lower frequency (V. fluvialis, V. furnissii, V. harveyi and V. aestivus). We observed that the growth rates of V. owensii (0.079 ± 0.004 h−1) and V. rotiferianus (0.076 ± 0.004 h−1) were higher than V. fluvialis (0.066 ± 0.003 h−1), V. furnissii (0.061 ± 0.005 h−1), V. harveyi (0.066 ± 0.003 h−1) and V. aestivus (0.061 ± 0.006 h−1) (ANCOVA: F > 4.338, P < 0.05) (Table 3). We then paired V. owensii with V. fluvialis and V. rotiferianus with V. furnissii in separate co-culture experiments. On CHROMagar™ Vibrio, V. owensii and V. rotiferianus formed turquoise blue-ish colonies whereas V. fluvialis and V. furnissii formed mauve colonies.
Growth rates (µ) of selected Vibrio spp. as measured by absorbance. Linear regression analyses of all growth rates were significant, with P < 0.01.
| Isolate | Growth rate (h−1) | R2 |
|---|---|---|
| V. aestivus (MK968156) | 0.061 ± 0.005 | 0.890 |
| V. fluvialis (MK968164) | 0.066 ± 0.003 | 0.967 |
| V. furnissii (MK968166) | 0.061 ± 0.005 | 0.918 |
| V. harveyi (MK968168) | 0.066 ± 0.003 | 0.967 |
| V. owensii (MK968175) | 0.079 ± 0.004 | 0.958 |
| V. parahaemolyticus (obtained from You et al.2016) | 0.038 ± 0.003 | 0.931 |
| V. rotiferianus (MK968177) | 0.076 ± 0.004 | 0.966 |
| V. vulnificus (MK968180) | 0.020 ± 0.002 | 0.819 |
In the V. owensii–V. fluvialis co-culture, the initial concentrations of V. owensii and V. fluvialis were about 26–70 cfu mL−1 and 23–110 cfu mL−1, respectively. At termination, V. owensii increased to about 2.3 × 10⁷–13.4 × 10⁷ cfu mL−1 whereas V. fluvialis increased to 4.2 × 10⁷–22.0 × 10⁷ cfu mL−1 (Fig. 5). In single-strength marine broth, V. owensii predominated after 3 days, and remained about one order of magnitude higher than V. fluvialis until termination (t = 3.51, df = 7, P < 0.01). In half-strength marine broth, V. owensii was not significantly higher than V. fluvialis, and did not predominate even after 5 days of incubation. However in 1/10-strength marine broth, V. fluvialis predominated after the third day of incubation, and overwhelmed V. owensii by nearly an order of magnitude (t = 3.13, df = 5, P < 0.05).
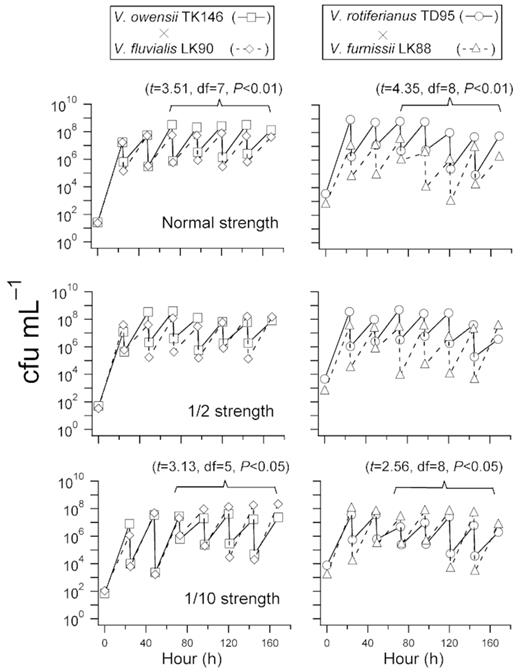
Changes in colony forming units obtained from two sets of co-cultures: V. owensii (fast growing) × V. fluvialis (slow growing), and V. rotiferianus (fast growing) × V. furnissii (slow growing). The experiment was observed over 7 days (168 hours).
For V. rotiferianus−V. furnissii co-culture, similar growth patterns were observed. In single-strength marine broth, V. rotiferianus abundance was constantly one to two orders of magnitude higher than that of V. furnissii (t = 4.35, df = 8, P < 0.01). In half-strength marine broth, V. rotiferianus remained predominant until the 144th and 168th h when V. furnissii outgrew V. rotiferianus. When the co-culture was carried out in 1/10-strength marine broth, V. furnissii abundance was consistently one order of magnitude higher than that ofV. rotiferianus (t = 2.56, df = 8, P < 0.05).
DISCUSSION
Environmental parameters
The higher concentration of dissolved inorganic nutrients and DON at Port Klang reflected its eutrophic state relative to the oligotrophic coastal water of Port Dickson (Lee and Bong 2008; Vijayan and Lee 2014; Lee et al.2015). TSS and POM levels were not different between both stations, and TSS was within the range of earlier reports (Lim et al.2019). However POM increased from <14% in 2008 (Lee, Lim and Heng 2013) to >27% in this study. This may be due to increasing eutrophication at both these stations (Lim et al.2018) that resulted in a higher biogenic component in TSS. Both Chl a concentration and total bacteria counts were higher at Port Klang relative to Port Dickson, and these organisms were probably supported by the higher level of nutrients available at Port Klang. There were also sporadic peaks in Chl a concentration that were attributed to higher nutrient concentrations brought by surface run-off during rain (Lim and Lee 2017).
Possible drivers of Vibrio spp. dynamics
In this study, Vibrio spp. abundance made up <1% of the total bacterial counts (Eilers et al.2000; Thompson et al.2004b). Vibrio spp. abundance measured was also within the range previously reported at both stations (Vijayan and Lee 2014; You, Bong and Lee 2016) and at other locations (Turner et al.2009; Asplund et al.2011; Froelich et al.2013). At both Port Klang and Port Dickson, Vibrio spp. abundance was generally higher from December to March, and this increase was in conjunction with the wetter North‒East monsoon. Heavier rainfall may have introduced more nutrients that favour primary productivity and subsequently the growth of heterotrophic bacteria, including Vibrio spp. (Lee and Bong 2008; Lee et al.2009b; Betty et al.2013; Vijayan and Lee 2014). Although the presence of viable but non-culturable (VBNC) Vibrio spp. may underestimate Vibrio spp. abundance in this study, studies have shown that Vibrio spp. usually enter the VBNC state when water temperatures are low (<15°C) (Oliver et al.1995; Ravel et al.1995; Ramaiah et al.2002). As the water temperatures here were constantly high (approximately 30°C), the effect of VBNC on our Vibrio spp. counts was presumed to be negligible.
Vibrio spp. abundance at Port Klang and Port Dickson correlated with different environmental variables. Vibrio spp. abundance correlated with salinity at Port Klang (P = 0.05, r2 = 0.150, df = 25) but not at Port Dickson (Fig. 6). At Port Klang, salinity fluctuated over a wide range (Coefficient of Variation, CV = 35%), and Vibrio spp. abundance increased as salinity increased. Salinity is an important environmental driver as Vibrio spp. are halophiles (Thompson, Iida and Swings 2004a; Turner et al.2009). However at Port Dickson, the lack of correlation between Vibrio spp. abundance and salinity could be due to the relatively stable salinity (>20 ppt, CV = 13%). The influence of salinity on Vibrio spp. is known to differ among studies, and is dependent on its range (Hsieh, Fries and Noble 2007).
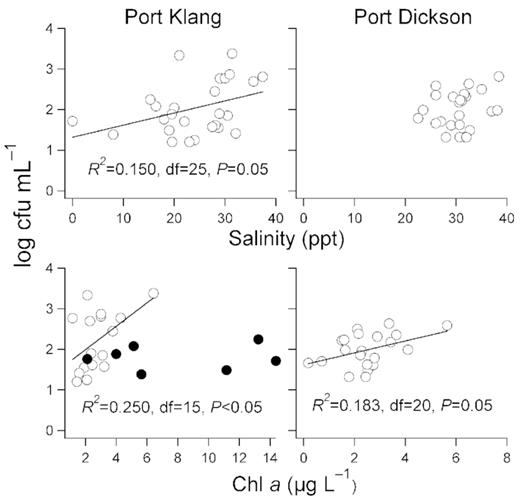
Correlation analyses between (top panels) Vibrio spp. abundance (log cfu mL−1) and salinity (ppt), (bottom panels) Vibrio spp. abundance (log cfu mL−1) and Chl a (µg L−1) at Port Klang and Port Dickson. Linear regression slopes are shown when significant. For the bottom left panel, data from Port Klang when salinity is <20 ppt are represented as filled symbols and were not included in the correlation analysis.
At Port Dickson, Vibrio spp. abundance correlated with Chl a concentration (P = 0.05, r2 = 0.183, df = 20). Our observation concurred with Turner et al. (2009) where Vibrio spp. vary in relative abundance to phytoplankton. This may also be a reflection of the bacteria–phytoplankton coupling (Cole, Findlay and Pace 1988; Lee and Bong 2008). However at Port Klang, Vibrio spp. abundance did not correlate with Chl a concentration (P > 0.20). Vibrio spp. are known to associate with phytoplankton but only in habitats where salinity is rather constant (Hsieh, Fries and Noble 2008; Asplund et al.2011; Oberbeckmann et al.2012).
As the wide range of salinity at Port Klang might conceal the relationship between Vibrio spp. abundance and Chl a concentration, we reanalysed using data when salinity was >20 ppt, and found that Vibrio spp. abundance correlated significantly with Chl a concentration (Fig. 6; P < 0.05, r² = 0.250, df = 15). Comparative analysis of both stations revealed that Chl a concentration was an important environmental driver for Vibrio spp. abundance but only when salinity was >20 ppt. In waters where salinity fell below 20 ppt (for example in estuaries), salinity becomes an important factor for Vibrio spp. abundance.
In this study, Vibrio spp. abundance at both Port Klang and Port Dickson were not different (P > 0.95). As Vibrio spp. abundance or distribution is determined mainly by the balance between growth and grazing-mortality (Worden et al.2006; Eiler et al.2007), we measured both growth and grazing loss rates. Vibrio spp. growth rates were higher at Port Dickson (t = 2.75, df = 6, P < 0.05) but grazing loss rates were not different between both stations. Vibrio spp. grow better in higher salinity and cleaner waters (Hsieh, Fries and Noble 2008), and this fact could explain the higher Vibrio spp. growth rates at Port Dickson. The balance between growth and grazing loss rates suggested higher Vibrio spp. abundance at Port Dickson relative to Port Klang. However this pattern was not observed, unlike in previous studies that reported higher Vibrio spp. abundance at Port Dickson (Vijayan and Lee 2014; You, Bong and Lee 2016). Further studies are required to resolve this discrepancy as other loss factors (viral lysis, sinking or horizontal export) could have affected our results.
Vibriospp. diversity
About 97% of the presumptive Vibrio spp. isolated were confirmed via 16S rRNA sequencing, reaffirming the specificity of TCBS medium as a selective isolation medium for Vibrio spp. (Pfeffer and Oliver 2003; Turner et al.2009). Vibrio spp. diversity at Port Dickson was higher than at Port Klang, and our observation concurred with Vijayan and Lee (2014). The higher average salinity and oligotrophic waters at Port Dickson may have provided better conditions for growth and development of more Vibrio spp. (Ortiz‒Carrillo et al.2015). A total of 27 Vibrio spp. were identified, and these included the majority of Vibrio spp. previously reported (Vijayan and Lee 2014; You, Bong and Lee 2016). The species richness in this study was also consistent with other culture-dependent approaches using TCBS, and comparable to the number of Vibrio-related operational taxonomic units (OTUs) obtained from next-generation sequencing approaches (Tall et al.2013; Ortiz‒Carrillo et al.2015; Amin et al.2016; Siboni et al.2016).
ANOSIM showed that the Vibrio spp. community composition in Port Dickson was not different from Port Klang, and the two most frequently occurring species at both stations were V. owensii and V. rotiferianus. The predominance of a specific Vibrio sp. seems to be site-specific as others have reported different predominant Vibrio species in their studies (e.g. V. parahaemolyticus, V. alginolyticus, V. anguillarum, V. campbellii, V. carchariae, V. harveyi, V. splendidus and V. lentus) (Maeda et al.2003; Eiler, Johansson and Bertilsson 2006; Ortiz‒Carrillo et al.2015).
Vibrio spp. co-culture
From the growth rates of selected Vibrio spp., we showed that the predominant Vibrio spp. (V. owensii and V. rotiferianus) grew faster than four Vibrio spp. that were isolated at lower frequency (V. fluvialis, V. furnissii, V. harveyi and V. aestivus). Our results suggested that the frequency of occurrence of a Vibrio sp. might be related to its individual growth rate. However these growth rates were measured by culturing in relatively nutritious media using a pure-culture approach. The in situ response of Vibrio spp. may be different with competition and varying nutrient conditions. Therefore, we investigated this further using co-culture experiments by growing Vibrio spp. of different growth rates in different nutrient conditions.
Predominance of V. owensii and V. rotiferianus, and their higher growth rates over the other Vibrio spp. that were tested, probably reflected the intrinsic nature of r- and K-strategies. r-Selected organisms adopt their highest proliferation rate when resources are rich whereas K‒selected organisms are able to survive when resources are scarce (Fierer, Bradford and Jackson 2007). r-Adapted microorganisms, also known as copiotrophs, have high nutritional requirements and prefer labile substrates, whereas the oligotrophs (K-strategists) are able to outcompete copiotrophs in low nutrient availability due to their higher substrate affinities (Fierer, Bradford and Jackson 2007).
Laboratory cultivation may not exactly reflect bacterial growth in nature but may reveal part of the growth conditions experienced by microorganisms in the environment (Mattia, Grego and Cacciari 2002). Our observations from the co-culture experiments suggested that Vibrio spp. community composition is structured by a combination of individual growth advantages and resource availability in the environment (Fierer, Bradford and Jackson 2007; Hibbing et al. 2010; Roller and Schmidt 2015). Eiler et al. (2007) also proved similar selection by nutrient availability. Therefore, nutrient conditions at both Port Klang and Port Dickson probably favoured the predominance of r-selected V. rotiferianus and V. owensii. Protozoan predation also influences bacterial community composition (Hahn and Höfle 2001). Although not investigated here, the different survival strategies of V. cholerae (Erken et al.2011) and V. fischeri (Chavez-Doval et al.2013) under protozoan grazing pressure suggest that Vibrio community composition may also be affected by protozoan grazing.
In this study, pathogenic Vibrio spp. were rarely isolated. V. vulnificus was isolated once whereas V. parahaemolyticus was not isolated. When we measured the growth rates of V. vulnificus and V. parahaemolyticus [isolates obtained from You, Bong and Lee (2016)], their growth rates (±S.E.) were 0.020 ± 0.002 h−1 (R2 = 0.819, P < 0.001) and 0.038 ± 0.003 h−1 (R2 = 0.931, P < 0.001), respectively. Their growth rates were clearly lower than the growth rates of other Vibrio spp. measured in this study (0.061–0.079 h−1), and this difference suggested that their scarcity might be due to their low growth rates. As the nutrient conditions at both Port Klang and Port Dickson favoured predominance of r-selected Vibrio spp., V. vulnificus and V. parahaemolyticus with low growth rates might be unable to sustain or prevail in these waters. We showed how nutrient conditions and individual growth characteristics can influence the Vibrio spp. community structure, including pathogenic Vibrio spp.
ACKNOWLEDGEMENTS
We are grateful to Yvainne Thiang, Kyle Young and Stanley Chai for their help during sampling. We also thank two anonymous reviewers for their constructive comments that have helped to improve this paper.
FUNDING
This work was largely funded by the University of Malaya (PG279‒2016A and UM.C/625/1/HIR/050), and Institution Centre of Excellence (HiCOE) Phase II Fund, Ministry of Higher Education (IOES-2014D) through the grants that supported this work.
Conflict of interest. None declared.
