


Abstract
All cockroach species, except one, harbor the endosymbiont Blattabacterium, transmitted from females to embryos. Adult cockroaches acquire non-Blattabacterium bacteria as part of their gut microbiota over time, but our knowledge of the possible transmission of these non-Blattabacterium bacteria from females to embryos is rudimentary. We characterized the gut microbiota of gravid viviparous Diploptera punctata females and the non-Blattabacterium microbiota of associated developing embryos, as well as the gut microbiota of non-gravid females, and the microbiota of orphan embryos (females not included), following high-throughput sequencing of the 16S rRNA gene to assess bacterial transference. We determined significant differences in community composition between gravid females and associated embryos and overall greater similarity in community composition among embryos than adult females. Results suggest various routes of transference of bacteria from females or the environment to embryos. The bacterial families Halomonadaceae and Shewanellaceae were more abundant in embryos than in gravid females. The functional relevance of these families remains to be elucidated, but provisioning of amino acids deficient in the brood sac secretion is a possibility. Overall, our results highlight the need for further studies investigating the uptake and selective screening of microbes by D. punctata embryos, as well as their functions.
INTRODUCTION
Cockroaches and their sister taxa termites (Superorder Dictyoptera) (Inward, Beccaloni and Eggleton 2007) are some of the most-studied insect–gut microbe model systems yielding seminal data regarding host-supportive roles for gut microbes (Potrikus and Breznak 1980; Cruden and Markovetz 1987; Kane and Breznak 1991; Ayayee, Jones and Sabree 2015). All cockroach species studied to date, except Nocticola sp. (Lo et al.2007), harbor the obligate bacterial endosymbiont, Blattabacterium sp., which provides essential amino acids to the host, and is capable of recycling stored nitrogenous products for amino acid biosynthesis (Sabree, Kambhampati and Moran 2009; Tokuda et al.2013).
Cockroaches also vary in reproductive strategies. Most cockroaches are oviparous, laying oothecae (egg cases, containing developing embryos), and some are ovoviviparous (egg cases retained within the body cavity) (Bell, Roth and Nalepa 2007; Mullins 2015). Only Diploptera punctata, a tropical omnivorous cockroach found in ground litter or burrowing under rocks and logs, is currently known to be truly viviparous (Bell, Roth and Nalepa 2007; Mullins 2015). Diploptera punctata embryos develop within the body cavity of females in the brood sac, an invagination of the ventral intersegmental membrane which provides nutritive secretions (milk) to the developing embryos (Williford, Stay and Bhattacharya 2004). The main components of this milk are hydrosoluble proteins, rich in many essential amino acids, particularly leucine, valine and lysine, but deficient in methionine and tryptophan (Williford, Stay and Bhattacharya 2004). Methionine and tryptophan are presumably acquired from the vertically transmitted Blattabacterium present in the fat body of developing embryos (Sabree, Kambhampati and Moran 2009), or possibly from gut microbiota.
Little is known about the composition of the gut-associated microbiota of D. punctata adults, and the composition of the microbiota associated with developing embryos. The first characterization of the gut-associated microbiota of adult D. punctata in the context of the evolutionary origins of termite gut microbiota was only recently publicized (Dietrich, Köhler and Brune 2014). However, important aspects of the gut microbial ecology of D. punctata, such as differences between male and female gut-associated microbiota, gravid and non-gravid females gut microbiota, and gravid females and embryo-associated microbiota, remain to be investigated.
In this study, we characterized for the first time the microbiota associated with developing embryos of D. punctata and the gut microbiota of associated laboratory-reared females. This was in an attempt to determine if non-Blattabacterium bacteria were transferred from the females to embryos during development period in the brood sac, based on the viviparous mode of reproduction of this species. We used both gravid females and their associated developing embryos, as well as non-gravid females and orphan developing embryos (i.e. associated females were not included in the study).
MATERIALS AND METHODS
Insect rearing, DNA extraction and library preparation
Diploptera punctata used in this study was maintained in an insectary in The Ohio State University's Department of Evolution, Ecology and Organismal Biology in closed containers at ∼22°C ± 2°C. Cockroaches were fed a diet of Red Flannel Hi-Protein Formula dog food (PMI Nutrition, St. Louis, MO, USA), as well as periodically supplemented with pieces of apple, cantaloupe or banana. The reproductive state of females (pregnant or not) was assessed based on the size of the abdomen. Five gravid females were selected and immobilized or slowed down by cooling at 4 °C for 5 min. Wings and appendages of females were removed, and the body surface-sterilized by rinsing once in 70% ethanol and 10% bleach solution for 30 s, and twice in Milli-Q water for 30 s. Upon dissection, intact clusters of associated developing embryos (usually 10–12 per cluster) were removed without rupturing the digestive tract of the female and rinsed once in 1× phosphate buffered saline (PBS, pH = 7.4, 0.1M) and placed into 1.5 ml tubes for DNA extraction. Contamination of embryo samples by bacteria from female guts during dissection was avoided since the location and structure of the brood sac enabled the sterile removal of embryos without injury to the digestive tract. The entire digestive tracts of the five females were also removed and placed in 1.5 ml tubes. Additionally, the entire digestive tract of three non-gravid females from the same colony and three orphan embryo samples obtained from females from the same colony but not included in this study were also processed for DNA extraction.
Genomic DNA was extracted using the Qiagen DNeasy Blood and Tissue kit (Hilden, Germany), according to the manufacturer's protocol, following homogenization of female alimentary tracts and embryo samples using sterile Bio Plas plastic pestles (BioPlas Inc, San Rafael, CA, USA) in 1× PBS. Overall, eight embryonic and eight female gut DNA samples were obtained. Samples were submitted for sequencing following the verification of the presence of partial bacterial 16S rRNA gene in all samples. The V4–V5 hypervariable region of the 16S rDNA was amplified using region-specific primers (515F and 806R) (Sun et al.2013), and subjected to paired-end sequencing on an Illumina MiSeq instrument (v2 chemistry, Illumina) at the OSU Molecular and Cellular Imaging Center.
Sequence data processing
Paired forward and reverse reads were assembled into single contigs or ‘iTags’(total of 1797 190) (Degnan and Ochman 2011) and those with one or more errors in the primer or barcode regions were eliminated. Thereafter, iTags were sorted by length, excluding reads that were too short (∼35 and 49 bp), or too long (∼598 bp), retaining only reads that in the 318–324 range (79.4% of 1796 190) using the usearch ‘sort_by_length’ command (Version 7) (Edgar 2010). Chimeric reads were subsequently removed from the remaining 1427 156 iTags using the usearch chimera filtering commands implemented in QIIME (Caporaso et al.2010). The remaining 99.5% of the iTags (1420 230) were then clustered based on ≥97% similarity to reference partial bacterial 16S rRNA sequences in the 16S rRNA SSU_Ref_NR_99_123.1 reference database (SILVA_SSU_123.1, Release date, March 2016) (Quast et al.2012) into operational taxonomic units (OTUs), and taxonomy assigned to representative OTUs following clustering using the pick_open_reference_OTUs.py workflow with usearch61_ref and usearch61 as the OTU picking methods in QIIME (Version. 1.9.1). Singletons and OTUs assigned to Archaea and Blattabacteriaceae were removed from the resulting OTU table by passing the command filter_otus_from_otu_table.py and filter_taxa_from_otu_table.py commands respectively in QIIME (Version. 1.9.1). Overall, Blattabacteriaceae-assigned reads made up 58.5% (438 526) of the original 749 951 reads in the OTU table. Unassigned OTUs were extracted from the dataset and matches/hit determined against the NCBI reference microbial 16S rRNA database with a 90% cut-off threshold. The resulting taxonomic information was subsequently appended to the original OTU table for downstream analyses.
Analyses of community structure
Significant differences in OTU abundances among female and embryo samples were examined in QIIME using the group_significance.py command and the default non-parametric Kruskal-Wallis analysis of variance (ANOVA) in QIIME. The family-level OTU table was then rarefied to 2030 iTags per sample using the multiple_rarefactions.py command in QIIME. Chao1 species richness estimates (Chao 1984) were calculated for analysis of within-sample diversity, followed by a non-parametric test of significance among individual samples and between female and embryo groups in JMP 10 (SAS Inc. Cary, NC, USA). For analysis of between-sample diversity, a Bray-Curtis dissimilarity distance matrix was generated using the rarefied family-level table (Bray and Curtis 1957). The degree of similarity or dissimilarity among female and embryo-associated microbiota was assessed using the Multivariate response permutation procedure (MRPP) (Mielke 1984) on the Bray-Curtis distance matrix via the ‘compare_categories.py’ command in QIIME with 1000 permutations (QIIME Version. 1.9.1). A non-metric multidimensional scaling (NMDS) (Kruskal 1964) plot was then generated using the distance matrix to infer pairwise relatedness of female and embryo samples. In this plot, the proximity of samples indicates similarity of microbial community composition.
RESULTS
Composition of female gut-associated and embryo-associated microbiota
After filtering out plant plastids and Archaea, a total of 287 964 iTags were classified into 157 OTUs and summarized into 9 phyla, 16 classes, 23 orders, 42 families and 59 genera. Results and conclusions from data analyses did not differ between family or genus level. However, the family level was chosen for analyses because it provided the highest taxonomic resolution with this dataset; 136 out of 157 OTUs (86.8%) had confirmed family identities, whereas only 70 OTUs (44.6%) had confirmed genus identities at the required cut-off levels. Reads are deposited with the NCBI Short Read Archive (PRJNA314839, accession numbers SRR3216406- SRR3216434).
Several bacterial families were shared among gravid and non-gravid females, as well as between embryos and orphan embryos (Fig. 1; see Table S1, Supporting Information, for actual abundance data for each sample). Within-sample variability was observed in terms of type and abundance of bacterial families detected in female and embryo samples (Fig. 1), with 28 bacterial families differing significantly between females and embryos (Table 1). Of these, only Halomonadaceae (Test-statistic = 6.35, P < 0.01) and Shewanellaceae (Test-statistic = 6.35, P < 0.01) were significantly more abundant in embryos than in females (Table 1).
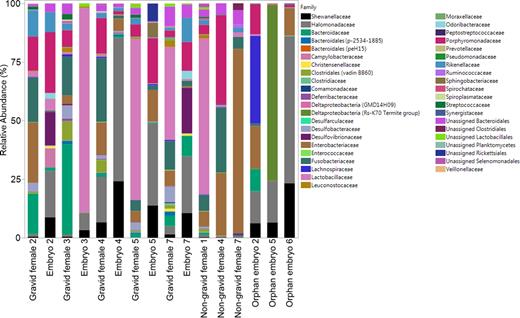
Relative abundance (%) of the 42 bacterial families detected in female and embryo D. punctata samples. Gravid females (n = 5) and their corresponding developing embryos (n = 5) are grouped to the left. Non-gravid female (n = 3) and orphan embryo (n = 3) samples are grouped to the right.
Relative abundances (%) of the 42 bacterial families averaged across female (n = 8) and embryo (n = 8) D. punctata.
| Family | Relative abundance ± S.E. (Females) | Relative abundance ± S.E. (Embryos) | Test-Statistic | P-value |
|---|---|---|---|---|
| Bacteroidaceae | 7.92 ± 4.8 | 2.6 ± 1.43 | 2.17 | 0.14 |
| Bacteroidales (p-2534-18B5) | 0.61 ± .24 | 0.11 ± .09 | 6.36 | 0.01 |
| Bacteroidales (peH15) | 0.02 ± 0.01 | <0.01 ± 0 | 6.54 | 0.01 |
| Campylobacteraceae | <0.01 ± 0 | 1.02 ± 1.02 | 2.13 | 0.14 |
| Christensenellaceae | 0.19 ± 0.14 | 0.23 ± .15 | 2.91 | 0.09 |
| Clostridiaceae | 0.13 ± 1.06 | 0.01 ± .04 | 5.31 | 0.02 |
| Clostridiales (vadin BB60) | 2.24 ± .09 | 0.08 ± .01 | 4.1 | 0.04 |
| Comamonadaceae | 0.14 ± .07 | <0.01 ± 0 | 9.52 | 0.01 |
| Deferribacteraceae | 0.3 ± .12 | 0.04 ± .04 | 6.09 | 0.01 |
| Deltaproteobacteria (GMD14H09) | 0.02 ± .01 | <0.01 ± 0 | 6.54 | 0.01 |
| Deltaproteobacteria (Rs-K70 Termite group) | <0.01 ± 0 | 9.36 ± 9.36 | 1 | 0.32 |
| Desulfarculaceae | 0.02 ± .01 | <0.01 ± 0 | 8.4 | 0.01 |
| Desulfobacteraceae | 2.61 ± .87 | 0.17 ± .08 | 6.4 | 0.01 |
| Desulfovibrionaceae | 0.2 ± .07 | 4.21 ± 2.80 | 1.82 | 0.18 |
| Enterobacteriaceae | 20.81 ± 8.87 | 6.27 ± 2.56 | 8.65 | <0.01 |
| Enterococcaceae | 0.11 ± .03 | 0.01 ± .01 | 6.29 | 0.01 |
| Fusobacteriaceae | 14.98 ± 3.31 | 0.96 ± .32 | 11.31 | <0.01 |
| Halomonadaceae | 3.46 ± 2.31 | 30.19 ± 7.47 | 6.35 | <0.01 |
| Lachnospiraceae | 0.33 ± .09 | 4.76 ± 4.67 | 3.43 | 0.06 |
| Lactobacillaceae | 22.7 ± 10.84 | 11.73 ± 10.68 | 6.89 | 0.01 |
| Leuconostocaceae | 0.94 ± .36 | 0.13 ± .06 | 3.28 | 0.07 |
| Moraxellaceae | 0.31 ± .16 | 0.03 ± .02 | 6.1 | 0.01 |
| Odoribacteraceae | <0.01 ± 0 | 0.73 ± .49 | 0.59 | 0.44 |
| Peptostreptococcaceae | 0.06 ± .05 | 0.01 ± .01 | 1 | 0.32 |
| Porphyromonadaceae | 10.87 ± 4.30 | 9.11 ± 3.52 | 3.57 | 0.06 |
| Prevotellaceae | 0.01 0 | <0.01 ± 0 | 7.1 | 0.01 |
| Pseudomonadaceae | 0.02 .01 | <0.01 ± 0 | 6.79 | 0.01 |
| Rikenellaceae | 2.93 ± 1.21 | 2.56 ± 1.5 | 6.36 | 0.01 |
| Ruminococcaceae | 0.35 ± 1.18 | 0.02 ± .01 | 8.78 | <0.01 |
| Shewanellaceae | 1.18 ± .79 | 12.07 ± 2.77 | 6.35 | 0.01 |
| Sphingobacteriaceae | 0.03 ± .02 | 0.8 ± .80 | 0.8 | 0.37 |
| Spirochataceae | 0.2 ± .09 | 0.01 ± .01 | 6.09 | 0.01 |
| Spiroplasmataceae | 0.17 ± .08 | 0.03 ± .02 | 5.03 | 0.02 |
| Streptococcaceae | 0.76 ± .31 | 0.11 ± .04 | 3.38 | 0.07 |
| Synergistaceae | 0.03 .01 | <0.01 ± 0 | 6.54 | 0.01 |
| Unassigned Bacteroidales | 4.12 ± .81 | 1.42 ±.76 | 10.61 | <0.01 |
| Unassigned Clostridiales | 0.38 ± .36 | <0.01 ± 0 | 8.4 | <0.01 |
| Unassigned Lactobacillales | 0.46 ± .23 | 0.25 ±.17 | 0.2 | 0.65 |
| Unassigned Planktomycetes | 0.01 .01 | <0.01 ± 0 | 6.52 | 0.01 |
| Unassigned Rickettsiales | <0.01 ± 0 | 0.95 ± .05 | 1 | 0.32 |
| Unassigned Selenomonadales | 0.33 ± .20 | 0.02 ± .02 | 5.55 | 0.02 |
| Veillonellaceae | 0.05 ± 002 | <0.01 ± 0 | 4.98 | 0.03 |
Bacterial families that are significantly more abundant in embryos than in females are in bold, and those that are significantly different between embryos and females are italicized.
Bacterial diversity within and between females and developing embryos
Adequate sampling depth was obtained for the majority of female and embryo samples. Rarefaction of the family-level OTU table to 2030 iTags per sample suggests adequate sampling depth of all samples using the observed species and Chao 1 richness estimates (Fig. S1, Supporting Information). There were no significant differences in Chao1 richness estimates among females or embryos (Kruskal-Wallis Chi-Square, χ2 = 15, DF = 15, P = 0.45); however, mean Chao1 richness estimate was significantly higher in female samples than in embryo samples (Kruskal-Wallis Chi-Square, χ2 = 5.4, DF = 1, P = 0.02) (Table 2).
Comparison of different microbial alpha diversity estimates (Chao1 species richness) among gravid (n = 5) and non-gravid D. punctata females (n = 3), as well as embryos from gravid females (n = 5) and orphan embryos (n = 3) following rarefaction to 2030 reads per sample.
| Samples | Chao1 | Groups |
|---|---|---|
| Embryos from gravid female 2 | 18.00 | Embryos |
| Embryos from gravid female 3 | 8.00 | Embryos |
| Embryos from gravid female 4 | 20.50 | Embryos |
| Embryos from gravid female 5 | 24.00 | Embryos |
| Embryos from gravid female 7 | 22.00 | Embryos |
| Orphan embryos 2 | 10.00 | Embryos |
| Orphan embryos 5 | 7.00 | Embryos |
| Orphan embryos 6 | 14.00 | Embryos |
| Gravid female 2 | 32.00 | Females |
| Gravid female 3 | 37.50 | Females |
| Gravid female 4 | 34.00 | Females |
| Gravid female 5 | 34.00 | Females |
| Gravid female 7 | 35.33 | Females |
| Non-gravid female 1 | 31.50 | Females |
| Non-gravid female 4 | 14.00 | Females |
| Non-gravid female 7 | 10.00 | Females |
Richness estimates were significantly higher in females (28.5 ± 3.08, mean ± s.e) than in developing embryos (15.4 ± 3.08) (Wilcoxon/Kruskal-Wallis Test, χ2 = 5.4, DF = 1, P = 0.02, α = 0.05), indicating greater microbial diversity in the female gut microbiomes.
Consistent with the difference in richness estimates between embryos and females, we also found significant dissimilarity in microbial community composition between designated a priori embryo and female samples (MRPP; A = 0.11, P < 0.001, 1000 permutations). Females and embryos clustered separately in the 2D NMDS plot (Stress = 0.07) (Fig. 2). Three posteriori clusters (i.e. female dominated clusters 1 and 3, and embryo dominated cluster 2) were also significantly different from each other in terms of community composition, independent of the original sample designations (MRPP; A = 0.28, P < 0.001, 1000 permutations). Only one female is grouped with her corresponding embryos in cluster 2 (indicated by dashed arrows). The embryo in cluster 3 was not the offspring of any gravid females in this cluster. Significant differences in community composition between a priori embryos and females groups were also uncovered using weighted (MRPP; A = 0.10, P = 0.004, 1000 permutations) and unweighted (MRPP; A = 0.06, P = 0.006, 1000 permutations) Unifrac distance matrices. The clustering of the female and embryos samples in the NMDS space based on the unweighted Unifrac distance matrix is shown in Fig. S2 (Supporting Information). There was no difference in results when only gravid females and their associated embryos were analyzed.
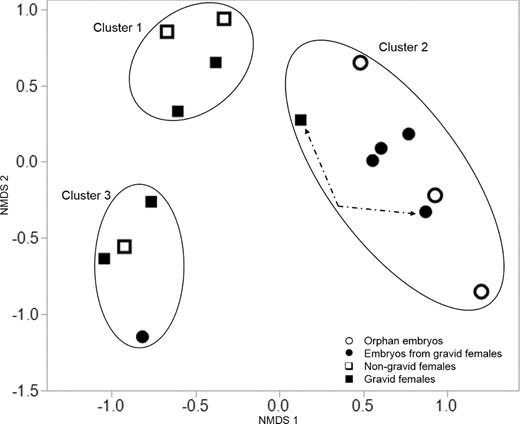
(NMDS (stress = 0.07) plot showing similarities and differences in bacterial community composition (i.e. placement) among orphan embryos (open circles), embryos from gravid females (filled circles), gravid females (filled squares) and non-gravid females (open squares) samples based on the Bray-Curtis distance matrix. Significant differences in microbial community composition between D. punctata females and embryos (MRPP; A = 0.11, P < 0.001, 1000 permutations) and among a posteriori clusters (MRPP; A = 0.28, P < 0.001, 1000 permutations) were determined. The only associated gravid female and developing embryo pair (Female 4–embryo 4) that clustered together are indicated with dashed arrows.
DISCUSSION
The bacterial family Blattabacteriaceae made up approximately 10% of all initial female iTags, and 51.1% of all initial embryo iTags. The dominance of Blattabacteriaceae in the developing embryos was expected and is attributed to vertical transmission of Blattabacterium sp. from females to oocytes during oogenesis (Sacchi et al.1996). Forty-two non-Blattabacteriaceae bacterial families were detected from female and embryo samples with varying degrees of variability, possibly attributable to limited sample sizes for both females and embryos, and the well-noted non-uniform gut microbial composition among adult cockroaches of the same species (Yun et al.2014; Pérez-Cobas et al.2015).
Given the viviparous mode of reproduction in Diploptera punctata, we anticipated similarities in bacterial community composition between females and associated embryos. There was no correspondence between microbial communities of gravid D. punctata females and associated embryos, except in one female–embryo pair (female 4–embryo 4) (Fig. 2). The absence of correspondence between females and embryos suggests variable routes of transference of non-Blattabacteriaceae bacteria to developing embryos. The differences in community composition between females and embryos, however, suggest mechanisms for the potential selective screening of bacterial groups transferred from females (or the environment) to embryos. These regulatory processes, if they exist, remain to be characterized.
Based on our results, a direct mode of microbial transfer from female guts to developing embryos seems unlikely. Possible sources of non-Blattabacterium bacteria in embryos besides the gut include the brood sac and the milk secretion. In this study, embryos were collected from females without attempting to remove the brood sac membrane, and the possibility that this may be the inoculum remains to be investigated. However, the brood sac membrane is not easily removed from the developing embryos without injury and its sterility remains to be confirmed. Alternatively, the brood sac secretion may be the source of bacterial inoculation from female to developing embryos. In the tsetse fly Glossina morsitans, the nutritive secretions provided by the female to developing embryos in the uterus is the source of non-Wigglesworthia bacteria in developing larvae (Attardo et al.2008). Furthermore, D. punctata embryos may acquire non-Blattabacterium bacteria from the environment in the interval between deposition into the vestibule in the female abdomen and retraction into the brood sac. It is unclear if the vestibule is axenic, but it most likely is not. Thus, the brief period between deposition and retraction may be responsible for the presence of gut-associated bacteria in the embryos. Further studies investigating the microbial presence and bacterial load of relevant bacterial taxa, such as Shewanellaceae and Halomonadaceae, in the brood sac, brood sac membrane, brood sac secretion and vestibule are required. The use of Shewanellaceae and Halomonadaceae-specific fluorescent in situ hybridization probes might yield insight into the processes regulating the establishment of the non-Blattabacterium microbiota in embryos.
Potential roles of non-Blattabacterium bacteria in developing embryos and gut bacteria in females
Some members of the Halomonadaceae and Shewanellaceae are sulfate-reducing bacteria capable of synthesizing sulfur-rich essential amino acids (Kuhnigk et al.1996; Baron 1997; Devkota et al.2012; Santos-Garcia et al.2014). Methionine and tryptophan are known to be deficient in the brood sac milk secretion provided by D. punctata females (Williford, Stay and Bhattacharya 2004). Interestingly, almost all cockroach-derived Blattabacterium genomes studied to date lack complete direct biosynthetic pathways necessary for methionine biosynthesis, with the exception of Blattabacterium from the German cockroach, Blattella germanica (Kambhampati, Alleman and Park 2013; Patino-Navarrete et al.2014). However, a variety of alternate genome-encoded enzymatic reactions in Blattabacterium genomes enable the utilization of sulfates from external sources in the biosynthesis of methionine. Thus, it is likely Blattabacterium and members of sulfate-reducing Halomonadaceae and Shewanellaceae associated with D. punctata embryos synergistically provide additional methionine and tryptophan, deficient in D. punctata milk secretions.
Gut-associated microbes of adult cockroaches have been shown to be involved in cellulose degradation (Nalepa, Bignell and Bandi 2001; Schauer, Thompson and Brune 2012) and reductive acetogenesis (Breznak and Kane 1990) and essential amino acid provisioning (Ayayee et al. 2014, 2016). The above-mentioned gut microbial functions may be relevant to D. punctata females, particularly during pregnancy. Efforts are underway to investigate gut microbial essential amino acid provisioning in gravid and non-gravid D. punctata females. Similarly, some of these gut microbial functions may be ascribed to other bacterial families associated with developing embryos despite the differences in diet between females and embryos. These functions by embryo-associated microbiota remain to be investigated with metatranscriptomic approaches.
In conclusion, we provide data showing distinct microbial assemblages between gravid D. punctata females and their associated developing embryos. This is the first study to provide this comparative characterization of both maternal and embryo-associated microbiota for this viviparous cockroach species. These differences might be the result of differential transmission of certain non-Blattabacterium bacterial families via the brood sac or brood sac secretions, and idea which remains to be investigated. This species provides a unique model in which to study key questions relating to the ecological value and evolutionary origins of the source inoculum and functions of the embryo-associated microbiota.
ETHICS STATEMENT
No animal rights were violated in the execution of this study and conditions were within the guidelines of the Ohio State University's Office of Responsible Research Practices
AUTHOR CONTRIBUTIONS
PAA and AMG conceived and designed the experiment. ZLS paid for sequencing. PAA analyzed the data and ZLS and AGM provided feedback. PAA, AMG and ZLS wrote the paper.
SUPPLEMENTARY DATA
Supplementary data are available at FEMSEC online.
Acknowledgments
We would like to thank Jennifer Ruisch for assisting with insect care, and the support staff at the Ohio Biodiversity Conservation Partnership Informatics cluster for technical assistance. We also thank Dr Joshua Benoit and Emily Jennings for providing helpful comments and insights.
FUNDING
This project was funded by the Professional Development Committee (PDC)-Quick Start Grant at The Ohio State University at Mansfield, awarded to AMG. The Ohio State University provided funding for AMG and ZLS for this study. Research support for PAA, was provided by the PDC-Quick Start Grant from The Ohio State University at Mansfield and awarded to AMG. The funders had no role in study design, data collection, and analysis, decision to publish or preparation of the manuscript.
Conflict of interest. None declared.
