


Abstract
The Cladorhizidae is a unique family of carnivorous marine sponges characterised by either the absence or reduction of the aquiferous system and by the presence of specialised structures to trap and digest mesoplanktonic prey. Previous studies have postulated a key role of host-associated bacteria in enabling carnivory in this family of sponges. In this study, we employed high-throughput Illumina-based sequencing to identify the bacterial community associated with four individuals of the deep-sea sponge Chondrocladia grandis sampled in the Gulf of Maine. By characterising the V6 through V8 region of the 16S rRNA gene, we compared the bacterial community composition and diversity in three distinct anatomical regions with predicted involvement in prey capture (sphere), support (axis) and benthic substrate attachment (root). A high abundance of Tenacibaculum, a known siderophore producing bacterial genus, was present in all anatomical regions and specimens. The abundance of Colwellia and Roseobacter was greater in sphere and axis samples, and bacteria from the hydrocarbon-degrading Robiginitomaculum genus were most abundant in the root. This first description of the bacterial community associated with C. grandis provides novel insights into the contribution of bacteria to the carnivorous lifestyle while laying foundations for future cladorhizid symbiosis studies.
INTRODUCTION
Marine sponges (phylum Porifera) are ubiquitous, widespread and ecologically important members of many marine environments (Hentschel et al.2012). Sponges harbour phylogenetically diverse yet specific and stable microbial communities; bacteria, archaea, single-celled eukaryotes and even viruses are thought to play central roles in maintaining host biology and function (Taylor et al.2007b; Webster and Blackall 2008; Harrington et al.2012; Rodríguez-Marconi et al.2015). Microbial residents can comprise up to 47% of the overall sponge biomass, are proposed to contribute to host metabolism and produce biologically active compounds beneficial to the sponge (Taylor et al.2007a,b; Webster and Blackall 2008).
Most sponges are filter feeders that circulate large volumes of water through a specialised aquiferous system and obtain nutrients such as carbon, oxygen, silica and nitrogen from the water column (Bell 2008; de Goeij et al.2013). As the majority of sponges follow this lifestyle, the aquiferous system has been regarded as a defining feature of the phylum (Lee et al.2012; Hestetun et al.2016). However, an exception to this rule is the carnivorous feeding strategy observed in the sponge family Cladorhizidae (Vacelet and Duport 2004; Hestetun et al.2016). Cladorhizids display unique morphological adaptions which enable carnivory, including an erect body morphology, a diminished or absent aquiferous system and the production of filaments or inflatable spheres serving as adhesive traps to ensnare live prey (Vacelet and Duport 2004; Hestetun et al.2016). This carnivorous feeding strategy is often regarded as an evolutionary adaptation to overcome the limitations of filter feeding in deep-sea oligotrophic environments, but has also been observed in species dwelling in food-rich environments (Watling 2007; Hestetun et al.2016).
Laboratory feeding experiments on Lycopodina hypogea (Vacelet and Boury-Esnault 1996) and in situ observations of Chondrocladia (Chondrocladia) gigantea (Hansen 1885) suggest a feeding sequence that begins when captured prey are quickly engulfed by a veil of migrating sponge pinacocyte cells (Vacelet and Duport 2004; Watling 2007; Martinand-Mari et al.2012). The engulfed prior pinacocyte layer then rapidly dedifferentiates and diminishes, leaving the prey in direct contact with the intercellular matrix (mesohyl) of the sponge. Archaeocytes and bacteriocytes then concentrate around the prey body, forming a ‘cyst’ in which prey degradation occurs. Interestingly, bacteriocytes contain large vacuoles harbouring numerous symbiotic bacteria similar to those observed in the mesohyl (Vacelet and Duport 2004). The archaeocytes, bacteriocytes and associated symbiotic bacteria are thought to facilitate prey degradation, presumably through enzymatic action. After degradation and disruption of the prey body, small elements are phagocytosed by the archaeocytes and bacteriocytes, and in the latter, the phagosomes can subsequently fuse with vacuoles containing symbiotic bacteria. Early stages of intracellular digestion might be dependent on bacteria-mediated actions or secreted proteins, given that the symbiotic bacteria within vacuoles increase in abundance and division rate at this stage (Vacelet and Duport 2004).
The functionality and importance of the carnivorous sponge microbiome likely extends beyond prey digestion. Recent studies have revealed the high abundance of ammonium-oxidising archaea and sulfate-reducing bacteria in L. hypogea, suggesting the involvement of the microbiome in detoxification and both nitrogen and carbon cycles (Dupont et al.2013, 2014). In filter-feeding sponges, secondary metabolites can act as protective agents against predators and epibionts (Pawlik 2011; Núñez-Pons and Avila 2014). Part of these secondary metabolites are thought to be of bacterial origin, constituting a mutually beneficial relationship between bacteria and host which could explain the evolutionary and ecological success of sponges (Blunt et al.2011; Pawlik 2011; Hentschel et al.2012; Núñez-Pons and Avila 2014). We expect similar relationships between carnivorous sponge species and their microbial residents.
Carnivorous sponges are mostly confined to deep-sea environments (Van Soest et al.2012) and have not been studied to the same extent as filter-feeding sponges. To the best of our knowledge, the only investigation of a carnivorous sponge microbiome focuses on L. hypogea, a species found in shallow-water caves (Dupont et al.2013). Here, we investigate the bacterial community (from here on colloquially referred to as the microbiome) associated with a deep-sea cladorhizid from the Gulf of Maine, identified as C. (Chondrocladia) grandis (Verrill 1879), using high-throughput sequencing (HTS) of the V6/V7/V8 region of the 16S rRNA gene. As the specimens have a unique morphology, with anatomical regions predicted to have different functions (Vacelet and Duport 2004; Hestetun et al.2016), we compared three distinct anatomical regions within four individual sponge specimens to investigate the variability of the microbiome within and among specimens.
MATERIALS AND METHODS
Sample collection
Chondrocladia specimens (N = 4) were collected from the base of the Northeast Channel of the Gulf of Maine (N41°48.2302΄, W65° 41.0412΄) on 27 July 2014. From the National Oceanic and Atmospheric Administration (NOAA) vessel Henry B. Bigelow, the CSSF-ROPOS (Canadian Scientific Submersible Facility, Remotely Operated Platform for Ocean Sciences) was used to locate and extract specimens from the seafloor at a depth of ∼852 m. Sponges displayed an erect body morphology, with a central cylindrical body (primary axis) perched on a stalk or ‘root’ embedded within the sediment (Fig. 1). From the central body axis, various lateral appendages (secondary axes) radiated outwards and terminated in translucent spheres. Upon surfacing, specimens were immediately dissected, and a single sphere, secondary axis and root sample were retained from each specimen for DNA extraction. These samples were frozen at −20°C in sterile containers until laboratory arrival, where they were transferred to a −80°C freezer until further analysis. Additional samples were fixed in buffered formaldehyde.
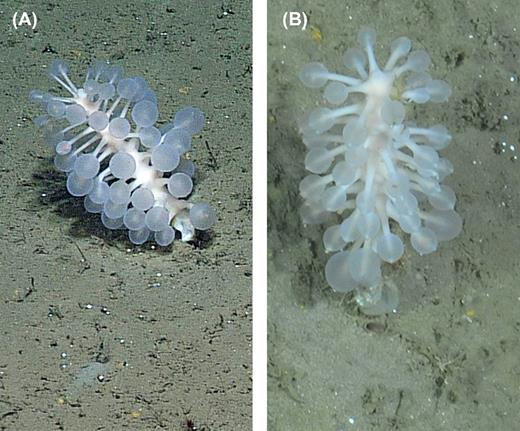
Chondrocladia grandis as observed in situ. (A) Side view, (B) top-down view.
Spicule preparation and examination
Spicules were isolated from sphere, secondary axis and root regions of a single specimen by immersing sponge fragments in 10% sodium hypochlorite. After carefully rinsing spicules in distilled water and 100% ethanol, they were transferred to stubs and imaged using a Quanta 650 Scanning Electron Microscope (FEI Company, Hillsboro, OR, USA). Between 2 and 23 spicules of each type were measured, and sizes reported as average ± standard deviation (range).
DNA extraction and HTS
Sponge sections were thawed on ice and rinsed three times with sterile nucleic-acid-free PBS to remove loosely associated bacteria and other contaminants. Samples were then aseptically cut into multiple thin sections and transferred to bead beating tubes containing 0.1 mm glass beads (MO BIO Laboratories, Inc., Carlsbad, CA, USA). DNA was subsequently isolated from cut sections using the MO Bio PowerViral DNA/RNA isolation kit (MO BIO Laboratories) according to the manufacturer's specifications. Extracted nucleic acids were checked for quality and concentration by using a NanoDrop 1000 (Thermo Scientific, Waltham, MA, USA) and outsourced for Illumina MiSeq 2 × 300-bp paired-end sequencing of the 16S rRNA (V6/V7/V8 region) gene at the Integrated Microbiome Resource of the Center for Comparative Genomics and Evolutionary Bioinformatics (Dalhousie University, Halifax, Canada), using previously published primers B969F and B1406R (Comeau et al.2011).
Molecular identification of sponge specimens
Collected sponge specimens were characterised by sequencing the 18S rDNA, 28S rDNA C1-D2 partition, the overlapping ‘Folmer’ and ‘Erpenbeck’ mitochondrial COI gene fragments and part of the asparagine-linked glycosylation 11 homolog (ALG11) gene, using primers and methods as in Hestetun et al. (2016). Amplified PCR products were purified using Agencourt AMPure XP beads (Beckman Coulter, Brea, CA, USA) and submitted for Sanger sequencing to the Centre for Applied Genomics (Hospital for Sick Children, Toronto, Canada). Obtained sequences were deposited in NCBI GenBank database under accession numbers KX950006–KX950009.
Reference sequences of other carnivorous sponges (N = 8) and of non-carnivorous sponges (N = 2) as outgroups were downloaded from GenBank and used for the phylogenetic analysis, which was performed in RAxML 8.1.21 invoked from RAxMLGUI 1.5b. To determine sponge taxonomy, 18S rDNA (1737 nt) alignments and concatenated alignments of the 28S rRNA (841 nt), COI (572 nt) and ALG11 (723 nt) genes were generated with MAFFT (version 7.221). Concatenated alignments were divided into three unlinked partitions based on included genes in RAxMLGUI. Phylogenetic trees were constructed using the maximum-likelihood method (Stamatakis 2014) and the GTR+GAMMA model (Lanave et al.1984; Stamatakis 2014). The robustness of the analysis was tested with the bootstrap method using 10 000 rapid bootstrap replicates.
Processing and taxonomic profiling of HTS data
The inhouse developed SPONS (Streamlined Processor Of Next-gen Sequences) pipeline was used to process Illumina MiSeq sequence data. An initial quality check was performed using Trimmomatic (version 0.33) to remove remaining primer and adapter sequences, check reads for quality (leading and trailing quality threshold = 25) and ensure that the remaining sequence information was of sufficient (>100 bp) length (Bolger, Lohse and Usadel 2014). Paired-end reads passing the initial quality check were subsequently merged using PEAR version 0.9 (Zhang et al.2014), requiring a minimal overlap of 105 bp and a P-value of <0.001 for read merging to occur. Operational taxonomic units (OTUs) were constructed by dereplicating the total sequence dataset using VSEARCH (merging strictly identical sequences, removing sequences with any ambiguities and adding abundance information) and using the dereplicated weighted dataset in conjunction with the de novo clustering program SWARM to create OTUs, retaining the seed of each OTU as representative sequence (Mahé et al.2014; Rognes 2016). The SWARM option ‘fastidious’ was used to promote merging of low-abundance swarms to closely related high abundance swarms, as to generate fewer OTUs with a higher rate of inclusion. Subsequently, representative OTU sequences were checked for chimeric sequences using VSEARCH (UCHIME de novo implementation, minimum score (h) = 0.30).
An internal SPONS wrapper function was used to infer taxonomy for all detected OTUs by invoking four distinct taxonomic classifiers through the assign_taxonomy.py command within the QIIME framework: UCLUST (maximum number of hits to consider = 1, minimum percent similarity = 0.8, minimum consensus fraction = 0.76), RDP (minimum confidence = 0.5), SortMeRNA (minimum consensus fraction = 0.51, similarity = 0.8, best alignments per read = 1, coverage = 0.8, e-value = 1.0) and BLAST (e-value = 0.001) (Altschul et al.1990; Wang et al.2007; Caporaso et al.2010; Edgar 2010; Kopylova, Noé and Touzet 2012). Subsequently, a consensus taxonomy was extracted for each OTU at the lowest taxonomic level at which a minimum of three classifier methods reported an identical result. For all classification methods, the full redundant SILVA SSU database and taxonomy (release 123) was used as reference (Quast et al.2013; Yilmaz et al.2014). OTUs with taxonomic assignments other than bacteria were removed from the dataset.
Full dataset phylogeny was performed by creating alignments of OTU sequences in MAFFT7 using the FFT-NS-2 algorithm, which were subsequently trimmed using gBlocks version 0.91b (minimum block length = 3, all gap positions allowed) (Castresana 2000; Katoh and Standley 2013). FastTree (version 2.18, fastest option enabled in combination with the generalised time reversible model) was used to infer approximately maximum-likelihood phylogeny (Price, Dehal and Arkin 2010). The source code of the SPONS pipeline is available upon request.
Bacterial diversity analysis, visualisation and statistics
Analysis of alpha diversity was performed with QIIME's alpha_rarefaction.py workflow utilising the phylogenetic diversity measure (PD_whole_tree) and Simpson's Equitability measure E (simpson_e) (Faith and Baker 2007). Statistical comparison of alpha diversity measurements was accomplished using compare_alpha_diversity.py in QIIME using the non-parametric test option with 999 permutations. Beta diversity analysis was performed using R with the PhyloSeq package (McMurdie and Holmes 2013; R Core Team 2015). In short, OTU abundance data were converted to relative abundance, which was subsequently used for principal coordinate analysis (PCoA) using the Bray–Curtis dissimilarity measure. PCoA analysis was also performed on variance stabilised OTU count data, generated by applying the variance stabilising transformation (VST) function available in the DeSeq2 R package on original count data (Love, Huber and Anders 2014). Community structure was visualised by collating OTU count data of samples according to their anatomical region and subsequently plotting relative abundance at phylum, family and genus levels as heatmaps using the enhanced heatmap function within the gplots R package (Warnes et al.2015). A supporting dendrogram was constructed using hierarchical clustering of the Bray–Curtis dissimilarity generated from DeSeq2 stabilised OTU count data with the ‘vegan’ community ecology R package (Oksanen et al.2016). Analysis of differentially abundant phyla, families and genera among anatomical regions was performed on non-collated data using the PhyloSeq implementation of DESeq2 (using the Wald significance test, local dispersion fit type and P < 0.05) to perform statistical testing. Interactive taxonomy visualisations were created using Krona (Ondov, Bergman and Phillippy 2011).
RESULTS
Genetic and spicule-based identification of sponge specimens
Five types of spicules were identified through electron microscopy (Fig. S1, Supporting Information): megascleres (mycalostyles and, in the root, microspinose strongyles), two unguiferous anchorate isochelae (large and small), and sigmas. Mycalostyles showed an average length of 1190.52 ± 370.68 μm (817.94–1994.71 μm) and width of 21.21 ± 4.81 μm (12.58–30.86 μm) with shorter mycalostyles occurring in the spheres and longer ones in the axis. The shorter microspinose strongyles were on average 207.34 ± 52.73 μm (152–257 μm) long and 5.24 ± 2.03 μm (3.01–7 μm) wide. Sigmas were consistent in size with an average length of 42.44 ± 2.56 μm (39.79–47.36 μm) and width of 2.06 ± 0.20 μm (1.78–2.34 μm). Two varieties of unguiferous anchorate isochelae were observed: large and small. The large isochelae were 65.77 ± 2.30 μm (63.29–68.98 μm) in length × 4.49 ± 0.32 μm (3.96–4.98 μm) in width, and displayed six teeth at each extremity with an average length of 10.96 ± 1.56 μm (8.39–13.12 μm). Small isochelae measured 22.78 ± 3.28 μm (19.17–25.57 μm) in length and 2.30 ± 0.20 μm (2.08–2.48 μm) in width, and had between five and nine observed teeth at each end.
Phylogenetic maximum-likelihood analysis of concatenated 28S, COI and ALG11 alignments (Fig. S2A, Supporting Information) placed the studied specimens within the carnivorous family Cladorhizidae and specifically within the Chondrocladia clade. The studied sponge had a distinct concatenated gene sequence, but clustered with the Chondrocladia gigantea reference sequence (100% bootstrap) with high-sequence identity (28S rDNA: 99.8%, COI: 100%, ALG11: 99%). Sequence analysis of the 18S rDNA showed a low-sequence identity to the 18S reference sequence of C. gigantea (97.8%) and the phylogenetic analysis placed the studied specimen as an outgroup of the C. gigantea and Cladorhiza abyssicola clade (Fig. S2B, Supporting Information). We tentatively identified our specimens as C. grandis based on the genetic distance observed within the 18S rDNA, 28S rDNA and ALG11 genes, the presence of microspinose strongyles (not reported to be present in C. gigantea) and the proximity of our collection site to the type location for C. grandis (Nova Scotia, Canada; Verrill 1879).
Inspection of HTS data
Sequencing of the V6/V7/V8 16S rRNA gene resulted in over 740 000 merged read-pairs passing quality checks, with an average of ∼47 000 sequences per sample. Dereplication, chimera removal and clustering resulted in the formation of 3725 high-quality, non-singleton bacterial OTUs distributed among samples (Table 1, File S1, Supporting Information). Furthermore, rarefaction curve analysis of observed OTUs indicated that all samples reached their diversity plateau, suggesting sufficient sequencing depth (data not shown). A single specimen (root of sponge 1) displayed both an extremely high OTU count and phylogenetic diversity compared to the other root samples analysed. As this was most likely the result of contamination with sediment bacteria, we excluded this sample from downstream analyses.
Summary of HTS results, OTU generation and associated biological alpha-diversity parameters for bacterial OTUs extracted from distinct C. grandis anatomical regions.
| Sponge specimen | Region/sample group | Paired-sequences | Observed OTUs | Simpson Equitability (E) | Phylogenetic diversity (PD) | E group meana | PD group meana |
|---|---|---|---|---|---|---|---|
| 1 | Axis | 63832 | 354 | 0.017 | 19.44 | 0.018 | 19.87 |
| 2 | Axis | 59822 | 253 | 0.022 | 21.25 | ||
| 3 | Axis | 95156 | 394 | 0.017 | 21.73 | ||
| 4 | Axis | 70966 | 272 | 0.015 | 17.06 | ||
| 1 | Rootb | 49218 | 5183 | 0.015 | 160.40 | 0.006* | 41.48* |
| 2 | Root | 68332 | 876 | 0.006 | 38.38 | ||
| 3 | Root | 36577 | 920 | 0.007 | 42.89 | ||
| 4 | Root | 93840 | 984 | 0.006 | 43.17 | ||
| 1 | Sphere | 47634 | 367 | 0.026 | 20.45 | 0.021 | 20.22 |
| 2 | Sphere | 76956 | 364 | 0.022 | 15.55 | ||
| 3 | Sphere | 76894 | 362 | 0.020 | 19.65 | ||
| 4 | Sphere | 52082 | 265 | 0.015 | 25.24 |
Metric calculated after exclusion of root sample 1, at even rarefaction depth 36577.
Sample excluded from downstream analysis due to uncharacteristically high OTU count and diversity.
Value significantly different from other sample groups (P < 0.05).
Bacterial community diversity and structure
Comparison of the Simpson Equitability (E) indices showed the evenness of species within bacterial communities to be low in all anatomical regions, with roots (divergent root sample excluded from all metrics) presenting the most uneven community (mean E = 0.006), significantly different from axis (mean E = 0.018, P < 0.05) and sphere (mean E = 0.021, P < 0.05) samples (Table 1). Phylogenetic diversity (PD) analysis revealed a significantly higher diversity in the root samples (mean PD = 41.48) compared to the axis (mean PD = 19.87, P < 0.05) and sphere (mean PD = 20.22, P < 0.05) samples (Table 1). No significant differences were observed for either E or PD between the sphere and axis samples.
A similar pattern was noted in results of the beta-diversity analyses (Bray–Curtis based PCoA). Using proportional count data, axis and sphere samples formed a distinct cluster, distant from root samples along the first principal coordinate, which represented 47.6% of the total variation inherent to the dataset and suggested distinct communities (Fig. 2A). However, the axis and sphere samples did not form a tight cluster along the secondary principal coordinate axis. PCoA analysis on VST transformed data (reducing the importance of highly abundant taxa) showed a similar distinction between root and sphere/axis samples along the first principal coordinate (28% of the variability within the dataset). The sphere and axis cluster was more refined using transformed data showing the close association of sphere and axis samples and an additional clustering per individual (Fig. 2B).
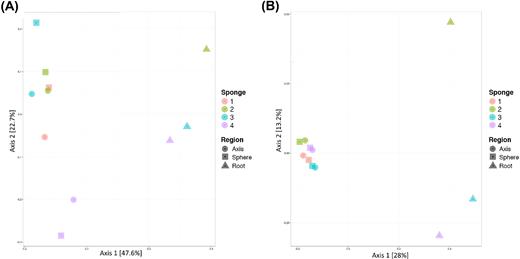
PCoA of bacterial community composition in carnivorous sponge samples, based on the Bray–Curtis dissimilarity. Analyses were performed on (A) proportional count data and (B) variance stabilised transformation pretreated count data. The percentage of dataset variation that each principal coordinate represents is shown on each axis. Shapes indicate type of sample (anatomical region), while colours represent the sponge specimen from which the sample originated.
We examined the bacterial composition of samples at phylum, family and genus levels. The observed OTUs were assigned to 26 phyla, 277 families and 429 unique bacterial genera. For each anatomical region, a fraction of the total generic diversity found was shared among all sponge individuals (Fig. S3, Supporting Information). However, when considering sequence abundance, these shared genera encompassed the vast majority (on average 98%) of all sequences recovered from a given anatomical region.
Proteobacteria and Bacteroidetes were the most abundant phyla observed in all anatomical regions, ranging between 33%–65% and 28%–42% in relative abundance, respectively (Fig. 3A). The abundance of these two phyla in the root samples was significantly lower (P < 0.001) than in sphere and axis samples. This lower abundance was offset by a significantly higher abundance of Actinobacteria in roots in comparison to axis and sphere samples (P < 0.001, 34% versus 4% and 3%, respectively).
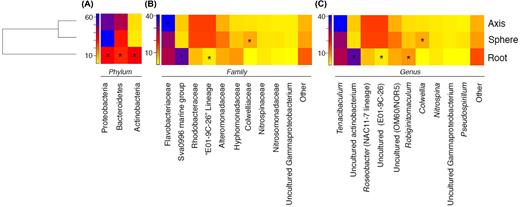
Heat map visualisation of abundance of the most prevalent bacterial taxa found in distinct anatomical regions of C. grandis at the phylum (A), family (B) and genus (C) levels. Count data from individual samples were collated based on anatomical region. A dendrogram constructed from variance stabilised OTU count data using hierarchical clustering of the Bray–Curtis dissimilarity is displayed on the left. Colouring of squares indicates OTU abundance (in relative percentage of sequence abundance) of each taxon within each anatomical region. Stars indicate, for a given taxon, the anatomical region in which the abundance of that taxon differs significantly from that in the other two regions (P < 0.05).
The Flavobacteriaceae was the only highly abundant family observed in all sample groups (root: 27%, sphere: 29%, axis: 41%, Fig. 3B); this family was present at a significantly higher abundance in the axis group (P < 0.001). Anatomical region-specific enrichment was observed, including a significantly higher abundance of the ‘Sva0996 marine group’ in the root group (P < 0.001, root: 34%, sphere: 3%, axis: 4.3%). Axis and sphere groups displayed a distinctly higher abundance of Rhodobacteraceae and a significant increase (P < 0.001) of an uncultured bacterium belonging to the ‘E01-9C-26’ unclassified Gammaproteobacteria lineage (both taxa at average abundances of 16% in axis and sphere groups compared to 5.5% Rhodobacteraceae and 2% E01-9C-26 in the root group). We also observed higher relative abundances of both Alteromonadaceae (not significant) and Colwelliaceae (P = 0.024) in the sphere group (11.4% and 6.8% for each family respectively) compared to root (7%, 0.2%) and axis (6.6%, 2.3%) groups. Furthermore, a non-statistically significant increase of Hyphomonadaceae was observed in the root group with an average relative abundance of 8.4%, higher than the values observed in sphere (4.8%) and axis (2.9%) groups.
Genus-level comparisons (Fig. 3C) indicated that the patterns observed at the family level are mostly driven by single genera. For example, the high abundance of the Flavobacteriaceae family translated into a high abundance of a single genus: Tenacibaculum. This genus was observed in all sample groups (root: 27%, sphere: 29%) and was more abundant in the axis group (41%). A significantly higher (P < 0.01) abundance of an uncultured Actinobacterium (‘Sva0996 marine group’) was observed in the root (34%) compared to the axis and sphere groups (4% and 3%, respectively). We also noted a significantly (P < 0.01) higher abundance of Robiginitomaculum in the root group at 8% than at 5% in the sphere and 3% in the axis group. Furthermore, abundance of both the NAC11-7 Roseobacter subclade and the uncultured ‘E01-9C-26’ Gammaproteobacterium was elevated in both the axis (16%) and sphere (15%) groups compared to the root group (5%, 2%), significantly so for the uncultured Gammaproteobacterium (P < 0.01). The OM60/NOR5 clade showed a higher abundance in the sphere group (11%, root: 7%, axis: 6%) but this was not statistically significant. Finally, the Colwellia genus comprised 7.9% of the sphere community and was significantly (P = 0.02) more abundant in contrast to 0.2% and 2% in the root and axis regions, respectively.
DISCUSSION
Despite substantial scientific interest, our understanding of bacteria–sponge interactions and symbiosis is incomplete and significant gaps remain in our knowledge of the composition, maintenance and function of these symbiotic relationships. In this study, we report on the microbiome of four carnivorous sponge specimens collected from the base of the continental shelf in the Gulf of Maine. Our collection site is very close to the type locality of the species Chondrocladia grandis (Verrill 1879). As the gross morphology of the latter species is highly similar to that of C. gigantea, as described by Lundbeck (1905), some authors have proposed that C. grandis may be a synonym of C. gigantea. Although no spicule information or gene sequences are available for C. grandis, phylogenetic analysis of the 18S rDNA, 28S rDNA, ALG11 and mitochondrial COI genes showed that the sponge specimens collected in this study were distinct from C. gigantea (Fig. S2, Supporting Information). Spicule types mainly resembled those previously described for C. gigantea, except for the identified microspinose strongyles. Based on spicule data, collection location and genetic differences with C. gigantea, we identified the collected specimens as C. grandis and deposited the first sequences for this species in GenBank. However, additional analyses are needed to fully confirm the taxonomy of this species.
To our knowledge, the bacterial community composition of Chondrocladia has never been investigated. The morphological structures used for prey trapping (sphere), attachment to the benthic substrate (root) and sphere support (axis) are unique to carnivorous sponges and we have placed a large emphasis on detecting common (inter-individual) patterns in bacterial community composition that are driven by the different anatomical regions.
Our results revealed a stark difference in overall bacterial community structure among the three anatomical regions. Analysis of both phylogenetic diversity and Simpson Equitability showed the bacterial communities present in the sphere and axis to be of similar diversity and evenness, while those in the root were significantly more diverse (P < 0.05) and less even (P < 0.05). The divergent nature of the bacterial community associated with the root is also evident from the PCoA analyses, where root samples were relatively distant from a tight cluster composed of axis and sphere samples along the first principal coordinate axis. This apparent difference in bacterial community could indicate that root and sphere/axis sections retain specific bacteria to support distinct biological functions. The increase in diversity within root sections could be due to their physical location within the marine sediments, where associations with benthic bacteria could potentially occur. Although samples were pretreated to remove sediment particles, the co-isolation of attached sedimentary bacteria cannot be excluded.
Analysis of bacterial community structure revealed the presence of 429 distinct bacterial genera, of which the 10 most abundant genera constituted the vast majority of the entire microbiome, in line with the low Simpson Equitability indices we observed in all samples. For each anatomical region, an examination of the genera shared by all individuals showed that, although only a select subset (on average 22%) were ubiquitous, this subset composed the majority (∼98%) of sequences found. Ubiquitous genera more likely represent true symbionts, while the diverse but rare non-ubiquitous genera could be prey-associated bacteria used as a food source, bacteria introduced through the aquiferous system that C. grandis uses to inflate trapping spheres, or surface-associated bacteria.
Remarkably, the microbiome showed a high abundance (up to 41%) of Tenacibaculum (family: Flavobacteriaceae) in all sample groups. Although Tenacibaculum have been reported in algae, corals, ascidians and sponges (Carlos, Torres and Ottoboni 2013; Dupont et al.2013; Fujita et al.2013; Tianero et al.2015), they were not detected in such high abundance. Certain members of the genus Tenacibaculum can produce hydroxamate siderophores capable of chelating dissolved inorganic iron, an essential nutrient (Fujita, Nakano and Sakai 2013). Although iron does not always constitute a limited nutrient in deeper waters due to iron remineralisation and dissolved iron fluxes from benthic sediment (Boyd and Ellwood 2010; Dale et al.2015), the high abundance of Tenacibaculum could indicate a symbiotic relationship where bacterial siderophores are utilised to chelate and scavenge ferric iron from the water column, although this has not been verified in this study. The previously reported production of (non siderophore) metal-binding peptides by filter-feeding sponges does however support a crucial role for iron within sponge biology (Guan et al.2001).
Other ubiquitous microbiome members were the nitrogen cycle related Nitrospina (family: Nitrospinaceae) and Nitrosomonas (family: Nitrosomonadaceae, not visible on heatmap), respectively, nitrite- and ammonia-oxidising bacteria (Kennedy et al.2014; Ngugi et al.2015). Microorganisms may contribute towards the nitrogen budget of sponges, and in carnivorous sponges the presence of both Nitrospina and Nitrosomonas might indicate a coupled nitrification system facilitating the uptake of nitrogen during prey digestion (Taylor et al.2007b). The presence of Nitrospina and Nitrosomonas should be further investigated to clarify the importance of these bacteria for nitrogen acquisition and remediation of toxic ammonia intermediates during prey digestion.
Most bacteria were not evenly distributed among anatomical regions. The most notable differences in bacterial abundance were observed within the sphere, where Colwellia (family: Colwelliaceae) and Pseudoalteromonas (family: Pseudoalteromonadaceae), both within the Alteromonadales order, were more abundant. Multiple species of Colwellia and Pseudoalteromonas can hydrolyse chitin, a glucose-derived polymer found in the crustacean exoskeleton (Brenner, Krieg and Staley 2007; Thomas et al.2008). The selective retention of Alteromonadales could indicate the need for chitin hydrolysis in order to facilitate prey breakdown and digestion.
The Roseobacter NAC11-7 lineage (family: Rhodobacteraceae), enriched in the sphere and axis, is ecologically important in marine environments and has been found associated with diverse eukaryotic organisms, including sponges (Buchan, González and Moran 2005; Wichels et al.2006). They display a wide range of metabolic capabilities including sulfur transformations, carbon monoxide oxidation and aromatic compound degradation. In addition, many Roseobacter species produce secondary metabolites, including antibiotic compounds effective against other marine bacteria and algae, and various toxic substances such as okadaic acid and paralytic toxins (Buchan, González and Moran 2005).
Finally, the root samples showed affinity for an uncultured bacterium of the Sva0996 marine group and Robiginitomaculum (family: Hyphomonadaceae). The presence of Sva0996 marine group has been reported in sponges; however, its functional and ecological aspects remain poorly understood. The presence of Robiginitomaculum is intriguing as this genus is thought to be a member of the hydrocarbon-degrading bacterial community (Guibert et al.2012). Besides the known function of marine sediments as natural hydrocarbon sinks, an increase in abundance and variation of cladorhizid species in the vicinity of hydrocarbon-enriched habitats such as seeps has previously been reported (Hestetun et al.2015). Stable isotope analysis and detection of methanol dehydrogenase pathways in Cladorhiza sp. indicate that methanotrophic bacteria can play an important role for nutritional carbon acquisition in carnivorous sponges (Vacelet et al.1996). Although the sponges sampled in this study were not situated near an evident seep, pockmarks of natural gas and methane hydrates have been observed in the Gulf of Maine (Rogers et al.2006). The hypothesis of utilising hydrocarbon as nutrient source and the potential contribution of Robiginitomaculum to this process is intriguing and needs to be further explored.
While the sole presence of bacteria in a host is not sufficient to conclusively establish whether relationships are truly symbiotic, identifying bacteria that are shared between multiple host specimens can reduce the bias due to detection of transient bacterial species and uncover valuable information on bacterial residents. Here we show that the bacterial community composition of C. grandis includes several highly abundant bacteria present in the whole sponge and shared among sponge specimens, and that certain genera are enriched in specific anatomical regions. The anatomical compartmentalisation of biological functions, including cell proliferation and differentiation, has been suggested for the carnivorous sponge Lycopodina hypogea (Martinand-Mari et al.2012); our results could indicate a similar functional compartmentalisation in C. grandis with bacteria likely making important contributions to host biology.
Based on data presented herein, we hypothesise that in C. grandis the sphere and axis communities facilitate prey capture and digestion whereas the root community might be involved in hydrocarbon breakdown. The diminished aquiferous system of C. grandis, in combination with the temporal/seasonal variability in copepod availability, could explain the need for this sponge to exploit all available food sources. Supplementing predation with nutrients from the water column and sediment and using bacterial symbionts as intermediates for these nutritional transactions could be an advantageous strategy for carnivorous sponges.
In conclusion, we report here the bacterial community associated with C. grandis and show that specific bacteria are retained in distinct anatomical regions. Multiple sponge individuals shared bacteria in sphere (Colwellia), axis (Roseobacter) and root (Actinobacteria, Robiginitomaculum) regions, suggesting biologically important symbiotic relationships in C. grandis. As many deep-sea species are difficult to maintain in vitro, molecular methods remain crucial to developing a basic understanding of the workings of these unique organisms.
SUPPLEMENTARY DATA
Supplementary data are available at FEMSEC online.
Acknowledgments
The authors thank chief scientists A. Metaxas (Dalhousie University) and M. Nizinski (National Systematics Laboratory, National Museum of Natural History, Smithsonian Institution), the crew of the National Oceanographic and Atmospheric Administration (NOAA) ship Henry B. Bigelow, and the ROPOS team from the Canadian Scientific Submersible Facility. D. Goudie and S. Hill assisted with SEM work.
FUNDING
This work was supported by the Natural Sciences and Engineering Research Council of Canada Ship Time Grant [436808-2013] and Discovery Grant [RGPIN-2015-06548]. The research cruise was part of the Northeast Regional Deep-Sea Coral Initiative, funded in part by NOAA National Marine Fisheries Service, NOAA Office of Marine and Aviation Operations, and NOAA's Deep-Sea Coral Research and Technology Program.
Conflict of interest. None declared.
REFERENCES
