


Abstract
Alkaline phosphatases such as PhoD and PhoX are important in organic phosphorus cycling in soil. We identified the key organisms harboring the phoD and phoX genes in soil and explored the relationships between environmental factors and the phoD- and phoX-harboring community structures across three land uses located in arid to temperate climates on two continents using 454-sequencing. phoD was investigated using recently published primers, and new primers were designed to study phoX in soil. phoD was found in 1 archaeal, 13 bacterial and 2 fungal phyla, and phoX in 1 archaeal and 16 bacterial phyla. Dominant phoD-harboring phyla were Actinobacteria, Cyanobacteria, Deinococcus-Thermus, Firmicutes, Gemmatimonadetes, Planctomycetes and Proteobacteria, while abundant phoX-harboring phyla were Acidobacteria, Actinobacteria, Chloroflexi, Planctomycetes, Proteobacteria and Verrucomicrobia. Climate, soil group, land use and soil nutrient concentrations were the common environmental drivers of both community structures. In addition, the phoX-harboring community structure was affected by pH. Despite differences in environmental factors, the dominant phyla in the phoD-harboring community remained similar in all samples, while the composition of phoX differed substantially between the samples. This study shows that the composition of phoD and phoX is governed by the same environmental drivers but that phoD and phoX occur partly in different phyla.
INTRODUCTION
Soil microorganisms play an important role in the cycling of organic phosphorus (P) by producing phosphatases, i.e. enzymes that hydrolyze organic P to orthophosphate, the only bioavailable P form for plants and microorganisms in soil (Frossard et al.1995; Condron, Turner and Cade-Menun 2005). Phosphatases are produced by many organisms when facing P scarcity, including archaea, bacteria, fungi and plants. In bacteria, phosphatase genes are part of the Pho regulon, a global regulatory network involved in cell P management, which includes functional genes coding for phosphatases such as acid and alkaline phosphatases, high-affinity phosphate transporters and other systems for mobilizing P (Santos-Beneit 2015). Alkaline phosphatases are common in the environment and particularly widespread across the bacterial kingdom but have also been found in archaea and fungi (Ragot, Kertesz and Bünemann 2015). PhoD and PhoX alkaline phosphatases are monomeric enzymes that catalyze the hydrolysis of both phosphomonoesters and phosphodiesters (Zaheer et al.2009; Kageyama et al.2011), which can represent up to 90% of the organic P fraction in soils (Condron, Turner and Cade-Menun 2005). Since a lack of available orthophosphate limits plant productivity in many terrestrial ecosystems, the production of microbial phosphatases plays an important role in plant nutrition (Richardson and Simpson 2011). However, our knowledge of how the environment affects these microbial functional genes remains very limited.
In soil microorganisms, the phoD gene is mainly found in the bacterial phyla Actinobacteria, Cyanobacteria, Deinococcus-Thermus, Planctomycetes and Proteobacteria (Tan et al.2013; Ragot et al.2016; Ragot, Kertesz and Bünemann 2015). Water-soluble phosphate addition has been reported to increase (Tan et al.2013), reduce (Chhabra et al.2012) or not affect (Jorquera et al.2014) the diversity of the phoD gene. In arable and grassland soils, pH was found to be a key driver of the total phoD-harboring community structure (Wang, Zhang and Marschner 2012; Cui et al.2015; Ragot, Kertesz and Bünemann 2015), although this is not clearcut, since in some of these studies, organic carbon (C) or available P also increased together with pH (Wang, Zhang and Marschner 2012; Cui et al.2015). Vegetation has also been reported to change the phoD-harboring community structure in monoculture and in mixed culture of wheat and legumes (Wang, Marschner and Zhang 2012). In contrast to phoD, our knowledge of phoX is poor. Metagenomic studies of the Global Ocean Sampling gave the first insights into the prevalence and composition of the phoX gene in the marine environment (Luo et al.2009; Sebastian and Ammerman 2009). Sebastian and Ammerman (2009) designed the first primers targeting the phoX gene based on sequences of marine bacteria such as Vibrio sp., Shewanella sp. and Roseobacter sp. They showed that phoX is common both in the Sargasso Sea and in the Chesapeake Bay. In marine bacteria, the phoX gene is most frequently found in Proteobacteria and Cyanobacteria, but has also been found in Actinobacteria, Bacteroidetes, Chloroflexi and Lentisphaerae (Luo et al.2009; Sebastian and Ammerman 2009). The phoX gene was also found in a few bacteria isolated from soil, such as Sinorhizobium meliloti (Zaheer et al.2009). On the whole, however, comprehensive knowledge on the effect of environmental factors on phoD and phoX genes in soil is still missing, especially on a large biogeographical scale.
In this study, we identified the key organisms harboring the phoD and phoX genes in soil and explored how the phoD- and phoX-harboring community structure and composition are affected by selected environmental factors. The phoD gene was investigated using primers designed by Ragot, Kertesz and Bünemann (2015). To study the phoX gene in terrestrial ecosystems, we designed a new set of primers that targets phoX in soil microorganisms. We sampled across three land uses (arable, grassland and forest) on two continents and assessed the relative importance of climate, soil physical, chemical and biological properties as drivers of the phoD- and phoX-harboring community structure and composition in a gene-targeted metagenomic approach using 454-sequencing. We hypothesized that the phoD- and phoX-harboring community structure and composition are affected (i) by climate and land use that are strong drivers of the total bacterial and fungal communities (Drenovsky et al.2010); (ii) by P availability assuming that low P availability promotes specific phoD- and phoX-harboring microorganisms, resulting in an uneven community composed by few dominant phyla; and (iii) by soil pH as both PhoD and PhoX reach their optimum hydrolyzing activity at alkaline pH.
MATERIAL AND METHODS
Site description and soil sampling
Soil was collected from five locations in Australia in September–October 2013 and from five locations in Switzerland in June–July 2014 (Table 1), i.e. in spring/early summer, covering a broad range of soil groups, vegetation and climatic conditions. Australian soils were sampled in three climate zones, from arid climate (Bsh) to warm temperate climate (Cfa and Cfb), while the Swiss sites were all classified as warm temperate climate (Cfb) (Kottek et al.2006).
General sampling site characteristics. Samples 1–15 were obtained in Australia (AUS) and samples 16–30 in Switzerland (CH).
| # | Sample | Location | Land use | Geographical coordinates | Climatea | Soil groupb | Vegetation |
| 1 | AUS1-A | Glenroy Australia | Arable | 34°35΄6΄S, 148°38΄5΄E | Cfb | Planosol | Triticum sp. |
| 2 | AUS1-F | Forest | 34°40΄4΄S, 148°38΄4΄E | Cfb | Planosol | Eucalyptus blackelyi, E. macrorhyncha, Vulpia bromoides, Briza maxima | |
| 3 | AUS1-Gf | Fertilized grassland | 34°35΄6΄S, 148°38΄5΄E | Cfb | Planosol | Microlaena stipoides, Austrodanthonia sp., Elymus scaber, Themada triandra | |
| 4 | AUS1-G | Grassland | 34°35΄6΄S, 148°38΄5΄E | Cfb | Planosol | Microlaena stipoides, Austrodanthonia sp., El. scaber, T. triandra | |
| 5 | AUS2-F | Kia-Ora Australia | Forest | 34°48΄18΄S, 148°35΄0΄E | Cfb | Planosol | Eucalyptus albens |
| 6 | AUS2-Gf | Fertilized grassland | 34°48΄18΄S, 148°35΄0΄E | Cfb | Planosol | Microlaena stipoides, Austrodanthonia sp., El. scaber | |
| 7 | AUS2-G | Grassland | 34°48΄18΄S, 148°35΄0΄E | Cfb | Planosol | Microlaena stipoides, Austrodanthonia sp., Elymus scaber | |
| 8 | AUS3-A | Narrabi Australia | Arable | 30°16΄22΄S, 149°48΄20΄E | Cfa | Planosol | Triticum sp. |
| 9 | AUS3-F | Forest | 30°15΄44΄S, 149°50΄12΄E | Cfa | Vertisol | Enneapogon nigricans,E. melliodora, Callitris glaucephylla, Casuarina sp. | |
| 10 | AUS3-G | Grassland | 30°15΄14΄S, 149°51΄53΄E | Cfa | Planosol | Chrysocephalum sp., Themada sp., Festuca arundinacea | |
| 11 | AUS4-A | Nyngan Australia | Arable | 31°25΄53΄S, 147°3΄56΄E | BSh | Cambisol | Triticum sp. |
| 12 | AUS4-F | Forest | 31°31΄21΄S, 147°8΄48΄E | BSh | Cambisol | Acacia dealbata, A. longifolia | |
| 13 | AUS4-G | Grassland | 31°25΄52΄S, 147°4΄9΄E | BSh | Cambisol | Mixed grasses and dicot plants | |
| 14 | AUS5-F | Mutawintji Australia | Forest | 31°16΄5΄S, 142°17΄22΄E | BSh | Leptosol | Acacia dealbata, A. aneura, A. longifolia |
| 15 | AUS5-G | Grassland | 31°16΄19΄S, 142°17΄44΄E | BSh | Leptosol | Mixed grasses and dicot plants | |
| 16 | CH1-A | Basel Switzerland | Arable | 47°30΄10΄N, 7°32΄21΄E | Cfb | Luvisol | Triticum sp.c |
| 17 | CH1-F | Forest | 47°30΄29΄N, 7°32΄16΄E | Cfb | Luvisol | Fagus silvatica, Galium rotundifolium, Maianthemum bifolium | |
| 18 | CH1-G | Grassland | 47°30΄9΄N, 7°32΄25΄E | Cfb | Luvisol | Winter ryegrass, Dactylis glomerata, Festuca rubra, Trifolium pratense | |
| 19 | CH2-A | Eschikon Switzerland | Arable | 47°26΄32΄N, 8°40΄50΄E | Cfb | Cambisol | Brassica napus |
| 20 | CH2-F | Forest | 47°26΄32΄N, 8°40΄51΄E | Cfb | Cambisol | Fagus silvatica, Hedera helix, | |
| 21 | CH2-G | Grassland | 47°26΄48΄N, 8°40΄40΄E | Cfb | Cambisol | Lolium perenne, Dactylis glomerata, Phleum pratense | |
| 22 | CH3-A | Reckenholz, Switzerland | Arable | 47°25΄50΄N, 8°31΄17΄E | Cfb | Cambisol | Triticum sp. |
| 23 | CH3-F | Forest | 47°25΄44΄N, 8°31΄32΄E | Cfb | Cambisol | Picea abies, Fagus sylvatica, Acer pseudoplatanus | |
| 24 | CH3-G | Grassland | 47°25΄51΄N, 8°31΄17΄E | Cfb | Cambisol | Agrostis capillaris, Plantago lanceolata, Lolium perenne | |
| 25 | CH4-A | Watt Switzerland | Arable | 47°25΄45΄N, 8°29΄35΄E | Cfb | Cambisol | Triticum sp. |
| 26 | CH4-F | Forest | 47°25΄47΄N, 8°29΄34΄E | Cfb | Cambisol | Fagus silvatica, Acer pseudoplatanus | |
| 27 | CH4-G | Grassland | 47°25΄45΄N, 8°29΄31΄E | Cfb | Cambisol | Arrhenatherum elatius, Anthoxanthum odoratum, Holcus lanatus, Ranunculus acris | |
| 28 | CH5-A | Zofe, Switzerland | Arable | 47°25΄35΄N, 8°31΄9΄E | Cfb | Luvisol | Triticum sp. |
| 29 | CH5-F | Forest | 47°25΄36΄N, 8°31΄11΄E | Cfb | Luvisol | Fagus silvatica, Quercus rubra | |
| 30 | CH5-G | Grassland | 47°25΄36΄N, 8°31΄9΄E | Cfb | Luvisol | Anthoxanthum odoratum, Dactylis glomerata, Ranunculus acris |
At each location, soil from three land uses, namely arable, forest and grassland, was collected, except at two Australian sites, where arable fields were missing. We assumed that all arable soils were fertilized, while all grassland soils were presumably not fertilized unless mentioned otherwise. The litter was removed in forest soils before sampling. The dominant plant species were identified at each site (Table 1). Five soil cores from the top 5 cm were randomly collected and homogenized by sieving (4 mm). Subsamples were stored at –20°C for molecular analysis and at 4°C for microbial biomass analysis. The remaining composite soil was air-dried and used to determine basic soil properties.
Basic soil properties
Soil texture, carbonate content, total C, N and P, and pH
Texture and carbonate content (CaCO3-C) were determined by a commercial soil analysis laboratory (Sol-Conseil, Gland, Switzerland). Total C (TC) and total N (TN) in soil were measured on dry and ground soil using a CNS analyzer (Thermo-Finnigan, San Jose, CA). Total organic C (TOC) was calculated by subtracting CaCO3-C from TC. Total P (TP) in soil was determined by wet digestion with H2O2/H2SO4 (Anderson and Ingram 1993) and measured with malachite green at 610 nm (Ohno and Zibilske 1991). Soil pH was measured in a soil suspension with 0.01 M CaCl2 in a 1 to 2.5 (w/v) ratio (shaken for 1 h) using a Benchtop pH 720A (Orion Research Inc., Jacksonville, FL, USA).
NaOH-EDTA extractable organic P and resin-extractable P
Organic P (Porg) was determined using alkaline extraction according to Bowman and Moir (1993). Briefly, 2.5 g of dry and ground soil were extracted with 0.25 M NaOH–0.05 M EDTA in a 1 to 10 (w/v) ratio for 16 h on a horizontal shaker. Soil extracts were then centrifuged (10 min at ca. 2100 × g) and filtered (Whatman No. 1, Sigma-Aldrich Chemie GmbH, Buchs, Switzerland). The concentration of inorganic P in diluted extracts was measured colorimetrically using malachite green. The concentration of total P in the extracts was measured colorimetrically after digestion with a digestion mix (prepared with 6 g ammonium persulphate dissolved in 100 mL of 0.9 M H2SO4) in an autoclave (20 min, 121°C) and neutralization. Porg was calculated as the difference between total and inorganic NaOH-EDTA extractable P.
Resin-extractable P (Pres) was determined according to Kouno, Tuchiya and Ando (1995) using anion-exchange resin membranes (BDH laboratory supplies #55164 2S, Poole, UK) charged with NaHCO3. Briefly, 2 g dry soil was extracted in 30 ml ddH2O together with a resin membrane (2 cm ×6 cm) for 16 h at 160 min−1 on a horizontal shaker. Resins were eluted in 0.1 M NaCl–0.1M HCl for 2 h and extracted P was measured colorimetrically using malachite green.
Microbial C and N
Microbial C and N analysis was carried out on moist soil using chloroform fumigation-extraction (Vance, Brookes and Jenkinson 1987). TOC and TN in the extracts were measured using a FormacsSERIES TOC/TN analyzer (Skalar, Breda, the Netherlands). Concentrations in non-fumigated samples were subtracted from those in fumigated samples to calculate chloroform-labile C (Cmic) and N (Nmic), without the use of a conversion factor, since it is soil specific and has not been determined for the soils in our study (Oberson and Joner 2005).
Potential acid and alkaline phosphatase activity
Potential acid and alkaline phosphatase activities (ACP and ALP, respectively) were determined following Marx, Wood and Jarvis (2001) as modified by Poll et al. (2006). Briefly, 1 g of fresh soil was dispersed in 100 ml of autoclaved H2O using an ultrasonic probe (Labsonic U, Braun Melsungen, Germany) for 50 J s−1 for 120 s. The assay was carried out on 50 μl aliquots of the soil suspension in a microplate with six analytical replicates, using 4-methylumbelliferylphosphate as substrate, and 0.1 M 4-morpholineethanesulfonic acid buffer (pH 6.1) (Marx, Wood and Jarvis 2001) or modified universal buffer (pH 11) (Alef, Nannipieri and Trasar-Cepeda 1995) as buffer for ACP and ALP, respectively. Microplates were incubated for 3 h at 30°C on a horizontal shaker. The increase in fluorescence over time was measured at 360/460 nm and converted into nmol substrate g soil−1 h−1 using a standard curve with 4-methylumbelliferone added to the soil suspension of each sample.
Molecular analysis
DNA extraction from soil
Genomic DNA was extracted in duplicate from 0.25 g frozen soil using PowerSoil DNA Isolation Kit (MO BIO Laboratories, Inc., Carlsbad, CA) following the manufacturer's instructions, but with a slight modification in the homogenization and cell lysis step: TissueLyzer II (Qiagen, Valencia, CA) was used twice for 3 min at 30 Hz. DNA concentration and quality were assessed with a microvolume UV/VIS spectrophotometer (UVS-99, UVISDROP; ACTGene, Inc., Piscataway, NJ, USA).
Analysis of bacterial and fungal community structures using T-RFLP
Bacteria- and fungi-specific PCR was carried out in duplicates on the 16S rRNA gene and the ITS gene region, respectively, using the primers and thermal profiles shown in Table S1 (Supporting Information). Reactions were carried out in 50 μl with 1× Taq buffer, 0.6 U μl−1 GoTaq DNA Polymerase (Promega, Madison, WI), 0.2 mM dNTP, 3 mM MgCl2, 0.2 μM of each primer, 4 μl of genomic DNA and molecular grade water in a Labcycler (SensoQuest, Göttingen, Germany).
Bacterial 16S rDNA and fungal ITS amplicons were digested for 4 h at 37°C with the restriction endonuclease MspI (Promega). The reaction mixture contained 1× restriction enzyme buffer, 2 μg acetylated bovine serum albumin, 5 U of restriction enzyme, 10 μl template and molecular grade water to a final volume of 20 μl. The digestion reaction was inactivated by incubation at 65°C for 15 min and the samples were purified with Sephadex G-50 (GE Healthcare, Glattbrugg, Switzerland), according to the manufacturer's instructions.
Between 1 and 4 μl of purified and digested PCR product was added to 10 μl HI-DI Formamide (Applied Biosystems, Foster City, CA) and GeneScan-500 LIZ as internal standard (Applied Biosystems). Samples were heated at 95°C for 5 min, immediately chilled on ice and loaded into an ABI 3130XL genetic analyzer (Applied Biosystems), using POP 7 polymer (Applied Biosystems) as running polymer. The electropherograms were analyzed with GeneMapper Software 3.7 (Applied Biosystems), retaining T-RFs with fragment sizes between 50 and 500 bp. Runs with total peak areas between 100 000 and 400 000 fluorescent units were accepted for analysis. Duplicate runs of each sample were processed and analyzed with the T-REX software (Culman et al.2009) as described in Mészáros et al. (2013). A data matrix based on the average peak areas of the duplicates was calculated.
Taxonomic and environmental prevalence of phoX alkaline phosphatase genes across microbial genomes and metagenomes
Taxonomic distribution of phoX genes was assessed using the IMG/M database (Integrated Microbial Genomes and Metagenomes, https://img.jgi.doe.gov), a dedicated system for annotation of whole genomes and metagenomes (Markowitz et al.2012). Draft and complete genome datasets were used to evaluate the distribution of phoX across kingdoms and phyla (data accessed on 10 September 2015). Metagenome datasets were categorized as ‘air’, ‘engineered and waste’ (bioreactor and waste treatment), ‘fresh water’, ‘marine environment’, ‘plant associated’ (leaves and wood), ‘animal-associated’ (associated with humans, arthropods, molluscs and sponges) and ‘terrestrial ecosystems’ (rhizosphere and bulk soil). These categories were chosen based on the environment-type classification of the IMG/M database. The relative abundance of phoX gene counts per environment type was calculated as the gene count number normalized by the total number of bases sequenced per metagenome dataset.
Design and validation of the phoX alkaline phosphatase-targeting primers
Gene sequences annotated as phoX and/or associated with COG3211 (Cluster of Orthologous Groups; http://www.ncbi.nlm.nih.gov/COG/), which corresponds to phoX alkaline phosphatase, were retrieved from the databases European Nucleotide Archive (ENA) and Uniprot Knowledgebase (UniprotKB). All annotated sequences belonged to the bacterial kingdom. They were then clustered at 97% similarity using CD-HIT (Huang et al.2010), resulting in a total of 228 sequences used as reference for the primer design (see list in Table S2 and taxonomic tree in Fig. S1, Supporting Information). Sequences were affiliated to eight phyla including Actinobacteria (48 sequences), Aquificae (1 sequence), Bacteroidetes (1 sequence), Chloroflexi (6 sequences), Cyanobacteria (27 sequences), Deinococcus-Thermus (1 sequence), Firmicutes (1 sequence) and Proteobacteria (143 sequences).
An alignment was constructed using MUSCLE (Edgar 2004) and manually reviewed and improved in Geneious 6.1.2 (Biomatters, Auckland, New Zealand, http://www.geneious.com). The most suitable regions for primer design were identified using Primer Prospector (Walters et al.2011). Forward and reverse candidate primers were then manually designed to reach the maximum coverage of the reference sequences. Candidate primer pairs were tested in silico using De-MetaST-BLAST (Gulvik et al.2012) to identify potential primer pairs with an appropriate product size and coverage of the reference sequences.
Candidate primers (11 forward and 13 reverse primers) were tested in a gradient PCR using a mixture of soil genomic DNA from field samples AUS1-A and CH4-G as template (Table 1). PCR reactions were carried out in a 25 μl volume containing 1x MyTaq Reaction Buffer (including MgCl2 and dNTPs), 0.5 μM of each primer and 0.6 U of MyTaq polymerase (Bioline, NSW, Australia) with 1–2 ng DNA as template in a S1000 thermocycler (Bio-Rad Laboratories, Hercules, CA). The amplification reaction included a gradient thermal profile with an annealing temperature of ± 3°C from the optimal annealing temperature calculated for each candidate primer pair. Amplicon size and intensity, and the presence of primer dimers, were assessed visually by electrophoresis on a 1.5% (w/v) agarose gel stained with ethidium bromide.
Amplicon coverage and specificity were evaluated for the most successful primer pairs by cloning and sequencing. PCR products were ligated at 4°C overnight using pGEM-T Vector Systems (Promega) and transformed into chemically competent Escherichia coli cells (α-select; F-deoR endA1 recA1 relA1 gyrA96 hsdR17 (rk−, mk+) supE44 thi-1 phoA Δ (lacZYA-argF) U169 Φ80lacZΔM15 λ−) following the manufacturer's instructions (Bioline). Restriction fragment length polymorphism (RFLP) profiling of clones with the expected insert size was conducted using HhaI (0.2 U μl−1 for 3 h at 37°C) (Promega), and profiles were visualized by electrophoresis on a 2% agarose gel. Representative inserts of unique RFLP profiles were then sequenced (Macrogen Inc., Seoul, Korea). The resulting sequences were used to evaluate the coverage and specificity of the candidate primer pairs using BLAST search (Altschul et al.1990). Finally, the primer set phoX-F455 (5΄- CAG TTC GGB TWC AAC AAC GA-3΄)/phoX-R1076 (5΄- CGG CCC AGS GCR GTG YGY TT-3΄), named after the position in the phoX gene in Rhodococcus opacus B4, had the highest diversity and coverage.
In addition, the coverage of the primer set phoX-F455/R1076 was compared with the three phoX-targeting primer sets (phoX1, phoX2, phoX3) published by Sebastian and Ammerman (2009) (Table S3, Supporting Information). The coverage of the phoX reference sequences used for this study by each forward and reverse primer and by each primer set was evaluated in silico in Geneious 6.1.2. The primer set phoX-F455/R1076 had the highest coverage and targeted 2.5 times more sequences than the other primers (Table S3). phoX-F455/R1076 was selected for 454-sequencing on all samples (Table S1).
Analysis of phoD- and phoX-harboring community structure and composition using 454-sequencing
Prior to sequencing, DNA extracts were tested for the presence of phoD and phoX by PCR using the primers and thermal profiles shown in Table S1. Duplicate DNA extracts were then pooled and adjusted to a concentration of 20 ng μl−1. Pooled extracts were sequenced on a GS-FLX+ platform (Roche 454 Life Sciences, Branford, CT) by Research and Testing Laboratory (Lubbock, TX, http://www.researchandtesting.com). Barcoded primer design, sequencing and initial quality filtering were carried out by Research and Testing Laboratory (RTL, Lubbock, TX). Briefly, sequences with a quality score below 25 were trimmed. Chimeras were removed using USEARCH with a clustering at a 4% divergence (Edgar et al.2011). Denoising was carried out using the Research and Testing Denoiser algorithm, which uses non-chimeric sequences and the quality scores to create consensus clusters from aligned sequences. For each cluster, the probability of prevalence of each nucleotide was calculated and accordingly, a new quality score was generated, which was then used to remove noise from the dataset. Amplification followed by sequencing was successful in 28 samples and 27 samples out of the 30 samples for phoD and phoX, respectively. Low abundance or absence of the genes, low quality of the DNA and amplification inhibitors (e.g. humic acids) may have prevented the sequencing of phoD and phoX.
Sequence analysis
Sequencing datasets of phoD and phoX were analyzed separately using MOTHUR (Schloss et al.2009). Sequences were analyzed as nucleic acid sequences to keep the maximum information and allow accurate identification. After demultiplexing, reads including ambiguities, mismatches with the specific primers and the barcode were removed. Reads with an average quality score below 20 were then filtered. Resulting reads were trimmed at 150 and 400 bp for phoD and at 250 and 600 bp for phoX as minimum and maximum length, respectively. Sequences were aligned using the Needleman-Wunsch global alignment algorithm as implemented in MOTHUR, using 6-mers searching and the aligned reference sequences as template. The pairwise distance matrix was calculated from the alignment and sequences were clustered using the k-furthest method as implemented in MOTHUR. A similarity cutoff at 75% was used to define the operational taxonomic units (OTUs) of phoD (Tan et al.2013). The similarity cutoff to define phoX OTUs was determined using the same approach as in Tan et al. (2013). Briefly, 20 phoX sequences representing the diversity of phoX and the 16S RNA gene of their corresponding bacterial strains were aligned using pairwise alignment (Table S2, Fig. S1, Supporting Information). Similarity matrices of phoX and 16S rRNA genes of their corresponding bacterial strains were extracted and plotted against each other (Fig. S2, Supporting Information). The similarity cutoff corresponding to 97% similarity of the 16S RNA gene was at 57% similarity for the phoX gene. OTU matrices were then normalized to the smallest library size using the normalized.shared command in MOTHUR to allow comparison between samples, by dividing the relative abundance of each OTU by the total number of reads per sample. The normalized values were then rounded to the nearest integer (Table S4, Supporting Information).
Taxonomy assignment was carried out using blastn in BLAST+ (Camacho et al.2009) with a minimum e-value of 1e−8 to retrieve NCBI sequence identifiers (GI accession number). Subsequently, in-house Perl scripts were used to populate and query a mysql database containing the NCBI GI number and taxonomic lineage information (script written by Stefan Zoller, Genetic Diversity Centre, ETH Zurich, available on request) (Tables S5 and S6, Supporting Information). The raw 454-sequencing files were deposited at the ENA under the project numbers ERP012746 (samples ERS914571- ERS914518) and ERP008947 (samples SAMEA3216867, SAMEA3216865, SAMEA3216863 and SAMEA3216861).
Data analysis
Correlations between environmental factors were evaluated using Pearson's linear regression in R v.2.15.0 (R Core Team, https://www.r-project.org/) (Table S7, Supporting Information). ANOVA was used to test for significant effects of geographical origin and land use on environmental factors, also in R.
Significant differences between the community structures were tested using analysis of dissimilarity (anosim) for the bacterial and fungal communities and pairwise Libshuff analysis as implemented in MOTHUR with 1000 iterations (Schloss, Larget and Handelsman 2004) for the phoD- and phoX-harboring communities. Chao1 species richness and evenness indices were calculated using PAST software (Hammer, Harper and Ryan 2001) for the bacterial and fungal communities and using EstimateS (Version 9, https://purl.oclc.org/estimates) for the phoD- and phoX-harboring communities (Table S8, Supporting Information). Rarefaction curves were calculated and extrapolated to 5000 and 3000 reads for phoD- and phoX-harboring communities, respectively, to standardize the samples using EstimateS (Fig. S3, Supporting Information).
Non-metric multidimensional scaling analysis (NMDS) was carried out to analyze the variation within the bacterial, fungal, phoD- and phoX-harboring communities, using the vegan package (vegan: Community Ecology Package. R package version 2.2-0. http://cran.r-project.org/package=vegan) in R. Redundancy analysis (RDA) was carried out to evaluate the correlation between environmental factors and community structures in R (Fig. S4, Supporting Information). Prior to analysis, the environmental factors were standardized using z-scores (Ramette 2007). ANOVA followed by a post hoc test was conducted to test significance differences in the relative abundances of each phylum between the environmental properties.
RESULTS
Soil properties in the two geographical origins, as affected by land use
The samples displayed a large range of soil properties (Tables 1 and 2). For example, pH ranged from 4.2 to 8.3 and TOC from 3.7 to 52.6 g kg−1 soil (Table 2). A 38-fold difference in both resin-extractable Pres and Porg was observed between the samples, while TP varied by a factor of 10.
General soil physicochemical and biological properties (mean of three analytical replicates). Letters indicate significant (<0.05) differences between samples from different geographical origins and from different land uses.
| Potential ACP | Potential ALP | ||||||||||||
|---|---|---|---|---|---|---|---|---|---|---|---|---|---|
| Texture | pH | CaCO3-C | TOC | TN | TP | Pres | Porg | Cmic | Nmic | activity | activity | ||
| Sample | (clay, silt, sand in g kg–1) | (g kg–1 soil) | (mg kg–1 soil) | (nmol substrate g–1 soil h–1) | |||||||||
| AUS1-A | 185, 333, 482 | 5.6 | 0 | 59.6 | 3.9 | 927 | 101.5 | 232 | 222 | 4.3 | 7928 | 117 | |
| AUS1-F | 177, 278, 545 | 5.5 | 0 | 52.6 | 2.0 | 470 | 8.2 | 63 | 281 | 25.7 | 3055 | 92 | |
| AUS1-Gf | 130, 252, 618 | 4.8 | 0 | 22.8 | 1.3 | 261 | 7.7 | 45 | 97 | 12.4 | 2574 | 36 | |
| AUS1-G | 128, 247, 625 | 4.9 | 0 | 19.7 | 1.1 | 229 | 3.0 | 61 | 156 | 15.6 | 2602 | 24 | |
| AUS2-F | 136, 461, 403 | 5.3 | 0 | 22.8 | 0.9 | 167 | 2.7 | 44 | 154 | 16.7 | 2914 | 41 | |
| AUS2-Gf | 138, 247, 616 | 5.0 | 0 | 23.2 | 1.3 | 234 | 5.2 | 66 | 114 | 15.2 | 2385 | 45 | |
| AUS2-G | 138, 276, 586 | 4.9 | 0 | 21.0 | 1.2 | 211 | 2.5 | 131 | 118 | 15.1 | 2560 | 43 | |
| AUS3-A | 336, 194, 469 | 6.3 | 0 | 7.8 | 0.4 | 259 | 54.0 | 24 | 58 | 2.5 | 490 | 94 | |
| AUS3-F | 120, 119, 761 | 5.8 | 0 | 28.5 | 1.0 | 235 | 10.3 | 27 | 118 | 10.1 | 2135 | 52 | |
| AUS3-G | 381, 270, 349 | 6.9 | 0 | 23.7 | 1.5 | 705 | 33.7 | 74 | 252 | 19.4 | 2064 | 720 | |
| AUS4-A | 265, 315, 419 | 5.4 | 0 | 16.3 | 1.1 | 616 | 53.0 | 58 | 86 | 5.7 | 1755 | 45 | |
| AUS4-F | 274, 337, 389 | 6.4 | 0 | 20.1 | 1.0 | 500 | 24.3 | 25 | 187 | 11.7 | 1242 | 163 | |
| AUS4-G | 298, 334, 368 | 5.7 | 0 | 15.0 | 0.9 | 466 | 6.5 | 56 | 140 | 12.8 | 1352 | 22 | |
| AUS5-F | 108, 53, 839 | 7.0 | 0 | 3.7 | 0.2 | 167 | 14.5 | 10 | 54 | 8.0 | 88 | 72 | |
| AUS5-G | 119, 113, 768 | 8.3 | 0 | 5.0 | 0.3 | 193 | 8.8 | 16 | 83 | 11.1 | 71 | 177 | |
| CH1-A | 185, 680, 135 | 5.9 | 0 | 14.5 | 1.1 | 771 | 25.1 | 235 | 144 | 16.6 | 1027 | 121 | |
| CH1-F | 487, 425, 88 | 5.5 | 0 | 45.2 | 2.8 | 599 | 16.0 | 228 | 487 | 53.9 | 2803 | 939 | |
| CH1-G | 201, 694, 105 | 6.3 | 0 | 27.8 | 2.2 | 808 | 32.1 | 289 | 362 | 45.0 | 1418 | 30 | |
| CH2-A | 242, 276, 482 | 7.4 | 14.4 | 39.9 | 3.0 | 1373 | 72.3 | 206 | 365 | 59.5 | 1069 | 3820 | |
| CH2-F | 287, 332, 380 | 5.1 | 0 | 51.4 | 2.8 | 450 | 16.0 | 162 | 397 | 62.7 | 6145 | 186 | |
| CH2-G | 238, 299, 463 | 7.8 | 14.4 | 44.7 | 3.1 | 1667 | 70.5 | 144 | 319 | 50.1 | 922 | 3061 | |
| CH3-A | 419, 397, 184 | 7.0 | 0 | 30.1 | 2.4 | 1059 | 21.7 | 404 | 232 | 26.7 | 522 | 1426 | |
| CH3-F | 198, 410, 392 | 4.2 | 0 | 27.7 | 1.4 | 403 | 4.8 | 188 | 128 | 11.8 | 2758 | 16 | |
| CH3-G | 400, 452, 148 | 7.4 | 0 | 44.4 | 3.4 | 932 | 17.9 | 340 | 754 | 97.1 | 1480 | 5327 | |
| CH4-A | 214, 366, 419 | 6.0 | 0 | 22.0 | 1.6 | 1000 | 88.5 | 177 | 190 | 26 | 1701 | 201 | |
| CH4-F | 211, 440, 349 | 4.3 | 0 | 30.4 | 1.3 | 283 | 3.8 | 88 | 157 | 20.9 | 3107 | 21 | |
| CH4-G | 302, 332, 366 | 6.6 | 0 | 36.1 | 3.0 | 700 | 12.0 | 254 | 506 | 68.5 | 2177 | 3668 | |
| CH5-A | 172, 249, 579 | 6.0 | 0 | 11.0 | 0.8 | 551 | 33.4 | 133 | 100 | 11.0 | 598 | 71 | |
| CH5-F | 177, 377, 447 | 4.4 | 0 | 32.3 | 1.7 | 301 | 9.2 | 128 | 208 | 22.5 | 5925 | 69 | |
| CH5-G | 174, 260, 566 | 5.9 | 0 | 22.4 | 1.7 | 457 | 18.8 | 195 | 316 | 45.0 | 1895 | 436 | |
| Geographical | AUS | 196 ± 9, 254 ± 10, 550 ± 15 | 5.9 ± 0.9 | NA | 22.2 ± 13.5a | 1.2 ± 0.8a | 376 ± 222a | 22.4 ± 27 | 59 ± 57a | 141 ± 66a | 12.4 ± 5.8a | 2214 ± 1794 | 116 ± 168a |
| origins1 | CH | 260 ± 10, 399 ± 13, 341 ± 16 | 6.0 ± 1.1 | NA | 32.0 ± 11.3b | 2.2 ± 0.8b | 760 ± 384b | 29 ± 25.4 | 211 ± 82b | 311 ± 171b | 41.2 ± 23.8b | 2236 ± 1674 | 1293 ± 1711b |
| Land use2 | Arable | 253 ± 8, 351 ± 14, 396 ± 14 | 6.2 ± 0.6a | NA | 24.0 ± 14.1a | 1.8 ± 1.1 | 820 ± 324a | 56 ± 27a | 183 ± 110a | 175 ± 94a | 19.0 ± 17.6a | 1886 ± 2330a | 737 ± 1243a,b |
| Forest | 218 ± 11, 332 ± 10, 449 ± 18 | 5.4 ± 0.9b | NA | 31.5 ± 14.3b | 1.5 ± 0.8 | 358 ± 141b | 11.0 ± 6b | 96 ± 72b | 217 ± 127a,b | 24.2 ± 17.9a,b | 3017 ± 1757b | 165 ± 263b | |
| Grassland | 221 ± 11, 315 ± 13, 465 ± 20 | 6.2 ± 1.2a | NA | 25.5 ± 11.0a,b | 1.8 ± 0.9 | 572 ± 413b | 18 ± 19b | 139 ± 102a,b | 268 ± 193b | 33.9 ± 26.4b | 1792 ± 741a | 1132 ± 1745a | |
Soil property abbreviations: CaCO3-C: carbonate, TOC: total organic C, TP: total P, Pres: resin-extractable P, Porg: organic P, Cmic: microbial C, Nmic: microbial N, NA: non-applicable.
One-way ANOVA comparing samples from Australia and Switzerland.
Two-way ANOVA with land use and site as factors (i.e. land use + site).
Australian soils had significantly lower concentrations of TOC, TN, TP, Porg, Cmic and Nmic than Swiss soils (Table 2). Potential ALP activity was on average 10-fold higher in the Swiss than in the Australian soils, while potential ACP activity was similar for both geographical origins.
Land use affected many soil properties (Table 2). Soil pH was generally lower in forest soils than in arable and grassland soils. The lowest TOC values were measured in arable soils and the highest in forest soils. Arable soils had the highest TP, Pres and Porg and the lowest Cmic and Nmic. The highest potential ACP activity was found in forest soils, and the highest potential ALP activity in grassland soils.
In our dataset, TOC was correlated with TN, TP, Porg, Pres, Cmic and Nmic (Table S7, Supporting Information). In addition, potential ACP activity decreased with increasing soil pH, while potential ALP activity showed the opposite trend (Table S7).
Correlations between bacterial and fungal community structures and environmental factors
Bacterial and fungal community structures clustered strongly according to their geographical origin (Fig. 1). The variation within the bacterial community structures was smaller in the Australian than in the Swiss soils, whereas the variation within the fungal community structure was similar for both geographical origins. Analysis of similarity showed that all community structures were significantly different from each other (P-value <0.05).
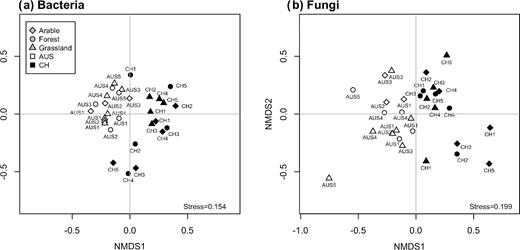
NMDS analysis of the bacterial (a) and fungal (b) community structures.
Environmental drivers of both bacterial and fungal community structures were climate, soil group, land use, soil texture and all P forms (TP, Pres and Porg), with Porg being the only highly significant driver common to both communities (Fig. S4a and S4b, Supporting Information; Table 3). The bacterial community structure was additionally correlated with pH, while the fungal community structure was affected by TOC and TN. Moreover, our results showed that ALP activity was correlated with the bacterial community structure, while ACP activity was correlated with the fungal community structure (Table 3).
Correlation between the bacterial, fungal, phoD- and phoX-harboring community structures and environmental factors based on RDA (Fig. S4). Highly significant correlations (<0.001) shown in bold.
| Bacteria | Fungi | phoD | phoX | |
|---|---|---|---|---|
| Climate | <0.001 | 0.022 | <0.001 | <0.001 |
| Soil group | 0.004 | 0.015 | 0.045 | 0.008 |
| Land use | <0.001 | 0.004 | <0.001 | 0.007 |
| Clay | n.s. | 0.047 | n.s. | n.s. |
| Silt | 0.034 | 0.007 | n.s. | n.s. |
| pH | 0.007 | n.s. | n.s. | 0.043 |
| CaCO3-C | n.s. | n.s. | n.s. | n.s. |
| TOC | n.s. | 0.043 | <0.001 | 0.020 |
| TN | n.s. | 0.002 | <0.001 | <0.001 |
| TP | 0.002 | 0.006 | 0.016 | 0.050 |
| Porg | <0.001 | <0.001 | <0.001 | <0.001 |
| Pres | 0.019 | 0.047 | 0.013 | 0.045 |
| ACP | n.s. | 0.008 | 0.042 | 0.025 |
| ALP | 0.023 | n.s. | n.s. | n.s. |
n.s.:non-significant.
Taxonomic composition, structure and main drivers of the phoD-harboring community
The phoD gene was found in 1 archaeal, 13 bacterial and 2 fungal phyla (Fig. 2a). The dominant phoD-harboring phyla that were found in all samples consisted of Actinobacteria, Cyanobacteria, Deinococcus-Thermus, Firmicutes, Gemmatimonadetes, Planctomycetes and Proteobacteria. No taxonomy could be assigned to 1.0% of the reads in the samples. An additional 0.2% to 5.5% of the reads were highly similar to bacterial sequences from environmental samples but could not be assigned to a phylum.
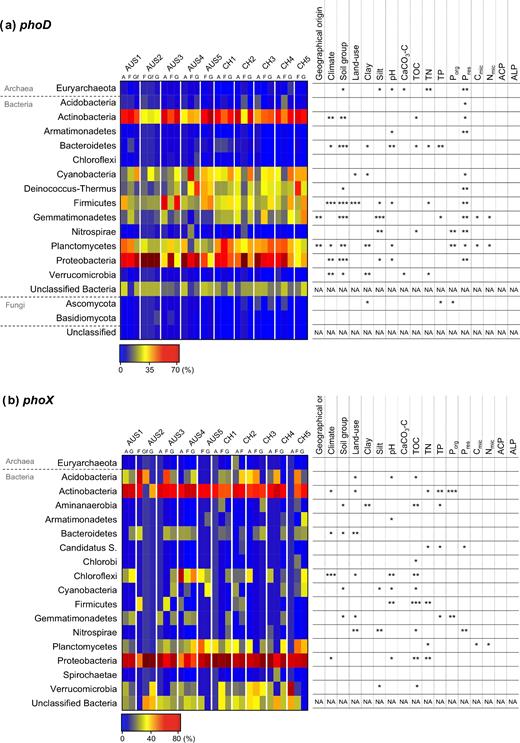
Relative abundance of phoD- (a) and phoX- (b) harboring phyla and their correlation with environmental factors, with P-values <0.05, <0.01 and <0.001 indicated by *, ** and ***, respectively.
All phoD-harboring community structures were significantly different from each other (P-value <0.05). However, the total phoD-harboring community structure was more variable within the Australian soils than within the Swiss soils, and the community was not separated according to geographical origins (Fig. 3a). The ALP activity was not correlated with the phoD-harboring community structure. The environmental drivers shaping the total phoD-harboring community structure were climate, soil group, land use and all measured nutrient concentrations (TOC, TN, TP, Porg, Pres) (Table 3). Furthermore, the environmental factors affected the relative abundance of each phoD-harboring phylum differently. The most influential environmental factor affecting the relative abundance of phoD-harboring phyla was Pres, influencing the relative abundance of 11 of the 16 classified phoD-harboring phyla, including all dominant phyla (Fig. 2a). In more detail, the relative abundance of phoD-harboring Actinobacteria, Cyanobacteria and Firmicutes increased to an optimum Pres between 25 and 50 mg P kg−1 soil, whereas the relative abundance of phoD-harboring Proteobacteria was lowest in this Pres class (Fig. 4a). The relative abundance of phoD-harboring Planctomycetes increased with Pres and Porg (Fig. 4a and b). The second most influential environmental factor affecting the relative abundance of phoD-harboring phyla was soil group, influencing the relative abundance of 9 of the 16 phoD-harboring phyla (Fig. 2a). phoD-harboring Proteobacteria were the most abundant phylum in the sampled Planosols, Vertisols and Cambisols, while phoD-harboring Actinobacteria were predominant in the sampled Luvisols and Leptosols (Fig. 4c). Land use affected the relative abundance of phoD-harboring Cyanobacteria, which were more abundant in grassland than in arable and forest soils, and of phoD-harboring Firmicutes, which were significantly lower in forest than in arable and grassland soils (Fig. 4a and d).
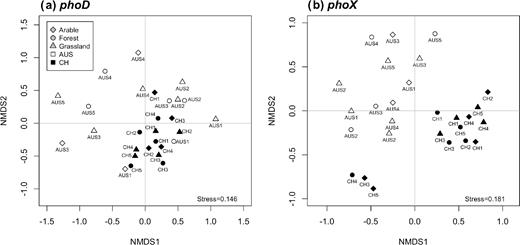
NMDS analysis of the phoD- (a) and phoX- (b) harboring community structure.
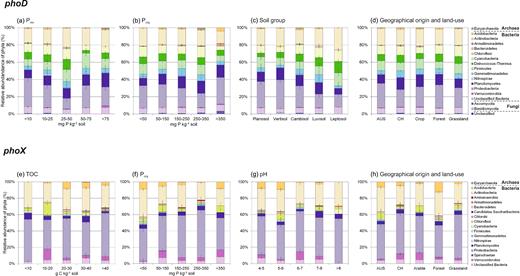
Average relative abundance of phoD-harboring phyla depending on (a) Pres (b) Porg (c) soil group, (d) geographical origins and land use, and of phoX-harboring phyla depending on (e) TOC (f) Porg (g) pH and (h) geographical origins and land use.
In summary, our results showed that climate, soil group, land use and nutrient concentrations are major determinants of the total phoD-harboring community structure, and Pres followed by soil group is the principal environmental driver governing the relative abundance of phoD-harboring phyla in the sampled soils. In addition, despite the large range of environmental factors, the phoD-harboring community composition was always made up of the same dominant phyla (Actinobacteria, Cyanobacteria, Deinococcus-Thermus, Firmicutes, Gemmatimonadetes, Planctomycetes and Proteobacteria).
Taxonomic composition, structure and main drivers of the phoX-harboring community
Before amplification of the phoX gene using the newly designed primers, our current knowledge of the taxonomic distribution of the phoX gene was evaluated using the IMG/M database in the same way as done for phoD in Ragot, Kertesz and Bünemann (2015). The phoX gene was reported in 5511 genomes assigned to 15 bacterial phyla (Fig. S5a, Supporting Information). The phoX gene was found in more than 25% of the genomes affiliated to Actinobacteria, Cyanobacteria, Deinococcus-Thermus, Lentisphaerae, Planctomycetes, Poribacteria, Proteobacteria, Spirochaetes and Tectomicrobia. Among the phoX-harboring Proteobacteria, Gammaproteobacteria were the most frequently reported in the IMG/M database, representing 69% of the Proteobacteria, followed by Alphaproteobacteria (16%), Betaproteobacteria (8%), Epsilonproteobacteria (3%) and Deltaproteobacteria (1%). The number of copies per genome varied between one and five, with 88% of the genomes containing only one phoX homologue copy.
Using the newly designed primers, we amplified the phoX gene from 1 archaeal and 16 different bacterial phyla (Fig. 2b). Actinobacteria and Proteobacteria were the dominant phoX-harboring microorganisms in most soils, ranging from 6% to 51% and from 54% to 70% of the total phoX-harboring community, respectively. However, the phoX-harboring phyla Acidobacteria, Chloroflexi, Planctomycetes and Verrucomicrobia composed up to 39% of phoX-harboring community in some soils, resulting in contrasting phoX-harboring community compositions between samples. Unclassified sequences represented between 3.9% and 5.0% of the reads in the samples and were all affiliated to the bacterial kingdom.
As for phoD, all phoX-harboring community structures were significantly different from each other (P-value <0.05). However, the variation in the phoX-harboring community structure was generally higher in the Australian than in the Swiss soils, but in contrast to phoD, there was a clear separation by geographical origins (Fig. 3b). Three Swiss soils (CH3-A, CH4-G and CH5-A), however, clustered away from the other soils, suggesting that their phoX-harboring community structure was significantly different from the other soils (Fig. 3b). In addition, the ALP activity was not correlated with the phoX-harboring community structure. The significant environmental drivers of the total phoX-harboring community structure were climate, soil group, land use, pH and all measured nutrient concentrations (TOC, TN, TP, Porg, Pres) (Table 3). At the phylum level, however, TOC was the most influential environmental driver, influencing the relative abundance of 9 out of 17 phoX-harboring phyla (Fig. 2b). In more detail, phoX-harboring Acidobacteria reached the highest relative abundance at a TOC of 20 to 30 g kg−1 soil (Fig. 4e). The maximum relative abundance of phoX-harboring Chloroflexi and Verrumicrobia was reached at a TOC of 10 to 20 g kg−1 soil. Furthermore, the relative abundance of phoX-harboring Actinobacteria was greatest when TOC was below 10 g kg−1 soil. Porg was negatively correlated with the relative abundance of phoX-harboring Actinobacteria and phoX-harboring Gemmatimonadetes, which reached the highest relative abundance at a Porg of 250 to 350 mg kg−1 soil (Fig. 4f). Land use and pH were the second most important environmental drivers after TOC, each influencing the relative abundance of 6 out of 17 phoX-harboring phyla (Fig. 4g). As land use and pH were correlated (Table S7), the effect of pH could not be distinguished from that of land use. For example, the relative abundance of phoX-harboring Acidobacteria was significantly higher in forest soils, which were characterized by a lower pH, than arable and grassland soils (Fig. 4g and h). Nonetheless, a few phoX-harboring phyla clearly reacted to either land use or pH. The relative abundance of phoX-harboring Proteobacteria was highest in grassland soils, followed by arable and forest soils (Fig. 4h). phoX-harboring Chloroflexi reached the highest relative abundances at a pH of 5 to 6, and phoX-harboring Verrucomicrobia at a pH of 6 to 7 (Fig. 4g).
Our results showed that climate, soil group, land use, pH and nutrient concentrations impact the total phoX-harboring community structure, and that TOC, land use and pH are essential environmental drivers of the relative abundance of phoX-harboring phyla in the sampled soils. The dominant phoX-harboring phyla varied substantially between soils.
DISCUSSION
Effect of land use on soil physicochemical and biological properties
The soils sampled in this study covered a large range of pH and total C, N and P (TP, Porg, Pres) concentrations comparable to other global studies (Lauber et al.2008, 2009). Our results showed that land use affected several soil properties including soil nutrients, microbial biomass and potential ACP activity (Tables 2 and 3).
In accordance with our results, arable management has been shown to improve P content in soil, principally via fertilization (Vogeler et al.2009), and to decrease microbial biomass and biological activity (e.g. phosphatase activity), mainly through soil disturbance and N and P fertilization (Feller, Frossard and Brassard 1994; Puget and Lal 2005; Wallenstein et al.2006). However, AUS1-A had a high ACP activity (Table 2). Similar results have been reported in soils with low phosphate fertilization and low tillage regime, in which ACP activity remained similar to that measured in the non-fertilized and no-tilled soils (Green et al.2007; Mijangos et al.2006). In addition, forest soils generally have higher TOC and are more acidic than arable and grassland soils (Balota et al.2014; Guo and Gifford 2002). The relatively low Pres and acidic pH of the forest soils can explain the high potential ACP activity in our study. The high potential ALP activity in grassland soils is likely linked to the high microbial activity characteristic of grassland soils, which is stimulated by high root density, biomass and root exudates (Steenwerth et al.2002). Thus, our results point to the strong correlation between land use and soil properties, and correlations of potential ACP and ALP activity with soil pH and microbial activity in the sampled soils.
Main environmental drivers of bacterial and fungal community structures
Our results across 30 soils and three land uses showed that major environmental factors shaping the bacterial and fungal community structures were climate, soil group, land use and soil P concentration (TP, Pres, Porg), with Porg most closely correlated with community structure (Table 3). The bacterial community structure was also affected by pH, whereas the fungal community structure was influenced by TOC and N content. Moreover, our results showed that ALP activity was correlated with the bacterial community structure, while ACP activity was correlated the fungal community structure (Table 3).
Our results support the findings of Drenovsky et al. (2010) that climate and land use govern bacterial and fungal community structure and composition. Moreover, soil group has been reported to be a strong determinant of the bacteria community structure (Girvan et al.2003). In other studies, the main soil properties influencing the bacterial community have been shown to be pH (Lauber et al.2009) and P availability (Siciliano et al.2014), which are in turn impacted by land use (Balota et al.2014).. The fungal community structure has been reported to be strongly affected by land use and location (Birkhofer et al.2012) as well as nutrient status, mainly N and P (Bissett et al.2011; Lauber et al.2008).
Main environmental drivers of phoD-harboring community structure and composition
The main environmental factors shaping the total phoD-harboring structure across the 30 soils and three land uses sampled in this study were climate, soil group, land use and all measured nutrient concentrations (TOC, TN, TP, Porg, Pres) (Table 3). At the phylum level, the relative abundances of the phoD-harboring groups were primarily affected by Pres and soil group (Figs 2a, 4a and c).
Fertilization with manure, water-soluble fertilizer and compost in arable and grassland soils has been reported to change the phoD-harboring community structure (Chhabra et al.2012; Fraser et al.2014; Sakurai et al.2008). Both applications of manure and water-soluble P fertilizer lead to higher Porg (Garg and Bahl 2008; Schefe et al.2015). Fertilization with N (270 kg N ha−1 yr−1) and P (240 kg P ha−1 yr−1) but not P fertilization alone led to a change in the phoD-harboring community structure in Chilean Andosol pastures (Jorquera et al.2014). On the other hand, water-soluble P fertilization significantly changed the phoD-harboring community structure in a long-term trial on pasture in Ireland (Tan et al.2013). The same dominant groups Actinobacteria, Cyanobacteria and Proteobacteria composed the phoD-harboring community in all treatments, suggesting that the phoD-harboring community composition is rather stable at different P input intensities (low, medium, high). Tan et al. (2013) also observed that the abundance of phoD-harboring Acidobacteria decreased with increasing P fertilization, supporting our results that the relative abundance of phoD-harboring Acidobacteria is negatively correlated with Pres. In our study, however, Pres influenced the relative abundances of additional phoD-harboring phyla such as Actinobacteria, Cyanobacteria, Firmicutes, Proteobacteria and Planctomycetes. These changes in relative abundance depending on Pres may be attributed to a selective process of phoD-harboring phyla that can efficiently produce PhoD and access P from organic compounds in soil under P starvation conditions (Rengel and Marschner 2005). Hence, Porg is also an important environmental factor for phoD-harboring community composition in our samples as shown by our results (Table 3).
In agreement with our study, organic C has been reported as an important driver of the phoD-harboring community structure in subtropical orchard soils (Cui et al.2015). Although soil pH has also been reported to be a strong determinant of the phoD-harboring community structure in grassland and in cropping systems (Ragot, Kertesz and Bünemann 2015; Ragot et al.2016; Wang, Zhang and Marschner 2012), in this study soil pH was not correlated with the total phoD-harboring community structure. This absence of a pH effect may be due to the greater variety of land uses and soil groups included in this compared with the other studies (Ragot, Kertesz and Bünemann 2015; Wang, Zhang and Marschner 2012). Nevertheless, pH was an important driver of the relative abundances of phoD-harboring Euryarchaeota, Armatimonadetes, Bacteroidetes, Firmicutes, Planctomycetes and Proteobacteria, suggesting that soil pH is a major determinant of some phoD-harboring phyla.
Our results are in agreement with the findings based on the IMG/M database of Ragot, Kertesz and Bünemann (2015), who reported the presence of the phoD gene in archaeal, bacterial and fungal genomes. In addition, in this previous paper we amplified the phoD gene from 13 different phyla in six grassland soils using the same primers as in this study. In our present study, the phoD gene was amplified from three additional phyla, namely Armatimonadetes, Ascomycota and Basidiomycota. This difference may be due to the larger variety of land uses, soil groups and soil properties included in this study that is likely to harbor a greater diversity of microorganisms.
Main environmental drivers of phoX-harboring community structure and composition
Using newly designed primers, we amplified the phoX gene in more archaeal and bacterial phyla than previously reported in the IMG/M database (Fig. S5, Supporting Information). In addition, we showed that the phoX-harboring community structure is mainly shaped by climate, soil group, land use, pH and all measured nutrient concentrations (TOC, TN, TP, Porg, Pres) (Fig. 2b, Table 3). At the phylum level, TOC, pH and land use were the leading environmental drivers, impacting the relative abundance of most phoX-harboring phyla (Fig. 2b).
The only insights into the phoX-harboring community composition in the environment available so far come from aquatic ecosystems. In Lake Taihu (China), the phoX-harboring community composition remained similar along a trophic gradient going from meso- to hypereutrophic and was predominantly composed of Alpha- and Betaproteobacteria, followed by Gammaproteobacteria and Cyanobacteria (Dai et al.2014). In marine bacteria, the phoX gene was also found in Actinobacteria, Bacteroidetes, Chloroflexi and Lentisphaerae (Luo et al.2009; Sebastian and Ammerman 2009). In contrast to these aquatic studies, we found the phoX gene in archaea and in an additional 10 bacterial phyla including Acidobacteria, Planctomycetes and Verrucomicrobia, which were highly abundant in several of our soil samples. The discrepancies observed between the phoX-harboring community composition in terrestrial and aquatic ecosystems suggest that different key players harbor the phoX gene in different types of environments. However, these discrepancies may be attributed to the different primers used in these studies, which were designed based on marine microbial sequences. The analysis of the metagenomes available from the IMG/M database showed that phoX is twice as abundant in terrestrial than in aquatic environments (Fig. S5b).
In aquatic bacteria, the phoX-harboring community structure has been shown to be positively correlated with total P concentration, with the highest diversity in hypereutrophic and the highest phoX gene abundance in mesotrophic regions (Dai et al.2014). Our results together with the outcomes of their study suggest that P concentrations and particularly Porg are important determinants of the phoX-harboring community and particularly affect specific phoX-harboring phyla in both terrestrial and aquatic ecosystems. In contrast to the phoD-harboring community, the phoX-harboring community structure and composition was also affected by soil pH in our study. In line with this, different pH optima have been reported for phoX-harboring organisms, e.g. pH 7.5 and 10 for Campylobacter jejuni and Synechococcus sp., respectively (van Mourik et al.2008; Kathuria and Martiny 2011).
Composition and structure of phoD- or phoX-harboring communities in relation to potential alkaline phosphatase activity
Neither the structures of the phoD- and phoX-harboring community nor the relative abundances of phoD- or phoX-harboring phyla were correlated with the potential ALP activity in our samples (Fig. 2). Moreover, potential ALP activity was not correlated with soil P concentrations (TP, Porg, Pres), whereas the phoD- and phoX-harboring community structures were both correlated with soil P concentrations (TP, Porg, Pres) and Porg in particular. Our results contrast with the findings of Fraser et al. (2014), who observed a negative correlation between potential ALP activity and available P. In addition, they reported a positive correlation between the abundance of the phoD gene and potential ALP activity, but did not find a correlation between the abundance of the phoD transcript and potential ALP activity.
It has been suggested that there is a high degree of functional redundancy in ecosystems so that ecological functioning remains generally unaffected by the exact species composition harboring functional genes (O'Donnell et al.2005). In addition, the potential ALP activity measured in the laboratory is only a proxy of the ALP activity under natural conditions (Rocca et al.2014). The potential ALP activity includes the activity of stabilized enzymes that persist in soil (Quiquampoix and Mousain 2005) and thus does not represent the ALP production by the current microbial community (Burns et al.2013). Key phoD- and phoX-harboring microorganisms may differ in the regulation and expression of phoD and phoX, leading to an uneven contribution to ALP production in soil.
Furthermore, not only PhoD and PhoX but also PhoA and other phosphatases, which were not analyzed here due to the lack of genetic tools, may contribute to the potential ALP activity measured in our samples. Further analysis combining potential ALP activity assay and genomics/transcriptomics of all three ALP genes are required to understand the link between potential ALP activity and the ALP genes.
Occurrence of phoD and phoX in various environments
Based on our meta-analysis of phoX using the metagenomes available in the IMG/M database (Fig. S5b), phoX was found in fewer ecosystems and in high abundance in terrestrial and marine ecosystems. In contrast, the presence of phoD was reported in many different ecosystems such as air, fresh water and marine ecosystems, microbiome associated with plant and animals and extreme environments such as deep sea hydrothermal vents (Ragot, Kertesz and Bünemann 2015). This suggests that phoX is less widespread in the environment than phoD.
CONCLUSION
Understanding the abundance and diversity of the microbes that harbor phosphatase genes in different soils is essential in managing phosphorus cycling in these environments. Our results suggest that the phoD gene is spread across the archaeal, bacterial and fungal kingdoms, while the phoX gene is found in archaea and bacteria only. In the contrasting samples of this study, the phoD-harboring community was always composed of the same dominant phyla, suggesting that the phoD-harboring community composition is rather stable across various environmental factors. In contrast, dominant phoX-harboring phyla varied significantly between soils. Our results suggest that Porg, climate, soil group, land use and other soil nutrient concentrations are common environmental drivers shaping biogeographical patterns of bacterial and fungal community structures as well as the phoD- and phoX-harboring community structure and composition. In addition, soil pH was an important driver of the bacterial and the phoX-harboring community structure. phoD-harboring phyla were principally affected by soil group and Pres, while phoX-harboring phyla were principally affected by TOC, followed by pH and land use. Thus, the structures of the phoD- and phoX-harboring community seem to be partly independent from the bacterial community structure.
SUPPLEMENTARY DATA
Supplementary data are available at FEMSEC online.
Acknowledgments
The authors would like to thank Dr. Stefan Zoller for the Perl scripts for taxonomic analysis and the Genetic Diversity Center (Zürich, Switzerland) for technical assistance. They also thank Monika Màcsai for her help with soil sampling, Laurie Schönholzer for TOC, TN and TOC/N analyses. They acknowledge Agroscope (Switzerland) and the University of Sydney (Australia) for access to the ‘DOK’ (bio-Dynamic, bio-Organic, and ‘Konventionell’) system comparison trial, the long-term fertilization trials in Watt (Switzerland), Glenroy, Kia-Ora and Narrabri (Australia).
FUNDING
This work was supported by the Swiss National Science Foundation (SNF, project 140900) and the University of Sydney.
Conflict of interest. None declared.
REFERENCES
