


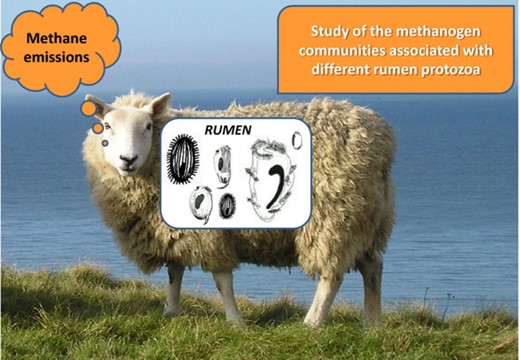
Abstract
Protozoa-associated methanogens (PAM) are considered one of the most active communities in the rumen methanogenesis. This experiment investigated whether methanogens are sequestrated within rumen protozoa, and structural differences between rumen free-living methanogens and PAM. Rumen protozoa were harvested from totally faunated sheep, and six protozoal fractions (plus free-living microorganisms) were generated by sequential filtration. Holotrich-monofaunated sheep were also used to investigate the holotrich-associated methanogens. Protozoal size determined the number of PAM as big protozoa had 1.7–3.3 times more methanogen DNA than smaller protozoa, but also more endosymbiotic bacteria (2.2- to 3.5-fold times). Thus, similar abundance of methanogens with respect to total bacteria were observed across all protozoal fractions and free-living microorganisms, suggesting that methanogens are not accumulated within rumen protozoa in a greater proportion to that observed in the rumen as a whole. All rumen methanogen communities had similar diversity (22.2 ± 3.4 TRFs). Free-living methanogens composed a conserved community (67% similarity within treatment) in the rumen with similar diversity but different structures than PAM (P< 0.05). On the contrary, PAM constituted a more variable community (48% similarity), which differed between holotrich and total protozoa (P< 0.001). Thus, PAM constitutes a community, which requires further investigation as part of methane mitigation strategies.
Enteric methane emissions from ruminants represent a concern of global magnitude. Understanding the microbial interactions in this process is therefore vital to develop adequate methane mitigation strategies.
Introduction
Methanogenesis represents the main H2 sink in the rumen and leads to a more complete oxidation of substrates by removal of H2 generated by fermentation and greater energy recovery by the rumen microorganisms (Demeyer & Van Nevel, 1975).
Methanogenic archaeal populations in the rumen are relatively limited in both numbers and diversity in comparison with rumen bacteria (Sharp et al., 1998). Typically, this methanogen population comprises < 3% of the rumen prokaryotic microbiota, and in contrast to rumen bacteria, which is composed of hundreds of different species, most of the rumen methanogens belong to only three principal genera, namely Methanobrevibacter (c. 62% of methanogens), Methanomicrobium (c. 15%) and ‘rumen cluster C’ recently renamed as Methanoplasmatales (c. 16%) (Paul et al., 2012), while the rest belong to minority genera such as Methanimicrococcus, Methanosarcina and Methanobacterium (Janssen & Kirs, 2008; St-Pierre & Wright, 2013). However, clearly methanogen diversity can be affected by the interanimal variation, diet, geographical region, rumen sampling and methodology used (Wright et al., 2007; Jeyanathan et al., 2011).
To increase access to H2, rumen methanogens are involved in a symbiotic relationships with rumen protozoa, which produce large quantities of H2 via their hydrogenosomes (Embley et al., 2003). The protozoa, in return, benefit from H2 removal, as H2 is inhibitory to their metabolism if not removed. As a result, it has been estimated that between 9% and 25% of the rumen, methanogens are associated with protozoa (Newbold et al., 1995) and c. 37% of methane from ruminants is produced by protozoa-associated methanogens (PAM) (Finlay et al., 1994).
Elimination of protozoa from the rumen (defaunation) has been shown to decrease methane emissions by 9–37% (Hook et al., 2010; Morgavi et al., 2010). In particular, Morgavi et al. (2010) reported that rumen protozoal concentration could explain 47% of the variability in methane emissions with a decrease in methane yield of 0.6 g methane kg−1 DM intake per reduction of 105 cells mL−1. The reasons for the lower methane emissions in defaunated animals are however still controversial (Hegarty, 1999; Morgavi et al., 2011). One hypothesis is that defaunation leads to decreased methanogen numbers, which are considered the sole producers of methane in the rumen (Morgavi et al., 2010). However, only modest correlations between methanogens and methanogenesis have generally been observed (Zhou et al., 2009; Mosoni et al., 2011). An alternative hypothesis suggests that defaunation results in the elimination of PAM, which could be considered as one of the most active methanogen communities in the rumen (Finlay et al., 1994). This later hypothesis based on the substitution of methanogen communities which differ in their methanogenic activity requires further investigation (Zhou et al., 2009). Several studies have already examined PAM (Sharp et al., 1998; Irbis & Ushida, 2004; Regensbogenova et al., 2004; Tymensen et al., 2012), and most of them agreed that Methanobrevibacter sp. is the predominant PAM; however, the contribution of Methanomicrobium sp. and RCC methanogens to the PAM's community is variable among studies and could indicate differences among protozoal groups.
Not all rumen protozoa are the same, and they can be classified into two major types: holotrich and entodiniomorphids. Major differences between holotrich and entodiniomorphid protozoa have been described in terms of morphology, substrate preference, O2 consumption, H2 production, growth rate and fermentation end products (Ellis et al., 1989; Lloyd et al., 1989). Similarly, within ento-diniomorphid protozoa, substantial metabolic differences have been identified among the subfamilies Enodiniinae, Diplodiniinae and Ophyoscolecinae (Williams & Coleman, 1992). Thus, it might be expected that some protozoa have a greater impact on rumen methanogenesis than others. In support of this premise, we have observed that holotrich protozoa seem to be key players in rumen methanogenesis, as inoculation of protozoa-free sheep with holotrich protozoa increased methane emissions to the levels observed in totally faunated sheep (Belanche et al., 2012a, b). However, it remains unknown whether this effect relies on the presence of a greater number of methanogens associated with holotrich protozoa, or on the presence of a specific population of holotrich-associated methanogens.
The aim of this study was to investigate whether free-living rumen methanogens and PAM communities differ. Moreover, we sought to investigate the methanogens associated with different protozoal groups obtained from holotrich-monofaunated sheep and/or by fractionating total protozoa according to their size. Finally, quantitative PCR was used to investigate whether rumen methanogens are specifically sequestrated within particular protozoal groups.
Materials and methods
Ethical statement
Animals were managed by trained personnel, and all animal procedures were carried out according to the Home Office Scientific Procedures, Act 1986 (PLL 40/316; PIL 40/9798) and after approval by the Aberystwyth University's Internal Ethical Review Panel.
Animals and diets
Four mature Texel-cross-breed sheep were used as rumen fluid donors in two consecutive 3-month periods (holotrich-monofaunated and total-faunated sheep). Lambs were isolated from their mothers within 24 h after lambing and maintained protozoa-free by avoiding protozoal transmission from adult ruminants. When lambs became adults (5 years old and 94 ± 8.6 kg average body weight) and after checking their protozoa-free status by ruminal microscopy, animals were then orally inoculated with a mixed holotrich population composed by isolates of Isotricha prostoma, I. intestinalis and Dasytricha ruminantium. These protozoal isolates were defrosted at 39 °C, diluted in simplex type salts solution (STS) (Williams & Coleman, 1992) and orally inoculated in all sheep to generate holotrich-monofaunated sheep in period 1. For period 2, the same four animals were orally inoculated with pooled rumen fluid obtained from four control animals (with a natural protozoal population). As a result, experimental sheep became totally faunated in period 2 (Fig. 1).
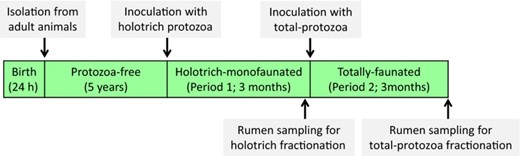
Diagram depicting sheep inoculation and rumen sampling.
To adapt the rumen ecosystem to the presence of the different protozoal species, a 3 months adaptation phase was allowed between each inoculation and rumen sampling. During the last month of each period, sheep were kept in individual pens with free access to fresh water and mineral blocks (Yellow Rockies, Tithebarn Ltd, Declared composition in mg kg−1: Mg 1000, Zn 120, Co 100, Mn100, I 50, Na 38 and Se 20). The experimental diet was composed by 67% ryegrass hay and 33% ground barley (chemical composition in % of DM: Ryegrass hay: 88.7 organic matter, 6.3 crude protein, 61.6 neutral-detergent fibre, 37.5 acid-detergent fibre, 5.4 acid-detergent lignin, 9.3 starch, 13.3 water-soluble carbohydrates and 1.4 ether extract; Barley: 98.0 organic matter, 8.1 crude protein, 13.9 neutral-detergent fibre, 4.4 acid-detergent fibre, 0.9 acid-detergent lignin, 59.0 starch, 2.5 water-soluble carbohydrates and 1.8 ether extract). This diet was designed to meet 1.5 times maintenance requirements and was distributed in two equal meals per day (09:00 and 19:00 hours).
Rumen sampling and holotrich fractionation
Rumen fluid from four holotrich-monofaunated sheep was used to investigate the holotrich-associated methanogens. Rumen contents (250 mL) were withdrawn by oro-gastric intubation before the morning feeding and filtered through a double layer of muslin. Rumen fluids were transferred into the laboratory within 30 min after extraction and were always kept at 39 °C under anaerobic conditions. Protozoa were fractionated following the protocol described by Belanche et al. (2012a). Briefly, rumen fluid was diluted (1 : 2 v/v) with STS buffer (Williams & Coleman, 1992) containing 2 g L−1 of glucose to improve protozoal flocculation, distributed in sedimentation funnels, and incubated for 1 h to allow the protozoal cells to settle. The sediment was collected and filtered through a nylon mesh (250 μm pore diameter) to remove plant material, and fractionated consecutively through six nylon meshes (80, 60, 45, 35, 20 and 5 μm pore diameters, Sefar AG, Hinterbissaustrasse, Switzerland). Fractionation was conducted at 39 °C and under CO2 gas, and rumen protozoa were filtered gently without using a vacuum pump to minimize cell damage; moreover, protozoal fractions were thoroughly washed (five rinse cycles) with STS buffer (50 mL per cycle) to remove the non-PAM and bacteria. As a result of this fractionation, six protozoal fractions were generated (H80, H60, H45, H35, H20 and H5, respectively). In each filtration, the initial filtrate plus the filtrate from the first rinse cycle were collected to continue the filtration process, while the filtrates from the 3rd, 4rd and 5th rinse cycles were discarded to avoid an unnecessary increase of the volume. After washing, each protozoal fraction was diluted in 50 mL of STS buffer and sampled in triplicate (1 mL into 9 mL of formalin at 4% v/v and NaCl 0.9% w/v) for protozoal counting and to check the levels of contamination with free-living prokaryotes (bacteria and methanogens). Presence of free-living prokaryotes was measured using two different approaches (fluorescence microscopy and optical density) and was considered as an indicator of the presence of free-living methanogens.
For fluorescence microscopy, samples fixed in formalin (100 μL) were stained with 5 μL of propidium iodide (50 nm) and incubated at 37 °C for 15 min. As this red dye stains dead prokaryotes and protozoa, samples (15 μL) were investigated using a fluorescence microscope equipped with Rhodamine filters (Zeiss, Axiovert 200M). For measuring the free-living prokaryotes by optical density, samples (2 mL) were centrifuged at 500 g for 10 min to sediment all protozoal cells. This supernatant was then centrifuged at 17 000 g for 10 min to sediment free-living prokaryotes/archaea. The contamination of the protozoal fractions with free-living prokaryotes/archaea was determined as the optical density at 600 nm (OD600 nm) of the 1st supernatant (containing the bacteria/archaea) after been corrected by the OD600 nm of the second supernatant considered as blank.
Total protozoa fractionation and optical counting
Rumen fluid from the same 4 sheep by now totally faunated was used to investigate the methanogens associated with different protozoal groups. Rumen fluid was sampled as described before for holotrich-monofaunated sheep. Protozoal fractionation procedure was also the same as described before and filtration through nylon meshes of 80, 60, 45, 35, 20 and 5 μm pore diameter generated six protozoal fractions (F80, F60, F45, F35, F20 and F5, respectively). Moreover, rumen filtrates that passed through the last nylon mesh (5 μm pore size) were collected and sampled to represent non-PAM (F < 5).
Each protozoal fraction was washed and diluted into 50 mL of STS buffer and sampled in triplicate (1 mL into 1 mL of formalin at 4% v/v and NaCl 0.9% w/v) for protozoal counting and inspection of the potential contamination with free-living prokaryotes/archaea. The remaining volume was used for DNA extraction. Protozoal species in all protozoal fractions were quantified by optical microscope using the procedure described by Dehority (1993). Protozoa were classified in six major groups according with their morphology and phylogenetic origin (Belanche et al., 2012a): Isotricha sp., Dasytricha sp., Entodinium sp., Epidinium sp., small Diplodiniinae and large Diplodiniinae, this latter group contained only two species (Eudiplodinium maggii and Metadinium medium).
Quantitative PCR
For DNA extraction, freeze-dried samples were homogenized and physically disrupted using a bead beater (BioSpec Products). Genomic DNA was extracted using the QIAamp DNA Stool Mini kit (Qiagen) following the manufacturer's instructions and the modifications previou-sly reported (Belanche et al., 2012c). DNA concentration and quality were measured by spectrophotom-etry corrected according to initial sample weight and dilutions.
Absolute concentrations of DNA from total bacteria, protozoa and methanogens were determined using qPCR and serial dilutions (from 10−1 to 10−5) of specific DNA standards (Belanche et al., 2012a, c). Briefly, rumen liquid-associated bacteria were obtained from each animal by sequential centrifugation (Cecava et al., 1990) and pooled to generate a bacterial DNA standard. Two protozoal DNA standards were generated by pooling DNA from all holotrich fractions (for holotrich protozoa quantification) and from all total protozoa fractions but F < 5 (for total protozoa quantification). Then, their true protozoal DNA concentration was determined by subtraction of the bacterial and methanogens DNA contamination from the genomic DNA concentration measured of the protozoal standards (Belanche et al., 2011a, b). Finally, a methanogens DNA standard comprised the methyl coenzyme-M reductase (mcrA) gene inserted into the PCR-TOPO plasmid (Invitrogen).
All PCR were performed in triplicate using a DNA Engine Opticon system (MJ Research). DNA template (2 μL) was added to the amplification reactions (25 μL) containing 1 mmol L−1 of each primer (Table 1) and 12.5 mL SYBR Green JumpStart Taq ReadyMix (Sigma). Amplification conditions were 95 °C for 5 min, then 45 cycles at annealing temperatures described in Table 1 for 30 s, 72 °C for 30 s and 95 °C for 15 s. The CT value was determined during the exponential phase of amplification, and a final melting analysis was performed to check primer specificity. Finally, efficiencies of PCR amplification were determined by serial dilutions of DNA samples.
Primers used for T-RFLP and qPCR analyses indicating annealing temperature and amplicon size
| Target | Author | Primers | T (°C) | Amplicon | ||||||||||||||||
| Forward | Reverse | |||||||||||||||||||
| Methanogens, TRFLP | Wright & Pimm (2003) | GCTCAGTAACACGTGG | CGGTGTGTGCAAGGAG | 55 | 1254 bp from 16S rRNA gene | |||||||||||||||
| Total bacteria, qPCR | Maeda et al. (2003) | GTGSTGCAYGGYTGTCGTCA | ACGTCRTCCMCACCTTCCTC | 61 | 150 bp from 16S rRNA gene | |||||||||||||||
| Total protozoa, qPCR | Sylvester et al. (2004) | GCTTTCGWTGGTAGTGTATT | CTTGCCCTCYAATCGTWCT | 55 | 223 bp from rRNA gene | |||||||||||||||
| Methanogens, qPCR | Denman et al. (2007) | TTCGGTGGATCDCARAGRGC | GBARGTCGWAWCCGTAGAATCC | 56 | 140 bp from mcrA gene | |||||||||||||||
Labelled with Cyanine 5 at the 5′ end.
Terminal restriction fragment length polymorphism (T-RFLP)
To study methanogen diversity, PCR was performed using a methanogen 16S rRNA gene-specific primer pair (Table 1). Each PCR was performed in duplicate and had a final volume of 25 μL containing 500 nmol L−1 of each primer, 1 μL of DNA template and 12.5 μL of master mix (Immomix, Bioline US Inc.). Amplification conditions were as follows: 95 °C for 10 min followed by 30 cycles of 55 °C for 30 s, 72 °C for 1 min, and 95 °C for 30 min with a final step of 10 min at 72 °C. Duplicates of amplification products were pooled and purified (Millipore MultiScreen PCRm96 plate), and the DNA concentration was measured by spectrophotometry. Then, 75 ng of purified PCR product was digested using 1 of 4 restriction enzymes (HaeIII, MspI, HhaI, or TaqI; New England Biolabs) at 37 °C (67 °C for TaqI) for 5 h followed by an inactivation cycle of 20 min at 80 °C. The restricted DNA fragments were cleaned by ethanol precipitation, suspended in sample loading solution (Beckman Coulter, High Wycombe, UK) containing a 600-bp size standard. Finally, the plate was run on the CEQ 8000 Genetic Analysis System (Beckman Coulter), and the terminal restriction fragments (TRF) were separated using the Frag4 parameters (denaturation step at 90 °C for 120 s, injection at 2 kV for 30 s, separation at 4.8 kV for 60 min with a capillary temperature of 50 °C). To remove the smaller peaks detected/noise and to increase repeatability, peaks with an area smaller than 0.25% of the sum of all peak areas were not considered (PCR-based artefacts). To investigate methanogen populations associated with different protozoa, Bray–Curtis similarity distances were calculated in square root-transformed data and a cluster analysis was performed using the un-weighted pair group method with arithmetic mean (upgma). Prin-cipal coordinates analysis (PCoA) was performed to further visualize these effects. The number of TRF (richness), the Shannon–Wiener index and the Shannon evenness index were measured as indicators of the diversity and organization of the microbial community (Hill et al., 2003).
Calculations and statistical analysis


where E is the efficiency of PCR amplification, and Ct were the cycle numbers in which the DNA was amplified. Microbial data were tested for normality using the Shapiro–Wilk test and if variances were unequal, log10 transformation was performed.
where Yij is the dependent, continuous variable (n= 4); μ is the overall mean; Ti is the fixed effect of the protozoal fraction (i= F80, F65, F45, F35, F20, F5, F < 5); Aj is the random effect of the animal used as rumen donor (j= 1–4); and eij is the residual error. Means were compared by Fisher's-protected LSD test. Differences of P< 0.05 were considered significant, and 0.05 < P < 0.1 was accepted as a tendency.
Finally, treatment effects on T-RFLP data were analysed by nonparametric permanova using primer 6 software (PRIMER-E. Ltd, Plymouth, UK). Moreover, pairwise comparisons were conducted to elucidate differences between two particular protozoal fractions. The pseudo-F-statistics and P-values were calculated after 10 000 random permutations using the Monte Carlo test (Anderson, 2001).
Results
Fractionation procedure
Sheep remained in good health and had similar intakes throughout both periods (1.64 ± 0.12 kg DM day−1). Rumen methanogen biodiversity was unaffected by the inoculation processes (20.5 TRFs on average), while holotrich-monofaunated and total-faunated sheep had similar methanogens numbers (7.3 log copies g−1 DM on average). In period 1, the mean ruminal concentration of protozoa was 5.2 × 10⁴ ± 1.9 × 10⁴ cells mL−1 composed of Isotricha sp., (23 ± 10%) and Dasytricha sp., (77 ± 10%). The protozoal fractionation procedure used in this period was successful, and filtration of a mixed holotrich population through six progressive smaller pore-size meshes allowed the separation of Isotricha sp. and Dasytricha sp. (Table 2). Most of the holotrich protozoa retained in fraction H60 were Isotricha sp. (98.0%), while fraction H20 retained mainly Dasytricha sp. (97.0%); therefore, these fractions were chosen as representative of these protozoal groups. Fractions H45 and H35 had a mixed population of both holotrich genera, and fractions H80 and H5 had a low yield, therefore these fractions were not further analysed.
Distribution of the main protozoal groups in different protozoal fractions obtained from holotrich-monofaunated sheep or from totally faunated sheep
Within a row, numbers with different superscripts differ (P< 0.05).
ND, not detected.
OD600 nm; Optical density at 600 nm of the supernatant after protozoal sedimentation. This indicates the abundance of free-living prokaryotes/archaea.
In period 2, experimental sheep were totally faunated and had a mean rumen protozoal population of 7.6 × 10⁵ ± 2.3 × 10⁵ cells mL−1 composed of Entodin-ium sp., (89.3 ± 2.8%), small Diplodiniinae (4.0 ± 1.6%), Epidinium sp., (2.5 ± 2.2%), Dasytricha sp., (2.4 ± 1.6%), large Diplodniinae (1.1 ± 0.5%) and Isotricha sp., (0.7 ±0.5%). The protozoal fractionation procedure was effect-ive, and the main protozoal groups were separated according to their sizes (Table 2). Large Diplodiniinae were highly abundant in F80 (74.5%), and their abundance decreased in further fractions as the pore size diminished until they were completely absent in fractions below 20 μm diameter (P< 0.001). Mid-size protozoa, such as Epidin-ium and small Diplodiniinae, were particularly abundant in mid-size fractions (F45 and F35 for the former and F35 and F20 for the latter group). In agreement with the fractionation from holotrich-monofaunated sheep, Isotricha sp., and Dasytricha sp., were abundant in fractions F60 and F20, representing 37.3% and 17.0% of the total protozoa, respectively. Entodinium sp., is the smallest protozoa in the rumen and was present mainly in fraction F5 (94.2%). All protozoal fractions but F < 5 had a greater protozoal concentration than that observed in the rumen as a result of the protozoal accumulation during the fractionation process. Finally, only a few small protozoa were able to pass through the 5-μm pore-size mesh, as a result fraction F < 5 had a very low protozoal concentration (109-times lower than the average across fractions). Therefore, fraction F < 5 was mainly composed by free-living bacteria and methanogens.
In terms of the potential contamination of the protozoal fractions with free-living bacteria and methanogens, measurements of the OD600 nm after protozoal sedimentation revealed the presence of similar and negligible levels of free-living prokaryotes/archaea across all protozoal fractions (average 0.01 OD units), being these values 32-fold times lower than observed in fraction F < 5. Similar results were observed using fluorescence microscopy. This technique detected no prokaryotes/archaea contamination in most of the samples (Fig 2). Only small amounts of feed particles and free-living prokaryotes, similar to observed in F < 5, were detected in fraction F5.
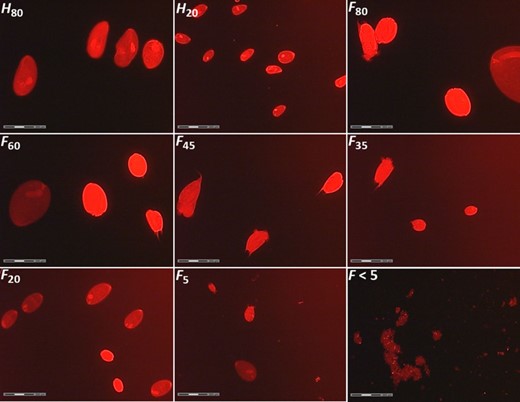
Fluorescence microscopy images of the different protozoal fractions using propidium iodide dye and rhodamine filters. Protozoa fractions were obtained from holotrich-monofaunated (H60 and H20) and totally faunated sheep (F80, F60, F45, F35, F20, F5 and F < 5) using different nylon meshes (80, 60, 45, 35, 20 and 5 μm pore size).
Microbial numbers by qPCR
In agreement with the protozoal counts, fraction H20 had a greater concentration of protozoal DNA, bacterial DNA and methanogens DNA compared to fraction H60 (Table 3). Likewise, large differences in the concentration of DNA of these microorganisms were observed among protozoal fractions isolated from total-faunated sheep. Fractions F80 had a lower protozoal DNA concentration than fractions with a smaller pore size (P< 0.001). On the contrary, fraction F80, together with fraction F5, had a greater concentration of bacterial DNA and methanogens DNA than observed in fractions containing mid-size protozoa (P< 0.001). As expected, fraction F < 5 had the lowest protozoal DNA concentration (107-times lower than the other fractions) but the greatest concentration of bacterial DNA and methanogens DNA. Only fraction F5 had similar concentrations of bacterial and methanogens DNA to those observed in fraction F < 5. The percentage of bacterial DNA with respect to total microbial DNA (protozoal + bacterial + methanogens) in the different protozoal fractions was as follows: 8% in H60, 15% in H20, 36% in F80, 7% in F60, 5% in F45, 4% in F35, 5% in F20, 15% in F5 and 98% in F < 5.
Concentration of protozoal, bacterial and methanogens DNA in different protozoal fractions obtained from holotrich-monofaunated and totally faunated sheep
| Fraction (pore size in μm) | SED | P-value | ||||||||||||||||||||||||||||||||||||||||||||||||||||
| 80 | 60 | 45 | 35 | 20 | 5 | < 5 | ||||||||||||||||||||||||||||||||||||||||||||||||
| Holotrich-monofaunated | ||||||||||||||||||||||||||||||||||||||||||||||||||||||
| Protozoa, ng mL−1 | 4.28 | 4.54 | 0.126 | 0.098 | ||||||||||||||||||||||||||||||||||||||||||||||||||
| Bacteria, ng mL−1 | 3.21b | 3.75a | 0.100 | 0.003 | ||||||||||||||||||||||||||||||||||||||||||||||||||
| Methanogens, copies mL−1 | 7.46b | 8.09a | 0.239 | 0.045 | ||||||||||||||||||||||||||||||||||||||||||||||||||
| Totally faunated | ||||||||||||||||||||||||||||||||||||||||||||||||||||||
| Protozoa, ng mL−1 | 3.72b | 4.36a | 4.34a | 4.42a | 4.56a | 4.40a | 2.32c | 0.176 | < 0.001 | |||||||||||||||||||||||||||||||||||||||||||||
| Bacteria, ng mL−1 | 3.45bc | 3.20 cd | 3.06d | 3.00d | 3.27bcd | 3.57ab | 3.82a | 0.161 | < 0.001 | |||||||||||||||||||||||||||||||||||||||||||||
| Methanogens, copies mL−1 | 7.68b | 7.61bc | 7.31c | 7.26c | 7.52bc | 8.05a | 8.14a | 0.172 | < 0.001 | |||||||||||||||||||||||||||||||||||||||||||||
To attain normality anova was conducted in log10-transformed data. Within a row, numbers with different superscripts differ (P< 0.05).
To better understand the amount of endosymbiotic microorganisms associated with protozoa independently of the protozoal concentration in each fraction, bacterial and methanogen numbers were expressed per protozoal cell and per unit of protozoal DNA (Fig. 3). Holotrich protozoa (H60 and H20) had similar bacteria/protozoa and methanogens/protozoa ratios to those observed for mid-size protozoa isolated from total-faunated sheep (F60, F45, F35 and F20). Fraction H60 and H20 had similar bacterial and methanogens DNA per unit of protozoa (P> 0.05), but fraction H60 had greater concentration of methanogens per bacterial DNA (P= 0.005).
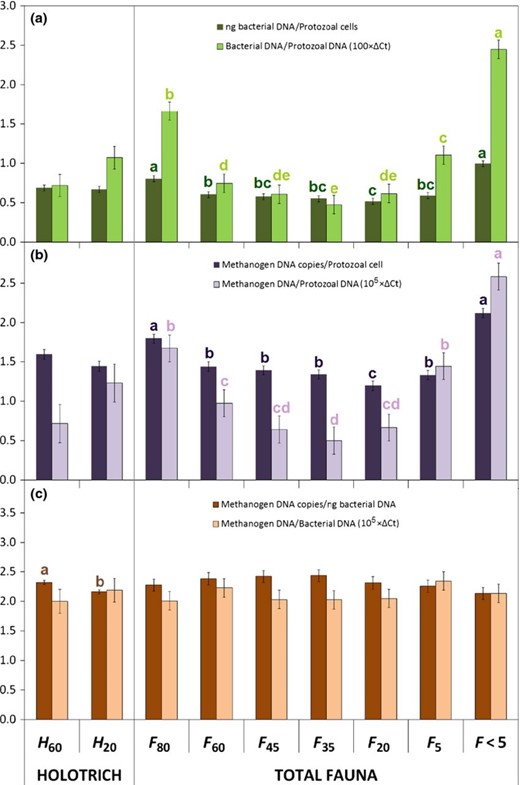
(a) Ratio bacteria/protozoa, (b) methanogens/protozoa and (c) methanogens/bacteria in different rumen protozoal fractions obtained from holotrich-monofaunated (H60 and H20) and totally faunated sheep (F80, F60, F45, F35, F20, F5 and F < 5) using different nylon meshes (80, 60, 45, 35, 20 and 5 μm pore size). Data were log10-transformed to attain normality. Bars with different letters (a, b, c, d, e) of the same colour differ (P< 0.05).
Within fractions isolated from total-faunated sheep (Fig. 3a), F < 5 had the greatest concentrations of bacterial DNA per protozoal cell (P< 0.001), followed by F80. This ratio bacteria/protozoa decreased progressively as the protozoal size diminished (F80 > F60 > F45 > F35). The only exception to this pattern was the increased ratio bacteria/protozoa observed in F5 in comparison with F20. A similar distribution pattern among the different protozoal fractions was observed in the ratio methanogens/protozoa (Fig. 3b). As a result, when methanogen numbers were expressed per unit of bacterial DNA (Fig. 3c), no differences were observed among the different protozoal fractions, indicating that the percentage of methanogens with respect to total bacteria are similar in all protozoal fractions and similar to the ratio observed in the rumen fluid (F < 5).
Methanogen diversity by T-RFLP
T-RFLP analysis indicated the presence of a complex methanogenic archaea population associated with different protozoal groups. T-RFLP generated 546 TRFs, and on average, each protozoal fraction had 89 ± 14 TRFs from the sum of the 4 restriction enzymes. Taq I generated the highest number of methanogens TRFs per sample (27 ± 7), followed by Msp I (23 ± 5), Hha I (19 ± 5) and Hae III (18 ± 5). Slight differences in the methanogen community and diversity were observed depending on the restriction enzyme used and the combination of the four enzymes was therefore considered to give a less biased result. Principal coordinate analysis (PCoA) using Bray–Curtis dissimilarity (Fig. 4a) showed a clear separation between the methanogen population associated with holotrich protozoa (H60 and H20) and that associated with total protozoa (F80 to F < 5). These differences among both meth-anogen communities were confirmed by the permanova analysis (Pseudo-F = 6.40, P< 0.001) and the lower average similarity observed within groups (58.1% for holotrich-associated methanogens and 48.7% for PAM) than between groups (42.1%).
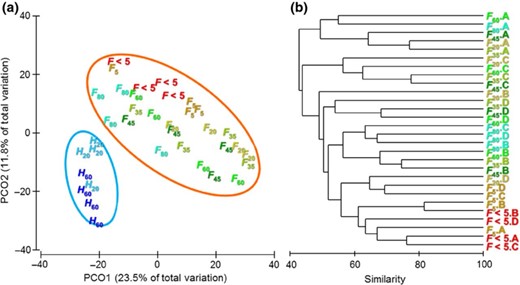
(a) PCoA illustrating the differences in the endosymbiotic methanogens associated with different rumen protozoal fractions obtained from holotrich-monofaunated (H) and totally faunated sheep (F). Big circles indicate the 90% confidential interval. (b) Dendrogram depicting the effect of total protozoa fractionation on their endosymbiotic methanogen populations. Protozoa fractions (F80, F60, F45, F35, F20, F5 and F < 5) were generated by a sequential filtration of rumen fluids from different sheep (A, B, C and D) through nylon meshes with a pore size of 80, 60, 45, 35, 20 and 5 μm, respectively.
Protozoal fractions isolated from holotrich-monofaunated sheep (H60 and H20) had a high similarity in the structure of their methanogen communities (55.6%) and showed no differences between them (Pseudo-F = 2.15, P= 0.095). Conversely, protozoal fractions isolated from total-faunated sheep showed clear differences in their methanogen communities (Fig. 4b, Pseudo-F = 2.01, P <0.001). permanova pairwise analysis (Table 4) revealed that methanogens associated with large protozoa (F80) differed to those observed in mid- and small protozoa (F35, F20 and F5, P< 0.05). On the contrary, mid- and small-size protozoa, present in fractions F60, F45, F35, F20 and F5, shared a similar methanogen population and the pairwise comparison showed no differences between them. In general, the sheep used as donors had a high impact on the methanogen population (Pseudo-F = 5.89, P <0.001) and most protozoal fractions grouped according the animal. In contrast, free-living methanogens (F < 5) grouped in an separated cluster independently of the sheep used as donor, indicating that this methanogen population differs significantly from that observed in PAM (P < 0.05). Only, methanogens in fraction F5 were, to some extent, similar to those observed in F < 5.
Pairwise permanova comparisons indicating the average similarity and differences between the endosymbiotic methanogenic populations associated with different protozoal fractions obtained from totally faunated sheep
Protozoal fractions were generated by a sequential filtration through nylon meshes with a pore size of 80, 60, 45, 35, 20 and 5 μm diameter. Higher Pseudo-F and lower similarities and P-values correspond to greater differences in the methanogen populations.
Regarding to the diversity indexes, similar richness (22.2 ± 3.4) and Shannon index (2.35 ± 0.21) were observed for methanogen communities associated with holotrich and total protozoa (Table 5). Within holotrich-associated methanogens, fractions H60 had a greater richness than H20 (P= 0.014); however, no differences were observed in terms of Shannon index and Shannon evenness. This observation suggests that the new TRFs which appeared in H60 were present in similar abundance than those observed in H20. Finally, diversity indices of endosymbiotic methanogens isolated from totally faunated sheep were unaffected by the protozoal fractionation procedure.
Diversity indices of methanogen populations associated with different protozoal fractions
Within a row, numbers with different superscripts differ (P< 0.05).
Diversity indices of methanogen populations associated with different protozoal fractions
Within a row, numbers with different superscripts differ (P< 0.05).
Discussion
Methodological aspects
Rumen protozoa are flexible and can squeeze through pores smaller than their apparent cell size; this ability is especially pronounced in holotrich protozoa due to their lack of skeletal plates. As a result of this flexibility, Isotricha sp., (average dimensions 192 × 95 μm) and Dasytricha sp., (72 × 37 μm) mainly appeared in fractions F80 and F20, respectively, where the average size of entodiniomorphids was 4-times greater. The fractionation protocol used, based on the successive filtration and washing of protozoa, was initially developed to minimize the bacterial contamination (Sylvester et al., 2004). As a result, a negligible concentration of free-living prokaryotes/archaea was observed in most protozoal fractions when examined by fluorescence microscopy and measuring the OD600 nm in the supernatant after protozoal sedimentation. Only fraction F5 had significant levels of contamination with feed particles, free-living bacteria and ultimately, free-living methanogens. In previous experiments, we observed that nylon meshes below 10 μm pore size can get partially blocked increasing the bacterial contamination (Belanche et al., 2011a, b). Consequently, the presence of some free-living bacteria and methanogens in fraction F5 could not be ruled out and may explain its greater similarity with F < 5 than observed in any other protozoal fraction. Moreover, the presence of consistent concentrations of bacterial DNA in ‘clean’ protozoal extracts (representing 4–15% of the microbial DNA) is in agreement with other authors [4.7% (Sylvester et al., 2005) and 7.4% (Yáñez-Ruiz et al., 2006)] and seems to be due to the presence of endosymbiotic bacteria and/or bacteria living in protozoal vesicles. This hypothesis is in line with the greatest bacterial DNA concentration observed in big protozoa (36% of the total DNA in fraction F80) as a result of their greater capacity to engulf rumen bacteria (Belanche et al., 2012a).
Isolation of specific protozoal groups from a mixed ciliate population is feasible using laborious procedures such as sedimentation through buffered gradients, density gradient centrifugation or migration to electric field (Williams & Coleman, 1992). Moreover, incubations with mannose (Lockwood et al., 1988) or wide spectrum antibiotics (Heald et al., 1952) have also been described as effective procedures to lyse holotrich- or protozoal-associated bacteria, respectively. Nonetheless, in preliminary studies, we observed that these compounds could alter the methanogen population and therefore were not used here. Our results showed that an improved version of filtration protocol described by Williams & Coleman (1992) did not permit a complete separation of particular protozoal groups but did allow us to generate different protozoal groups. Moreover, the use of holotrich-monofaunated sheep permitted to study holotrich-associated methanogens without using antimicrobial compounds.
In an earlier study to ours, Tymensen et al. (2012) isolated free-living rumen methanogens by removing protozoa using a 11 μm pore-size mesh. In our study, we preferred using a smaller pore size (5 μm) to minimize the presence of protozoa in the filtrate and therefore the potential bias on the free-living methanogen community.
Moreover, to have a better insight of the amount of endosymbiotic methanogens and bacteria, data were expressed per protozoal cell (absolute quantification) and per protozoal DNA (relative quantification). Overall, similar findings were observed when using both expression methods; however, the small discrepancies detected between fractions H60 and H20 depending on the expression form used could rely on the presence of variable rRNA gene copy numbers among the different protozoal species (Gong et al., 2013) or due to methodological aspects (i.e. variable efficiencies of DNA extraction and PCR amplification).
Association between protozoa, bacteria and methanogens
Rumen protozoa engulf rumen bacteria as their main protein source, but it has been demonstrated that these engulfed bacteria can survive during prolonged periods of time within protozoal vesicles becoming endosymbionts (Coleman, 1975). Early studies demonstrated that a significant proportion of endosymbionts (up to 104 per protozoa) were methanogenic archaea (Vogels et al., 1980; Tokura et al., 1997). Lloyd et al. (1996) using in vitro florescence hybridization demonstrate that different rumen protozoa species vary on the amount of endosymbiotic bacteria and archaea. While the number of epi-symbiotic methanogens seems to rely on the H2 partial pressure of the surrounding microenvironment (Stumm et al., 1982), the number endosymbiotic methanogens seems to be modulated by the metabolic activity of the protozoa (Tokura et al., 1997). Thus, considering that rumen protozoa provide the perfect habitat for methanogens to grow (i.e. low O2 pressure and high H2 availability) and a chemo-taxis between methanogens and protozoa has been demonstrated in vitro (Stumm et al., 1982), we hypothesized that methanogens could have a positive tropism towards protozoa resulting in a methanogens sequestration into the protozoal cytoplasm.
To our knowledge, there are no many studies describing the factors which determine methanogens tropism and engulfment by rumen protozoa. Early studies described however a number of factors which determine the rate of bacterial uptake by the protozoa, such as the characteristic of the protozoa (i.e. species and starvation), the bacterial inoculum (i.e. density, adhesion to substrates or bacterial morphology) and the medium used (pH and nutrients availability) (Coleman & Sandford, 1979; Wallace & McPherson, 1987). We recently demonstrated that the type of rumen protozoa and its size are the main factors which determine the in vitro engulfment of mixed bacteria by rumen protozoa (Belanche et al., 2012a).
Now, using the same fractionation protocol, we have demonstrated that protozoal size is also a key factor in determining the amount of methanogens per protozoal cell. Large protozoa present in fraction F80 had 1.7-, 2.6-, 3.3-times more methanogens DNA (in terms of ΔCt values) than observed in fractions F60, F45 and F35, respectively (Fig. 3b), suggesting a positive relation between protozoal size and number of endosymbiosis methanogens. The increased number of methanogens per protozoal cell (or protozoal DNA) observed in very small protozoa (F5) seems to obey to a methodological artefact due to a contamination with free-living methanogens, as previously explained. Interestingly, the ratio bacterial/protozoal in the different fractions followed the same pattern described for methanogens/protozoa and big protozoa (F80) had 2.2-, 2.7- and 3.5-times more bacterial DNA than observed in fractions F60, F45 and F35, respectively (Fig. 3a). Likewise, fraction F < 5 had similar increased values of bacteria and methanogens per unit of protozoal DNA (2.8- and 2.6-times greater than the average across fractions), indicating simultaneous changes in methanogens and bacterial numbers across samples. As a result of this, no differences were observed in the relative abundance of methanogens with respect to total bacteria among the different protozoal fractions, including those from holotrich-monofaunated sheep (Fig. 3c). Interestingly, these ratios were similar to that observed in the rumen liquid (F < 5). These findings suggest that methanogens are not retained within rumen protozoa in a greater proportion than observed in the rumen as a whole, and therefore, methanogens seem not to be specifically sequestrated inside of protozoa in a greater number than observed for rumen bacteria.
Methanogens associated with holotrich protozoa
Rumen methanogen populations, and the dietary factors which affect their structure, have been well studied during recent years (Denman et al., 2007; Wright et al., 2007; Poulsen et al., 2013). However few studies have examined PAM and the structure of this methanogen community is still not well characterized.
Our data showed that PAM isolated from holotrich-monofaunated and totally faunated sheep had similar diversity indices (21.9 and 22.2 TRF's respectively), possibly because most rumen methanogens belong to similar genera (Janssen & Kirs, 2008; Abecia et al., 2014). Despite having similar diversity, our findings indicated that the structure of the methanogen community associated with holotrich differs to that associated with total protozoa.
This observation confirms earlier findings which indicated that not all rumen protozoa are the same; having holotrich protozoa a greater number and/or more active hydrogenosomes than entodiniomorphids (Lloyd et al., 1989). Moreover, holotrich have a lower Km for the O2 than most rumen protozoa which enable them to scavenge O2 even when it is at low concentration (Ellis et al., 1989). As a result of this, a transient increase in O2 concentration after feeding occurred only in defaunated animals, but not it presence of holotrichs, and resulted in suppression of CH4 and CO2 production (Lloyd et al., 1989). Methanogens presence is heavily influenced by the presence of O2 and as they cannot sustain O2 stress for a prolonged period of time (Tholen et al., 2007). Furthermore, the holotrich ability to ‘protect’ oxygen sensitive methanogens has been demonstrated in vitro (Hillman et al., 1988). This ability, together with the great H2 production derived from holotrich-hydrogenosomes (Paul et al., 1990; Williams & Coleman, 1992), seems to provide, the perfect environmental conditions and substrate required for methanogens to grow, and ultimately may explain the presence of a particular methanogen community associated with holotrich protozoa. These findings are in line with our previous experiment which concluded that holotrich protozoa are key players in rumen methanogenesis, as inoculation of protozoa-free sheep with holotrich protozoa increased methane emissions to the levels observed in totally faunated sheep (Belanche et al., 2012b). The observed differences between the methanogen communities associated with either holotrich or total protozoa could be magnified by the fact that animals were sampled at different time periods (3 months apart). Nevertheless, protozoal fractions were isolated from the same animals fed with a constant diet throughout all experiment to minimize this potential bias.
Although all holotrich protozoa share certain metabolic activities, such as the ability to utilize simple sugars and small starch grains, or the production of H2, CO2, acetate, butyrate and lactate as the main fermentation products, experiments with washed suspensions of Isotricha spp. and D. ruminantium showed differences in O2 scavenging capability (Lloyd et al., 1989) and production of lactate and H2 (Van Hoven & Prins, 1977). These metabolic differences seemed not to be important enough to modify the structure of the methanogen community-associated Isotricha sp., and Dasytricha sp., but could explain the differences in their methanogens diversity indexes observed in this experiment. More research is needed to investigate the effect of a total or a partial elimination of holotrich protozoa from the rumen ecosystem on the methanogen population and ultimately as a methane mitigation strategy.
Methanogens associated with total protozoa
PAM are one of the most active methanogen populations in the rumen, and their elimination from the rumen could explain, to some extent, the decreased methane emissions observed in defaunated animals (Morgavi et al., 2010). Tokura et al. (1997) using protozoal cultures reported similar changes in the apparent methane production and the number of PAM. Our T-RFLP analysis seems to support this hypothesis as clear differences between the populations of PAM and free-living methanogens were observed: free-living methanogens (F < 5) represent a constant community characterized by having a high similarity within samples (67.2%). Contrarily, methanogens associated with different protozoal fractions clustered according to the sheep used as donor, but without a clear grouping pattern among protozoal fractions, indicating that PAM seems to be a more changeable community with a lower similarity within samples (43.5% vs. 59.5% similarity). Given the different environmental conditions present in each protozoal type, the high plasticity of endosymbiotic communities may represent an adaptation strategy amongst PAM.
Detailed studies based on DNA sequencing indicate that Methanobrevibacter spp. appear to be the predominant PAM (Tokura et al., 1997; Sharp et al., 1998; Irbis & Ushida, 2004; Regensbogenova et al., 2004). On the contrary, Methanoplasmatales spp., have only been described as PAM in one study (Irbis & Ushida, 2004) and the contribution of Methanomicrobium sp., to PAM is still controversial (Sharp et al., 1998; Regensbogenova et al., 2004). In a recent study in which two methods were used to characterize the methanogen population (16S rRNA gene and mcrA libraries), Tymensen et al. (2012) concluded that Methanobrevibacter spp. had a greater abundance in PAM than in free-living methanogens, while the opposite was true for Methanomicrobium spp., and RCC methanogens. However, the methanogenic activity of each individual species is still unclear (Poulsen et al., 2013) as well as the factors which determine the structure of the PAM community.
In this study, it was hypothesized that there could be species-specificity between certain types of methanogens and certain types of protozoa. This hypothesis is based on studies on free-living protozoa which revealed that their methanogenic endosymbionts were similar, but not identical to their free-living relatives, concluding that endosymbionts are specific for the particular host species and not representatives of opportunistic free-living methanogens (Finlay et al., 1994; Embley et al., 2003). This hypothesis relies on the methanogens ‘vertically transmission’ as a result of their redistribution into the daughter protozoa cells during the mitosis (Hackstein, 2010).
To test this hypothesis, the structure of methanogen populations associated with different protozoal groups was investigated. Our results indicated no clear differences in the structure or in the biodiversity indices of PAM associated with different protozoal groups isolated from totally faunated sheep. This indicates that most protozoa share a similar methanogen endosymbiotic population. There are several reports that aquatic ciliates kept in culture tend to lose their endosymbionts, although they can be re-infected by exposure to opportunistic methanogens (Hackstein, 2010). Therefore, our observation suggests that rumen protozoa are constantly re-infected with new methanogens as a result of the engulfment of free-living methanogens associated with bacteria or feed particles, as well as due to the cannibalistic predation of other protozoa cells carrying methanogens. Only methanogen community associated with fraction F80, which was mainly composed by Eudiplodinium maggii, Metadinium medium and Isotricha spp., tended to differ from those associated with other protozoal types, possibly due to particularities of these protozoal species (large cellulolytic entodiniomorphids and large holotrich).
Regarding to the methanogen diversity, in a recent study using a 16S rRNA gene clone library, Tymensen et al. (2012) observed the same number of methanogen OTUs (12) at the species level in free-living and PAM. These authors also observed 13 and 9 methanogens OTUs for free-living and PAM when the mcrA gene was used. Our study, using T-RFLP based on 16S rRNA gene as fingerprinting method, revealed greater methanogen richness (average 22.3 TRFs per restriction enzyme). Although these differences could be due to the different fingerprinting methods used in each study, it seems clear that rumen methanogens represent a more diverse community than initially thought (Poulsen et al., 2013). Most importantly, similar diversity indices were observed for free-living and PAM (22.6 and 22.2 and TRFs, respectively), indicating that both communities share similar species. This observation is in line with previous findings which described a remarkably similar rumen methanogen communities across different ruminant species, diets and defaunation stages, suggesting a common core of ruminal methanogen species and diversity (Ohene-Adjei et al., 2007; Jeyanathan et al., 2011).
Overall our findings indicated that PAM belong to the same genera as free-living methanogens and share similar diversity indices, indicating that rumen protozoa are constantly re-infected with free-living methanogens (Hackstein, 2010). Similarly, dead or inactive protozoa could release endosymbiotic methanogens into the rumen liquid. Despite of this methanogens exchange among both communities, free-living methanogens had a different community structures than observed in PAM communities, possibly as a result of changes in the proportions of the different methanogen species due to a lower O2 pressure and greater H2 availability within the protozoal cells (Williams & Coleman, 1992). Moreover, most rumen protozoa isolated from totally faunated sheep shared a similar methanogen population in terms of structure and diversity, possibly as a result of the cross-feeding among different protozoal types. More research, based on the study of the methanogen genome and transcriptome, is needed to fully understand the structure and activity of this microbial community.
In conclusion, this study revealed that although methanogens do not get accumulated within rumen protozoa in a greater proportion than observed in the rumen as a whole, PAM constitute a methanogen community with many particularities and may play a key role in ruminal methanogenesis. Thus, their elimination from the rumen ecosystem should be considered as a methane mitigation strategy.
Acknowledgements
This work was supported by the Commission of the European Communities (REDNEX project FP7-KBBE-2007-1) and the Welsh Government. Thanks are due to D.R. Yáñez-Ruiz and H.J. Worgan for their collaboration in the animal care.
References
Author notes
Editor: Alfons Stams
Commission of the European Communities
FP7-KBBE-2007-1
Welsh Government
