


Abstract
Bacterial utilization of dissolved organic matter plays an important role in marine carbon cycling. In this study, the response of bacterioplankton to a gradient of carbon (glucose) addition was investigated experimentally in a subtropical coastal environment in the absence of top-down control by viruses and flagellates. Bacterial abundance and production were stimulated by glucose addition corresponding to a gradient of glucose. Differences in the extent of stimulation suggested different bacterial life strategies under different nutrient conditions. Bacterial community diversity as revealed by denaturing gradient gel electrophoresis (DGGE) showed a unimodal productivity–diversity (number of DGGE bands) relationship after 3-day incubation. DNA fingerprinting profiling and cluster analysis showed clear and gradual changes in bacterial community structure along the gradient of glucose concentrations, reflecting the competition for carbon supply among bacterial groups. Sequencing analysis of the DGGE bands disclosed the relative abundance of seven bacterial genotypes in the Alteromonadaceae and Roseovarius that gradually decreased with the glucose enrichment while two Vibrio genotypes showed the reverse increasing trend. This suggested that Vibrio was a more successful opportunist at high carbon availability.
Introduction
Due to their high abundance, great diversity, and fast growth rate, bacterioplankton are a key component in marine plankton food webs and biogeochemical cycles in the ocean (Azam et al., 1983). For example, the crucial role of bacteria in marine carbon cycling is demonstrated in numerous studies (see the reviews of Thingstad & Lignell, 1997; Williams, 2000), and the topic has recently drawn renewed interest during the consideration of the microbial production of recalcitrant dissolved organic matter (RDOM) as long-term carbon storage in the global ocean (Jiao et al., 2010). Two major types of controlling mechanisms of bacteria have been recognized: bottom-up and top-down mechanisms. Bottom-up controlling factors in the ocean include dissolved organic matter (DOM) and inorganic nutrients, while protist grazing and viral lysis are the major top-down controlling factors. In the natural ecosystem, bacteria act as active competitors for DOM. There is competition between bacteria and phytoplankton and among different groups of bacteria for the limited DOM in most areas of the global ocean (e.g. Caron et al., 2000). Nutrient addition experiments reveal that DOM bioreactivity limits bacterial production and growth rate in various marine environments (e.g. Kirchman & Rich, 1997; Kirchman et al., 2000). Furthermore, inorganic nutrients and micronutrients (e.g. iron) affect microbial uptake of DOM (Kirchman et al., 2000; Skoog et al., 2002). Enhanced DOM utilization was observed after the addition of inorganic nutrient, although the effects also depended on the type and extent of nutrient limitation in different marine environments. On the other hand, predation and lysis affect bacterial abundance, production, diversity, and community structure. Therefore, it is expected that predators and viruses will significantly influence the eventual bacterial DOM uptake.
Bacterial mortality due to viral lysis is an important controlling factor in marine environments (Fuhrman, 1999; Wommack & Colwell, 2000; Weinbauer, 2004). Several incubation studies on bacterial communities with and without viruses clearly show the effects of viruses on bacterial abundance, production, and community composition (Winter et al., 2004; Šimek et al., 2007; Zhang et al., 2007; Sandaa et al., 2009). Furthermore, enhanced viral production is reported in nutrient addition treatments in micro- and mesocosm incubation experiments performed in both marine and freshwater environments (Wilson et al., 1998; Weinbauer et al., 2003; Motegi & Nagata, 2007). Thus, viruses should have substantial influence on bacteria in nutrient addition experiments and should not be overlooked. However, viruses were not considered properly in most of the nutrient enrichment studies. For example, the bottom-up effects of nutrients are usually assessed by removing flagellates using filtration to obtain a predator-free treatment (e.g. Cherrier et al., 1996; Rivkin & Anderson, 1997; Carlson et al., 2002). Any viruses remaining in the filtrate could still affect the bacterial assemblage by acting as the top-down controller. Therefore, the results obtained from these studies represent combined the effects of bottom-up factors (e.g. nutrients) and top-down factors (e.g. viruses). Similarly, in most whole water bioassay experiments, virus-induced bacterial mortality is not considered (e.g. Lebaron et al., 1999; Agawin et al., 2004).
Although viruses exist in all kinds of marine environments and bacterial responses to natural or artificial nutrient changes will occur with viruses, it is essential to distinguish the responses of the bacterioplankton itself from those where viruses are present to have a better understanding of the ecological role of each component in marine food webs (e.g. Middelboe & Lyck, 2002). Such information is particularly necessary for modeling studies (e.g. Fuhrman, 1999). So far, little effort has been made to alleviate or eliminate the effects of viruses during incubation to obtain ‘pure’ bacterial responses to nutrient addition (Middelboe & Lyck, 2002). In our study, we developed a bioassay technique with predator-free and virus-reduced bacterial communities using tangential flow filtration (TFF) and dilution and then supplied a gradient of additional dissolved organic carbon (DOC) to investigate the respective bacterial responses in terms of abundance, production, diversity, and community structure. Our study, for the first time, provided information on DOC utilization by bacterial communities in the absence of significant top-down pressure.
Materials and methods
Experimental setup
About 100 L of seawater was collected at Clear Water Bay, Hong Kong (22°17′N, 114°18′E) in an acid-rinsed plastic tank. Samples were prefiltered with 25 μm mesh to remove large zooplankton and particles and stored at 4 °C for < 1 h before the laboratory experiments were started. The seawater temperature and salinity were measured on site. The bacterial population without flagellates and viruses was produced following a protocol described by Zhang et al. (2007). Seawater was filtered with 1.0 μm polycarbonate membrane to remove the flagellate population. About 60 L of this filtrate was filtered through a 100 KDa cutoff polysulfone cartridge (Prep-Scale/TFF; Millipore) to obtain virus-free seawater. The remaining bacteria-containing filtrate was mixed with the virus-free seawater to obtain about a 10% diluted bacterial population compared to that in situ. Sufficient N (NH4NO3) and P (NaH2PO4) were added to give final concentrations in the mixture of 25 and 5 μM, respectively, so as to eliminate any limiting effects. Then, a gradient of carbon concentrations (0–1000 μM) was developed with glucose addition in two parallel experiments as shown in Table 1. In the first one (Batch 1), all glucose concentrates were added at the beginning of the incubation, while in the second one (Batch 2), glucose was added consecutively as 1/3 of the total on each day. The mixtures were incubated in 2-L polycarbonate bottles (Nalgene) at ambient seawater temperature in the dark for 3 days. Subsamples for the determination of bacterial and viral abundance, bacterial production, and nutrient factors were collected every day (for Batch 2, before nutrient addition). After 3 days of incubation, the seawater was filtered using 0.22 μm polycarbonate membranes to obtain the bacterioplankton in the microcosms for community structure analyses.
Set-up of glucose concentration gradient for bacterioplankton in microcosms
| Treatments | C1 | C2 | G1 | G2 | G3 | G4 | G5 | G6 | G7 | G8 | G9 | G10 | G11 | G12 |
| N (μM) | 0 | 25 | 25 | 25 | 25 | 25 | 25 | 25 | 25 | 25 | 25 | 25 | 25 | 25 |
| P (μM) | 0 | 5 | 5 | 5 | 5 | 5 | 5 | 5 | 5 | 5 | 5 | 5 | 5 | 5 |
| C (μM) | 0 | 0 | 1 | 2 | 4 | 6 | 8 | 10 | 20 | 40 | 60 | 80 | 100 | 1000 |
Two batches of incubation were developed in which the N and P addition were same. In the first batch of experiments (Batch 1), glucose was added only at the beginning of the incubation, while in the second batch (Batch 2), glucose was added in equal amounts on Day 0, 1 and 2.
Nutrient analysis
The nitrogen ( and ) and phosphorus () concentrations in the incubations were monitored using a Skalar San++ continuous-flow analyzer (Skalar Analytical B.V., Breda, The Netherlands) following the standard methods: ammonia (USEPA Method 349.0); nitrate and nitrite USEPA (Method 353.4); and orthophosphate (USEPA Method 365.5). During the 3 days of incubation, 50 mL of each of the mixtures was collected every 24 h and stored at 4 °C in darkness until analysis. No filtration was carried out to remove the bacteria as the analysis procedures targeted only the soluble nutrients in the seawater.
Bacterial and viral abundance and bacterial production
Samples for the determination of bacterial abundance were fixed with glutaraldehyde (0.2 μm-pore-size filtered; 2% final concentration) and filtered through black polycarbonate membrane (0.2 μm-pore-size; 25 mm diameter; Millipore). The bacterial cells were stained with 4′,6-diamidino-2-phenylindole (DAPI) in the dark for 10 min before being enumerated under an epifluorescence microscope (Olympus BX41) with blue excitation (485 nm). Viral particles were fixed, stained with SYBR Green I, collected on 0.02 μm-pore-size aluminum oxide filters (25 mm diameter; GE Healthcare), and enumerated following the protocol of Noble & Fuhrman (1998). Bacterial production was measured using [3H] Leucine (PerkinElmer P/N: NET460A005MC) incorporation (Kirchman et al., 1985). Triplicate water samples (1.5 mL) with 40 nM of [3H] Leucine were incubated in the dark for 2 h at ambient temperature. Trichloroacetic acid-killed samples were incubated as the control.
Bacterial community structure
Bacterial genomic DNA was obtained from 0.22 μm polycarbonate membranes using phenol/chloroform extraction, following the protocol of Zhang et al. (2008). Bacterial 16S rRNA genes were amplified with the universal primer set 8F+1492R and then digested with AluI and HaeIII to carry out the terminal restriction fragment length polymorphism (T-RFLP) analysis on a genetic analyzer (GE MegaBACE 500 DNA Analysis System) operated in genotyping mode. Bacterial 16S rRNA gene amplicons produced with universal primer set 341F-GC+907R were separated on a gel with a denaturing gradient of 45–75% [100% denaturant = 7 M urea, 40% (v/v) formamide]. The denaturing gradient gel electrophoresis (DGGE) analysis was performed on a Bio-Rad Protean II system for 18 h at a constant voltage of 125 V and a temperature of 60 °C. Nine selected DGGE bands were sequenced and deposited in the GenBank under the following accession numbers: JX206982–JX206990. Detailed protocols for PCR amplification of the bacterial 16S rRNA gene and DNA fingerprinting analysis can be found in Zhang et al. (2008, 2009).
Results
Bacterial abundance and production
Over the three incubation days, the bacterial abundance in the two controls (C1 and C2), which had no glucose addition, increased slowly and showed the highest numbers on Day 3 (Fig. 1). In Batch 1 (all glucose added at the onset of incubation), bacterial abundance in most treatments increased rapidly at the beginning of incubation, reaching the highest number in Day 1, followed by a general decrease in the following 2 days. However, possibly due to the pulse addition of glucose, the magnitude of abundance increase in Batch 2 was smaller than in Batch 1, and most microcosms showed sustainable or continual increase in bacterial abundance on Day 2 and 3. In both batches, higher glucose addition usually sustained higher numbers of bacterial cells (Fig. 1). During the incubation, microcosms with the four highest glucose additions always showed higher bacterial abundance than lower glucose addition microcosms (see red lines in Fig. 1). In addition, the maximum bacterial abundance which appeared in each microcosm gradually increased with glucose concentration (for C2, G1–G8: y = 2.318x + 79.39, R2 = 0.7666) and remarkably peaked with the 60–100 μM glucose addition (Fig. 2). In the highest glucose treatment (1000 μM), however, the maximum bacterial abundance during incubation was reduced to a similar level as the 40 μM glucose treatment (Fig. 2).
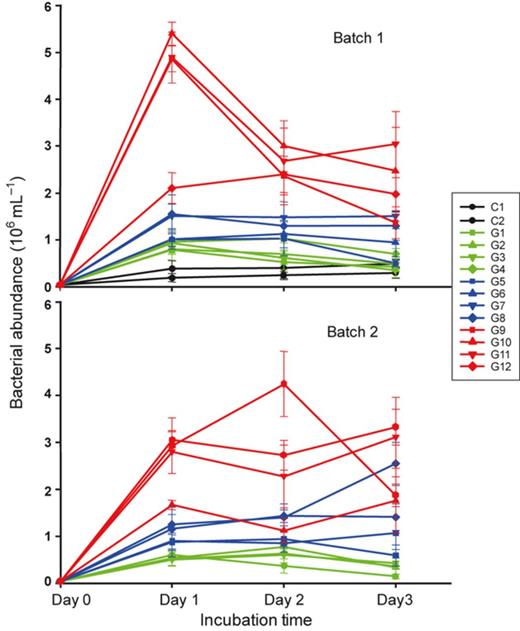
Time course changes of bacterial abundance in a gradient glucose addition experiment during the 3-day incubation. Values are shown as mean ± SD of measurement from replicate sampling of each microcosm. Batch 1: glucose was added only at the beginning of the incubation; Batch 2: glucose was added in equal amounts on Day 0, 1 and 2. C1–2, G1–12: glucose additions (for concentrations see Table 1).
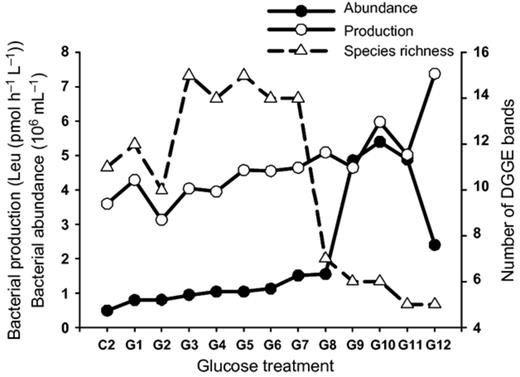
Variations of bacterial community parameters along a glucose concentration gradient. The maximum bacterial abundance and production indicate the highest bacterial biomass accumulation and carbon assimilation rates during the 3-day incubation with different carbon supply. Bacterial species richness is the number of DGGE bands (see Fig. 4 for DGGE patterns). C2, G1–12: glucose additions (for concentrations see Table 1).
Similar to the general pattern in bacterial abundance, the addition of glucose showed stimulating effect on maximum bacterial production in each microcosm during incubation (for C2, G1–G11: y = 1.632x + 401.18; R2 = 0.568; Fig. 2). In addition, the maximum production rate showed a temporal difference between the treatments. Two controls, three low glucose additions (G1–G4), and the highest glucose addition (G12) in Batch 1 showed the highest production rate on Day 1 while other treatments showed a later peak on Day 2 or 3 (Fig. 3). For Batch 2 treatments, only the highest glucose addition significantly peaked on Day 1 while all others peaked on Day 2 or 3.
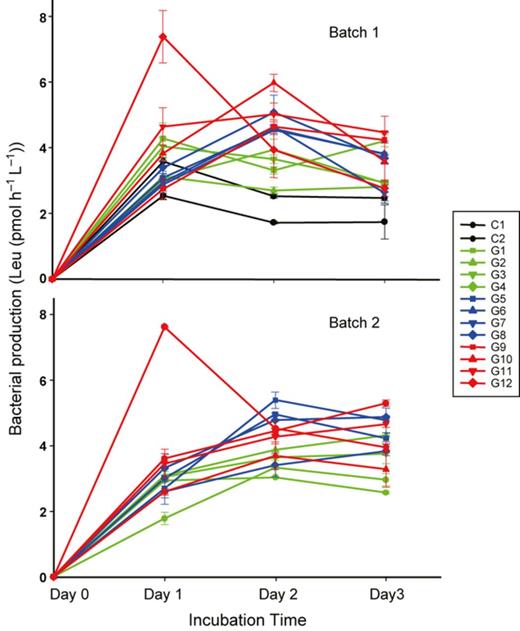
Time course changes of bacterial production to gradient glucose addition during the 3-day incubation. Values are shown as mean ± SD of measurement from replicate sampling of each microcosm. Batch 1: glucose was added only at the beginning of the incubation; Batch 2: glucose was added in equal amounts on Day 0, 1 and 2. C1–2, G1–12: glucose additions (for concentrations see Table 1).
Bacterial species richness and community structure
Bacterial community structure revealed by DGGE showed a gradual change along the concentration gradient of glucose in both batches (Fig. 4). Considering the relatively consistent community structures (as shown by the consistent patterns on both DGGE gels) between the two batches, only Batch 1 was selected for further molecular analysis. This gradual change of bacterial communities revealed by DGGE analysis was further verified using another DNA fingerprinting technique, T-RFLP, with a different PCR primer set (Supporting Information, Fig. S3). In the DGGE analysis, the number of bands varied between 5 and 15 (Figs 2 and 4). Samples of medium glucose (4–20 μM) addition treatments showed a higher number of bands than those with lower (0–2 μM) or higher (40–1000 μM) glucose treatments (Fig. 4). If we defined the term ‘productivity’ as the availability of glucose to a unit biomass of bacteria per unit area and time, our study revealed a unimodal (hump-like) curve in the productivity–diversity relationship for bacterioplankton. Cluster analysis based on the DGGE pattern of Batch 1 indicated a clear glucose-dependent clustering pattern (Fig. 5). The two controls and three low glucose addition (1–4 μM) treatments showed a similar bacterial community structure and formed a unique cluster. Similarly, samples from 6–40 μM glucose addition formed the other group while leaving the four highest concentration treatments in another separate cluster.
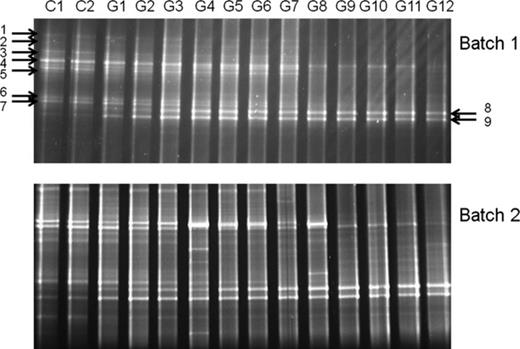
DGGE patterns of bacterioplankton in the two glucose gradient batches at Day 3. Batch 1: glucose was added only at the beginning of the incubation; Batch 2: glucose was added in equal amounts on Day 0, 1 and 3; C1–2, G1–12: glucose additions (for concentrations see Table 1)..DGGE bands chosen for sequencing are indicated by arrows.
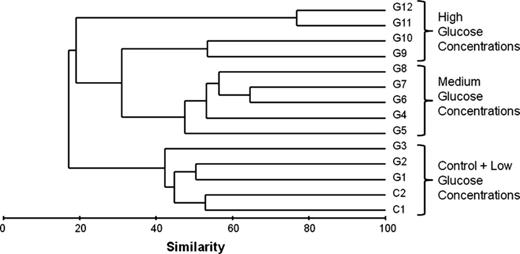
Cluster analysis of bacterial community structure in Batch 1 microcosms revealed by DGGE analysis. C1–2, G1–12: glucose additions (for concentrations see Table 1).
On the DGGE gel, seven major bands (Bands 1–7) clearly showed a gradual decrease in relative intensity, reflecting the decrease in relative abundance of particular bacterial groups, while the other two (Bands 8 and 9) showed a gradual increase. Phylogenetic analysis revealed that five bacterial operational taxonomic units (OTUs) repressed by nutrient addition were from the Gammaproteobacteria (mainly Alteromonadaceae) and two, from the Alphaproteobacteria (Roseovarius spp.). Both OTUs stimulated by the nutrient addition gradient were affiliated into Vibrio spp. (Table 2).
Phylogenetic affiliation of sequenced DGGE bands and their best matches in the GenBank
| DGGE band | Phylogenetic affiliation | Isolation environments of best matches in the GenBank | Identity (%) |
| Repressed by nutrient addition | |||
| 1 | Gammaproteobacteria (family Alteromonadaceae) | Environmental clones from ballast water or incubation enriched by coral mucus | 98 |
| 2 | Gammaproteobacteria (family Alteromonadaceae) | Environmental clones from eutrophic Victoria Harbor or coral near fish farm effluent | 98 |
| 3 | Alphaproteobacteria (genus Roseovarius) | Environmental clones from various coastal environments | 98 |
| 4 | Gammaproteobacteria (family Alteromonadaceae) | Environmental clones from eutrophic Victoria Harbor or coral near fish farm effluent | 98 |
| 5 | Alphaproteobacteria (genus Roseovarius) | Environmental clones from various coastal environments | 98 |
| 6 | Gammaproteobacteria (unclassified) | Environmental clones from eutrophic Victoria Harbor or incubation enriched by DMS | 98 |
| 7 | Gammaproteobacteria (unclassified) | Environmental clones from various coastal environments including eutrophic Victoria Harbor | 99 |
| Stimulated by nutrient addition | |||
| 8 | Gammaproteobacteria (genus Vibrio) | Symbiotic Vibrio clones from various marine organisms | 99 |
| 9 | Gammaproteobacteria (genus Vibrio) | Symbiotic Vibrio clones from various marine organisms | 99 |
Refer to Fig. 4 for the position of DGGE bands.
Discussion
Experimental setup and approach
Generally, bacterioplankton in the two batches of our incubation with different pulses (single pulse vs. three pulses) of glucose addition showed similar responses in terms of abundance, production, and community structure. Therefore, although this study was performed without experimental replicates, the consistency of data from the two batches suggested that our results were reliable (Figs 1, 3 and 4). In our experimental setup, the predators were removed using filtration with 1.0 μm polycarbonate membranes, and flagellates and ciliates were not observed in random inspections using epifluorescence microscopy. Viral abundance in the microcosms was reduced to about 10% of the ambient level and did not increase significantly during the 3-day incubation (Fig. S1). At this dilution, the contact rate between viruses and their hosts is significantly reduced (Murray & Jackson, 1992) and thus, the virus-induced predation pressure on bacteria was likely to be negligible (Weinbauer et al., 2007; Zhang et al., 2007). Therefore, our experimental approach successfully provided a bacterial community without grazing pressure by flagellates and strongly reduced the pressure of viral lysis.
The findings in our study were contradictory with those of previous studies concerning the response of natural bacteria to nutrient addition, which reveal no significant influence of nutrient enrichment on bacterial abundance (Kirchman, 1990; Kirchman & Rich, 1997; Eilers et al., 2000; Kirchman et al., 2000). Although these experiments were performed in various environments with different types and concentrations of nutrients added, a common circumstance was the presence of viruses in their incubation systems. It was demonstrated that viral lysis releases organic and inorganic material and thus supports the growth of noninfected bacteria (Middelboe et al., 1996), a phenomenon which matches the ‘killing the winner’ theory (Thingstad & Lignell, 1997; Wommack & Colwell, 2000). Under this interference of viral lysis, the total bacterial abundance may remain constant or decreases rather than increases with nutrient enrichment. In our study with eliminated lysis effects, the bacterial abundance positively responded to a gradient of glucose addition (Fig. 1) and revealed a pattern that differed from those experiments which had no reduction in viruses (Kirchman, 1990; Kirchman & Rich, 1997; Eilers et al., 2000; Kirchman et al., 2000). Nevertheless, further investigation with both reduced and normal viral population is necessary to elucidate the effects of viruses on the response of bacterioplankton to nutrient manipulation. Furthermore, the presence and absence of viruses could also affect bacterial production. Middelboe & Lyck (2002) note elevated bacterial production in virus reduction treatments as compared with the control normal viral concentration. However, other studies show inconsistent effects of viruses on bacterial production (Middelboe et al., 1996; Noble & Fuhrman, 1999; Weinbauer et al., 2007; Zhang et al., 2007). Similar to the effects of viruses on bacterial abundance, on the one hand, viruses could reduce bacterial production via the lysis of infected cells and, on the other hand, stimulate the other (both infected and noninfected) cells by releasing the nutrients and organic materials from the lysed cells. The balance between these two contributions could result in variable apparent effects of nutrient addition on bacterial production. In addition, it is generally accepted that viruses shape the bacterial community structure by host-specific infection (Wommack & Colwell, 2000; Zhang et al., 2007). Consequently, in an experimental setup with viruses present, changes in bacterial community structure would not be the pure response of the bacterial community to nutrient addition. Thus, using the approach of viral lysis reduction, as applied in our present study, the dynamics of bacterial community structure should reflect only the competition among the bacterial groups.
Bacterial responses to glucose addition without lysis and predation
In our study, extra N and P were added to eliminate the limiting effect of their deficiencies during the 3-day incubation. Nutrient monitoring showed that they were not limited in most of the incubations during the study period (Fig. S2), however, except for two treatments with the highest glucose addition (G12 in both batches of microcosm). The deficiency in N might be a cause of the sharp decrease in the bacterial productions in both G12 microcosms after Day 2 (Fig. 3). Theoretically, the abundance and production in G12 of Batch 2 should be sustainable at a certain level on Day 2 and 3 because a new dose of glucose was added every day to replenish the carbon source. The decrease in production observed in the later days, resembling the trend in G12 of Batch 1, indicated the presence of a limiting factor on growth but this case was due to N deficiency and not carbon. Nonetheless, disregarding these two microcosms, results in the other microcosms were still valid with respect to their sufficient N and P, and a positive response of bacterial abundance toward the carbon gradient was successfully revealed.
In our observations, a higher carbon source stimulated both the maximum [3H] leucine incorporation and the bacterial abundance (Fig. 2). However, the stimulatory effects were different for bacterial production and abundance. The increase in the maximum bacterial abundance in G9–G11 (60–100 μM glucose addition) was distinct, while the increase in maximum bacterial production in the same treatments was moderate (Fig. 2). This suggested that in the relatively carbon-rich situation, bacteria increase their population size (via fast cell dividing) rather than their biomass (via fast carbon incorporation). Bacterial volume in G9–G11 was similar to that in the treatments with low glucose addition (data not shown). However, in the G12 microcosm (1000 μM glucose addition), a contrasting pattern between the maximum bacterial production and abundance was observed (Fig. 2). In addition, bacterial cells in G12 showed the largest volume compared to other treatments (data not shown) and were regarded as bacterial populations with higher protein and DNA content (Lebaron et al., 1999; Eilers et al., 2000). This indicated that when the nutrient supply is far beyond their requirement, the bacterial growth strategy seems to shift to increase their cell size with a high carbon incorporation rate.
There is growing evidence showing that the ecological behaviur of microorganisms is similar to those of macroorganisms. Biogeographical patterns, species–area relationships, and diversity–productivity patterns are confirmed for microbial communities (Bell et al., 2005; Martiny et al., 2006; Smith, 2007). The typical microbial diversity–productivity relationship in aquatic ecosystems includes random/flat, positive, negative, humped, and U-shaped patterns. A meta-analysis study shows that humped diversity–productivity patterns, in which diversity peaked at intermediate productivity levels, account for 15% and 23% of the total diversity–productivity patterns which occurred in experimental and natural systems, respectively (Smith, 2007). It is hypothesized that the narrow range of productivity in available studies should be one of the reasons leading to an observation of a positive or negative diversity–productivity curve, which is only part of a complete unimodal curve (Horner-Devine et al., 2003; Smith, 2007). In our study, the productivity, defined as the concentration of glucose availability, spanned three orders of magnitude, and a clear unimodal humped diversity–productivity curve was observed. In addition, based on the above discussion, it is also possible that in those diversity–productivity investigations within natural environments, top-down effects from viruses disturb the apparent diversity–productivity pattern of the bacterioplankton (Horner-Devine et al., 2003; Smith, 2007). Considering our incubation system with its single trophic level and without spatial scale difference, top-down controlling factor, community assembly history difference, or niche specialization, our observation suggested that species interactions among bacterioplankton generate and maintain a humped diversity–productivity pattern.
The bacterial community structure changed along the glucose gradient indicating that specific bacterial groups had a different efficiency for DOM utilization. Due to their capability of higher growth rate, faster response to nutrients, and better assimilation of carbon sources, some lineages of Gammaproteobacteria are regarded as opportunists and have been repeatedly observed in nutrient addition experiments using both culture-dependent and culture-independent techniques (e.g. Lebaron et al., 1999; Eilers et al., 2000; Massana et al., 2001; Pinhassi & Berman, 2003). Among them, Vibrio and Alteromonas were the most frequently found lineages after incubation, and this was consistent with our results. However, our study further showed that different Gammaproteobacteria lineages responded differently to the glucose addition gradient. In our incubation experiment, Vibrio spp. might have had a stronger ability to use single carbohydrates than Alteromonadaceae spp. as shown by the gradual increase in their relative abundance along the gradient of glucose addition up to 1000 μM (Fig. 3). This could be a reason why they are the bacteria most often isolated in marine environments.
Several studies suggest that the fast growth of opportunists in micro- and mesocosm incubations might result from the experimental setup such as dilution, filtration, and confinement (Ferguson et al., 1984; Eilers et al., 2000; Fuchs et al., 2000). However, our data indicated that these interferences might be negligible compared to those of glucose addition. There was clear difference in the presence and relative abundance of specific OTUs between the controls and the nutrient-added treatments, especially in high glucose additions (Fig. 3). This pattern should be the result of the gradient of nutrient addition rather than experimental confinement.
In summary, using a virus reduction assay, our study investigated the responses of marine bacterioplankton to a large range of DOC (glucose) manipulation. Without the disturbance of top-down factors, bacterioplankton displayed different life strategies under different DOC supply. A glucose concentration-dependent bacterial community change resulted in a clear humped diversity–productivity relationship, which should be due to the bacterial species competition for DOC. In addition, our study highlighted the application of virus reduction technique in microbial ecology studies.
Acknowledgements
We thank Lisa SOO for her help during the experimental setup and sampling. Rui Zhang was supported by NCET project (09-0683) and the Fundamental Research Funds for the Central Universities (2011121012). Prof. John Hodgkiss of The University of Hong Kong is thanked for his assistance with English.
References
Supporting Information
Fig. S2. Time course changes of nutrient concentration during 3-day incubation.
Author notes
Authors' contributionR.Z. and M.G.W. contributed equally to this work.
