


Abstract
Pyrosequencing analysis was performed on soils from Italian chestnut groves to evaluate the diversity of the resident Phytophthora community. Sequences analysed with a custom database discriminated 15 pathogenic Phytophthoras including species common to chestnut soils, while a total of nine species were detected with baiting. The two sites studied differed in Phytophthora diversity and the presence of specific taxa responded to specific ecological traits of the sites. Furthermore, some species not previously recorded were represented by a discrete number of reads; among these species, Phytophthora ramorum was detected at both sites. Pyrosequencing was demonstrated to be a very sensitive technique to describe the Phytophthora community in soil and was able to detect species not easy to be isolated from soil with standard baiting techniques. In particular, pyrosequencing is an highly efficient tool for investigating the colonization of new environments by alien species, and for ecological and adaptive studies coupled with biological detection methods. This study represents the first application of pyrosequencing for describing Phytophthoras in environmental soil samples.
Introduction
European Fagaceae forests host a rich community of Phytophthoras; more than 20 different species have been isolated and described (Jung et al., 1996; Hansen & Delatour, 1999; Vettraino et al., 2002, 2005; Brasier et al., 2004, 2005; Jung, 2009), most of which are recognized as invasive pathogens seriously impacting trees in plantations, natural areas and nurseries (Santini et al., 2013). For example, Phytophthora quercina and Phytophthora cinnamomi are aggressive to oak species in continental Europe (Jung et al., 1996, 1999) and Iberia (Brasier et al., 1993); P. cinnamomi and Phytophthora cambivora are the primary cause of ink disease of sweet chestnut (Castanea sativa Mill.) (Vannini & Vettraino, 2011). Phytophthora cambivora, Phytophthora cactorum, Phytophthora pseudosyringae and Phytophthora plurivora are associated with European beech (Fagus sylvatica L.) decline (Cacciola et al., 2005; Hartmann et al., 2006; Jung, 2009). Most recently, the invasive species Phytophthora ramorum and Phytophthora kernoviae have been found to be widespread in UK forests, causing foliar and stem symptoms on Fagaceae including beech, chestnut and oaks (Brasier et al., 2004, 2005; Denman et al., 2005, 2009).
However, these Phytophthora species proven to be pathogenic to the Fagaceae, do not represent the complex of Phytophthora species potentially present in the forest habitat (Cooke et al., 2007).
Therefore, an accurate description of the Phytophthora community is of ecological and epidemiological relevance. In the last 10 years, several historical and new Phytophthora species, whose ecological role is still not clear have been detected, in Fagaceae forests (Jung et al., 1996; Hansen & Delatour, 1999; Vettraino et al., 2002, 2005; Brasier et al., 2004, 2005; Jung, 2009). Furthermore, due to the mobility of the Phytopthora propagules in water and soil, other Phytophthora species can be easily introduced; among these are putative invasive species. Considering that Phytophthora species specialize in infecting living plant tissues, it is important to have a realistic measure of the relative risk posed by the presence of a particular species (or combination of species) in a given habitat (Cooke et al., 2007). The Phytophthora complex in Fagaceae forests in Europe has been described by classical biological detection, that is baiting. This method uses biological baits (i.e. host leaves, flowers, fruits) to ‘capture’ mobile zoospores of Phytophthora species in water. Once infected by zoospores, baits are cultured on selective media to isolate the pathogen in pure culture (Erwin & Ribeiro 1996). This technique has a high specificity but low sensitivity, with a high risk of false negative results. The efficiency of baiting is affected by seasonality, type and abundance of inoculum in the substrate, as well as the type of baits used to ‘capture’ the inoculum. Davidson & Tay (2005) estimated that about 300 baiting samples are required to minimize false negatives and, if all negative, determine a suspected dieback site free of Phytophthora spp. These limitations pose doubts about the ability of the technique to provide a realistic picture of the Phytophthora community established in a location.
Next-generation sequencing (NGS) technologies offer the opportunity to obviate most of the limitations of biological detection. Specifically, the pyrosequencing assay (PA) is a flexible technique producing millions of sequences per run, without requiring cloning procedures and allowing the simultaneous processing of several samples, each specifically tagged (Binladen et al., 2007). Although affected by some biases, specifically an expected rate of sequencing errors potentially producing false positives (Huse et al., 2007), the high sensitivity renders PA an interesting technology for epidemiological studies when describing target communities of plant pathogens. This is especially true for environmental samples with rare taxa or undescribed taxa. Recently, PA has been used on a DNA mix of eight Phytophthora spp. and Phytopythium vexans to evaluate its accuracy in describing Phytophthora communities in terms of taxa identification and risk of assignment of false operational taxonomic units (OTUs; Vettraino et al., 2012). However, PA has not yet been used to describe Oomycota communities in environmental samples including soil.
The aim of this study was to couple classical biological detection with an NGS approach to (1) evaluate the efficacy of PA in terms of specificity and sensitivity of detection, and its routine application in epidemiological studies of invasive pathogens; (2) describe and discuss the Phytophthora community in chestnut soils; and (3) investigate the possible presence of species undetectable with classical biological methods. To achieve these objectives, repeated soil samplings were carried out in two sweet chestnut (C. sativa) areas in Central Italy previously known to be affected by soil-borne Phytophthora species (Vettraino et al., 2001, 2005).
Materials and methods
Forest areas
Studies were carried out in one of the largest chestnut areas in Central Italy in the Latium region. Chestnut forests in the Latium region extend for c. 56 443 ha in the Pre-Apennines and Apennines Mountains at an altitude ranging from c. 300 to 900 m above sea level (asl). The chestnut area includes both productive orchards and forests. Climate is generally characterized by hot dry summers and cold winters with frequent freezing temperatures, especially at the highest altitudes. Chestnut occupies an intermediate vegetation layer between oak, at lower altitudes, and beech at higher altitudes. Most of the chestnut area is moderately anthropized, characterized by the presence of several small villages with a rural attitude. Additional cultivation includes hazelnut, walnut, grape, apple, horticulture and ornamentals. Two ink disease sites were investigated: site A (42°12′26″N, 13°8′49″E) is a productive orchard of c. 1.5 ha, at 840 m asl, with a southwest slope and situated beside the village of Leofreni in the Rieti province. It is characterized by 153 chestnut trees more than 100 years old surrounded by chestnut and oak forests, and cultivated crops; site B (42°19′57″N, 12°15′55″E) is a productive orchard of c. 5 ha, with 192 chestnut trees more than 100 years old mixed with hazelnuts, at 410 m asl, with a southwest slope and close to the village of Carbognano in the Viterbo province. The orchard is surrounded by hazelnuts and other cultivated crops. Additional characteristics of the two sites are reported in Table 1.
Site and climatic characteristics of the two chestnut areas investigated
Xerothermic index = Σ(TM − P), if P < 2 TM; where TM is the monthly mean temperature expressed in °C, and P is the precipitation of the month expressed in mm.
Site and climatic characteristics of the two chestnut areas investigated
Xerothermic index = Σ(TM − P), if P < 2 TM; where TM is the monthly mean temperature expressed in °C, and P is the precipitation of the month expressed in mm.
In 2011, a survey was carried out in sites A and B to look for foliar symptoms of P. ramorum on chestnut and understory species following the description of symptoms reported by Denman et al. (2005). Suspect foliar symptoms were tested for Phytophthora infection onsite by Pocket Diagnostic® serological tests (Forsite Diagnostics Ltd, York, UK) following the manufacturer's instructions.
Soil samplings
Soil samples were collected at the base of 54 and 25 adult trees in site A and site B, respectively. Six samplings, one every other month, were carried out at each site (a total of 474 soil samples, corresponding to 79 soil samples per sampling date), from September 2009 through July 2010. Each sample comprised four bulked subsamples, collected from the top 10–20 cm of soil at a distance of about 50 cm from the collar (Vettraino et al., 2005). More details on experimental design are included in the Supporting Information. Soil samples were processed by baiting. Ten soil samples collected in July 2010, five in each of the two sites (1-5A and 1-5B), were used for PA.
Baiting
Samples were processed within 24 h after collection. Soil samples (200 g) were baited using Rhododendron spp. leaves and larch needles as baits (Brasier & Webber, 2010). Baits developing visible necrosis were plated directly on PARPH selective medium (Jeffers & Martin, 1986). Phytophthora colonies emerging from baits were subcultured on Carrot-agar (Brasier, 1972). Colonies were identified on the basis of their morphological traits (Erwin & Ribeiro, 1996). Identification was confirmed by sequencing the ITS region of rDNA, amplified according to Cooke et al. (2000) and comparing the sequences with those of Phytophthora species present in the NCBI database (http://www.ncbi.nlm.nih.gov/Blast.cgi).
PA of DNA from soil samples
PA was performed from DNAs of 10 soil samples collected in July 2010 as described above. Soil codes were 1A to 5A (site A) and 1B to 5B (site B). Each sample was thoroughly mixed and total DNA was extracted from 5 g of soil using the Nucleospin Plant II kit (Machery Nagel, Düren, Germany; the kit allows a maximum of 5 g of soil to be processed). The variable internal transcribed spacer 1 (ITS1) was amplified as recommended for the tag-encoded 454 GS-FLX amplicon pyrosequencing method (Acosta-Martinez et al., 2008). Primer pairs used were the oomycetes-specific ITS6 (5′-AxxxGAAGGTGAAGTCGTAACAAGG-3′) and ITS7 (5′-BxxxAGCGTTCTTCATCGATGTGC-3′; Cooke et al., 2000) where A and B represent the two pyrosequencing adaptors (CGTATCGCCTCCCTCGCGCCATCAG and CTATGCGCCTTGCCAGCCCGCTCAG) and xxx represents the TAGs. One TAG for each soil sample was used for a total of 10.
Template DNA (10 ng) was PCR-amplified in a 25-μL reaction containing 1 × Illustra Hot Start Master Mix (GE Healthcare, Bucks, UK), and each primer at a concentration of 0.4 μM. Positive (genomic DNA of Phytophthora spp.) and negative (water) controls were included in the PCR reactions. Initial denaturation at 94 °C for 2 min was followed by 35 cycles consisting of denaturation for 1 min at 94 °C, annealing at 55 °C for 30 s and extension at 72 °C for 1 min, followed by 10 min at 72 °C. Amplicons were purified using the Agencourt AMPure XP system (Beckman Coulter Inc., Milan, Italy), and quantified with Qubit Quantitation Kit (Invitrogen). At least 10 amplifications per sample were carried out and the clean PCR products pooled. PCR products were sequenced in 1/16 of a standard PicoTiter Plate with the 454 LifeSciences GS FLX System (Macrogen, Seoul, Korea).
Specific detection of P. ramorum
To confirm the detection of P. ramorum by PA, the DNA of the 10 soil samples, 1-5A and 1-5B, and of 10 additional samples collected from the same coordinates in July 2011, were analysed with a species-specific PCR approach. The primer-set Phyto1/4 (Hayden et al., 2004) was used in a nested design after total DNA amplification with generic ITS1/4 primer set (White et al., 1990). The P. ramorum ras-related Ypt-1 gene region was amplified with the primer set Yram1F/Yram2R (Schena et al., 2008). To test for external contamination with P. ramorum, negative controls were always included in each analysis. In the case of the nested PCR with ITS1/4 and Phyto1/4 primer sets, the negative control in the first amplification (NCF) was represented by the reaction mixture with ITS1/4 primer set and water as template. The negative controls in the second amplification were represented by (1) a reaction mixture with Phyto1/4 and water as template; and (2) a reaction mixture with Phyto1/4 and NCF amplification product as template. The positive control, that is DNA of P. ramorum (isolate P1577; Germany; European A1 from Rhododendron catawbiense), was included only in a separate replication of the amplification to avoid the remote risk of cross-contamination. Amplicons were sequenced (Macrogen) and the basic local alignment search tool (blast, http://www.ncbi.nlm.nih.gov/) was used for sequence similarity searches. As an additional precaution, soil samples collected in 2010 were processed as described above in a independent laboratory (IL) of microbiology where no Phytophthora cultures or DNA had ever been manipulated. New labware (e.g. mortars, vials), DNA extraction and amplification reagents were used. DNA amplification and PCR product electrophoresis were carried out as above described at the IL. Amplicons of the expected size were sent directly to sequence.
Data analysis
Raw data were obtained by genome sequencer flx system software v2.3 (Roche, Milan, Italy); TAG sorting was carried out by sff tools v2.3 (part of the genome sequencer flx system software). To minimize the effects of sequencing errors (Sogin et al., 2006; Kunin et al., 2010; Vettraino et al., 2012), all reads < 150 bp in length and with ambiguous nucleotides, were removed from the dataset using the clc genomic workbench (CLC bio Italy, Vicenza, Italy).
To identify OTUs, the reads were compared with a non-redundant-custom-curated database (CCD) derived from GenBank and our own reference database, for a total of 1691 sequences addressing 220 Pythiaceae species (Pythium and Phytophthora), using clc genomic workbench. The 98% barcoding threshold was assumed to assign sequences to OTUs (Vettraino et al., 2012). The overall OTU richness (S) was calculated by summing the number of OTUs of each sample, including singletons. Simpson's dominance () and Shannon's diversity (H = −Σpiln(pi)) were calculated for each sample, where pi is the frequency of occurrence of each OTU. Buzas and Gibson's evenness (E) was calculated using the formula eH/S (0 < E ≤ 1) where e is the natural logarithm base. To explore organismal coverage between the chestnut areas, species accumulation (rarefaction) curves and extrapolative richness estimators were generated using estimates (version 8; Colwell, 2006). Non-metric multidimensional scaling (NMDS) was carried out with systat 12 (Systat Software, Chicago, IL) using Bray–Curtis as similarity measure. All the statistical analyses for characterization of the Phytophthora soil community were carried out with the prism4 package (GraphPad Software Inc., San Diego, CA). Data that did not follow a Gaussian distribution were analysed with the non-parametric Kruskal–Wallis test and Dunn's multiple comparison post-test.
Results
Phytophthora community isolated by baiting technique
Nine Phytophthora species were baited and identified from soil samples collected in the two chestnut sites A and B during the six seasonal samplings in 2009–2010. Phytophthora plurivora was the most represented species in both site A (68%) and site B (97%) (Fig. 1a and b). Five Phytophthora species (P. cactorum, P. cambivora, P. cryptogea, P. gonapodyides, P. plurivora) were common to the two sites. Phytophthora nicotianae and P. pseudosyringae were recovered only in site B, and P. megasperma and P. syringae were detected only in site A (Fig. 1a and b). Specifically, four species, P. cactorum, P. cambivora, P. plurivora and P. pseudosyringae were isolated by baiting from the 10 soil samples analysed by PAs in 2010. Three species, P. megasperma, P. cryptogea and P. syringae, were recovered from one of six samplings. Phytophthora plurivora was detected at each sampling date in both sites. Phytophthora cinnamomi was obtained as a single isolate from a soil sample collected under a chestnut tree outside of site B.
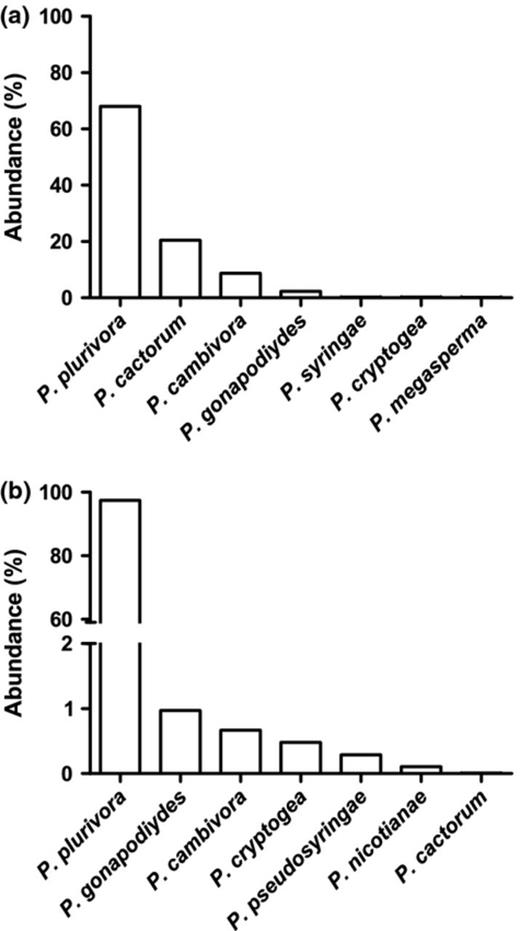
Abundance of Phytophthora species in sites (a) and (b) obtained by biological detection with baiting of soil samples collected during six sample dates in 2009–2010.
PA of chestnut soil samples
A total of 11 637 (6171 and 5466 in sites A and B, respectively) reads passed the quality control with the number of reads per sample ranging from 294 to 1727. A total of 10 057 (86.4%) (4990 and 5067 in sites A and B, respectively) matched the CCD on the basis of the 98% identity criterion. The number of unmatched reads accounted for 1181 (24.5%) and 399 (7.9%) in sites A and B, respectively, for a total of 1580 (13.9%). Of these unmatched reads, 335 (28.4%) and 350 (87.7%) (sites A and B, respectively) showed identity and/or coverage with oomycetes at values lower than 98% and 75%, respectively. Most unmatched oomycetes were singletons, but in two cases, 12 reads from sample 1A and 32 from sample 3A grouped for sequence identity (98% identity and 75% coverage barcoding threshold). The consensus sequences of these two groups, matched rDNA sequences of Pythium canariense (HQ643482 and AY065618) but at a low identity value (94%), which may indicate undescribed taxa. A total of 9167 reads were assigned to 15 known Phytophthora species and 890 reads were assigned to 18 OTUs of known Pythium spp. (a detailed description of Pythium species is not part of this paper; Table 2). A plot of OTUs vs. the number of reads resulted in rarefaction curves that approached a plateau, suggesting that the number of reads was sufficient to describe the resident population (Fig. 2).
Number of reads per soil sample attributed to Phytophthora species and Phytium in the two chestnut sites A (Rieti) and B (Carbognano)
Number of reads per soil sample attributed to Phytophthora species and Phytium in the two chestnut sites A (Rieti) and B (Carbognano)

Rarefaction curves of number of reads vs. number of OTUs for site (A) (○) and (B) (●). Curves generated using estimates.
The Phytophthora community was characterized by 15 species with a predominance of P. plurivora (45%) in all soil samples at both sites (Fig. 3a and b). A total of 13 Phytophthora species were common to both chestnut sites (Fig. 3a and b) and the richness of species per soil sample ranged between 12 (sample 3, site B) and 14. A total of 24 reads (0.6%) were assigned to P. quercina in four of five soil samples in site A. Phytophthora katsurae was present as a singleton in one soil sample in site B (Table 2). Phytophthora ramorum was detected by PA in all soil samples in sites A and B with a total number of reads per site of 253 (6.1%) and 65 (1.3%), respectively (Table 2, Fig. 3). The two sites differed in terms of biodiversity indices (Mann–Whitney test; nonparametric; some datasets did not pass the KS normality test; Fig. 4) and abundance of single species (Fig. 5).

Abundance of Phytophthora species in sites (a) and (b) as obtained by PA soil samples collected in July 2010.

Values of the diversity indices Simpson dominance, Shannon diversity and Eveness of samples in site (A) (○) and (B) (●). Different letters indicate significant differences with the Mann–Whitney test at P ≤ 0.01.
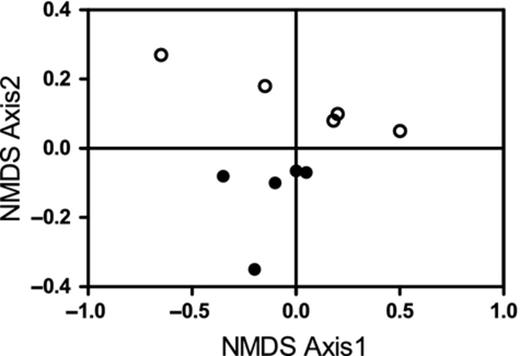
NMDS analysis based on abundance of each Phytophthora species in soil samples in site (A) (○) and (B) (●), determined by PA. Analysis was carried out using Bray–Curtis distance measure; stress value 0.15.
PA vs. baiting technique
Of the 15 Phytophthora species detected by PA, nine were isolated by baiting in the two chestnut sites during the 2009–2010 surveys (Table 3). PAs confirmed the presence of P. cactorum, P. cambivora, P. cryptogea, P. gonapodyides, P. plurivora in both chestnut sites; P. megasperma and P. syringae in site A; and P. cinnamomi, P. pseudosyringae in site B. One species, P. nicotianae, was detected only by baiting, whereas P. ramorum and Phytophthora capsici were detected by PA but not by baiting.
Comparison of the detection of Phytophthora spp. with baiting and PA in the two sites investigated
Detected by baiting outside site B.
Detected by PA as a singleton.
Comparison of the detection of Phytophthora spp. with baiting and PA in the two sites investigated
Detected by baiting outside site B.
Detected by PA as a singleton.
Baiting of soil samples 1-5A and 1-5B resulted in the isolation of four species (P. cactorum, P. cambivora, P. plurivora and P. pseudosyringae) of the 15 detected by PA from the same sample. Differences in diversity indices among Phytophthora communities detected by PA and baiting in July 2010 soil samples (1-5A and 1-5B), and baiting of soil samples collected during the 2009–2010 surveys were consistent at the Kruskal–Wallis tests (nonparametric; some datasets did not pass the KS normality test; Table 4).
Comparison of diversity indices of the Phytophthora community based on PA and baiting of 10 soil samples collected in July 2010, and 474 soil samples obtained from six samplings carried out in 2009–2010
| Soil samples July 2010 (10) | Soil samples 2009–2010 (474) | ||
| Diversity index | PA | Baiting | Baiting |
| Simpson's dominance | 0.25a | 0.70b | 0.56b |
| Shannon diversity | 1.86a | 0.64b | 0.80c |
| Evenness | 0.43a | 0.19b | 0.56b |
| Soil samples July 2010 (10) | Soil samples 2009–2010 (474) | ||
| Diversity index | PA | Baiting | Baiting |
| Simpson's dominance | 0.25a | 0.70b | 0.56b |
| Shannon diversity | 1.86a | 0.64b | 0.80c |
| Evenness | 0.43a | 0.19b | 0.56b |
Data were analysed with the Kruskal–Wallis test. Different letters along rows indicate significant differences with the Dunn's multiple comparison tests.
Phytophthora ramorum detection
Detection with both specific primer sets at the reference and independent laboratories confirmed the presence of P. ramorum in all soil samples collected in July 2010 and used for PA (1-5A and 1-5B), and in one soil sample collected in 2011. Sequences of the Phyto1/4 amplicons showed 100% identity to the P. ramorum sequences in the NCBI database (GenBank accession no. GU258659), confirming that no cross-reactivity with other Phytophthora species had occurred. No amplification products were obtained from any of the negative controls. Two of the uncultured P. ramorum sequences were deposited in the NCBI database under the codes JQ308208 and JQ308209. Phytophthora ramorum was never isolated by baiting. No foliar symptoms resembling those caused by P. ramorum on chestnut or other hosts have been observed on plants in the two sites. Furthermore, no positives results were obtained from serological tests carried out on necrotic leaves to check for Phytophthora spp. infection.
Discussion
To our knowledge this study represents the first application of PA for describing Phytophthora communities in environmental samples. The use of PA opens new perspectives in diagnostic applications and also for issues related to the movement of alien species into new environments or along pathways of introduction.
Internal transcribed spacer sequences of rDNA are often used as targets for PA analyses, being the most abundant sequences available via online databases for eukaryotic organisms such as true fungi and oomycetes. However, at the moment, there are difficulties using PA for diagnostic purposes for true fungi (Tedersoo et al., 2010). The reference sequences found with online databases cover only a part of the whole body of known species, making the detection of unknown species difficult. In contrast to the true fungi, most, if not all, of the known Phytophthora species can be found in online databases with one or more barcoding sequences, the most abundant of which are the rDNA sequences. The relatively small number of described species (c. 110) allows the development of non-redundant databases, which are essential to limit misinterpretations and help with the identification of new potential taxa (Vettraino et al., 2012). In the present study, potentially novel Phytophthora taxa were not detected, but two suspected new Pythium taxa were obtained as distinct OTUs.
The results of rarefaction curves indicate that PA of a small amount of soil (5 g) from a relatively low number of random samples was efficient in describing the resident Phytophthora community in this study. The PA method was found to be far more sensitive than biological detection. In fact, baiting of soil samples used for PA detected only four species of Phytophthora of 15 detected by PA. More species (n = 9) were isolated only when baiting assays were used on a larger number of samples (n = 79) and through multiple seasons. It is well known that baiting assays are affected by different biases, increasing the risk of false negative results. Success of isolation with baiting depends on several variables, including the level of inoculum (Eden et al., 2000), the time of sampling, the type of baits and media used, and the presence of inhibitors in soil (Tsao, 1983). For instance, three of the Phytophthora species detected only by PA are not easy recovered by baiting of soil with the standard method employed; P. capsici is detectable using baits from horticulture hosts (i.e. cucumber, eggplants; Gevens et al., 2007; Wang et al., 2009); P. ramorum is known to be difficult to bait from natural infested soils even with Rhododendron leaves (Fichtner et al., 2007); and P. quercina is efficiently baited only with young Quercus robur leaflets (Nechwatal et al., 2001). Looking at diversity index values, it is clear that molecular detection captures more diversity. In this study, PA-based detection resulted in a higher Shannon index and lower Simpson's dominance values compared with baiting. These are interesting results that should be taken into account when choosing methods to describe Phytophthora communities in environmental samples. In particular, PA is highly efficient for investigating the colonization of new environments by alien species, and it should be coupled with biological detection methods for ecological and adaptive studies.
Phytophthora communities at both sites, although similar in species composition (13 shared species of 15 detected) were different in terms of presence and abundance of species. Ecologically, the two sites differ in terms of climate and site factors. Site A is located in a typical forest area characterized by the presence of other tree species including oak, whereas site B is surrounded by agricultural fields and fruit orchards. The vicinity of site A to oak forests probably explains the detection of P. quercina. This species is highly specific to oaks, on which it causes gradual root damage and decline (Jung et al., 1999). The higher abundance of P. pseudosyringae in site A than in site B, recently recorded on chestnut by Scanu et al. (2010), can also be explained by ecology, as it is considered a typical species of the forest (Jung et al., 2003).
This study also represents the first record, albeit uncultured, of Phytophthora katsurae and P. ramorum in natural environments, specifically chestnut groves, in Italy. Phytophthora katsurae causes ink disease of Asiatic species of chestnut (Uchida, 1967; Lee et al., 2009); Asiatic species and their hybrids can be found in Italian nurseries and as isolated trees in the area. Phytophthora katsurae was detected as a singleton and for this reason the identification should be treated with extreme caution (Tedersoo et al., 2010). Phytophthora ramorum was previously isolated from Rhododendron sp. in a nursery in North Italy (Gullino et al., 2003). Natural infections on sweet chestnut foliage have been recorded in the UK only (Denman et al., 2005; Webber et al., 2010). In the present study, the detection of P. ramorum in chestnut soils was confirmed at one reference and one independent laboratory, by PCR analyses of total soil DNA in 2 consecutive years, using specific primer sets addressing two different genomic target sequences, one ribosomal and the other ras-related gene.
However, the uncultured detection from the DNA template does not provide any information on the vitality of the inoculum and its adaptation to the investigated environments and the isolation of pure culture is required as definitive proof of introduction of these two species.
The pathogenic nature of several Phytophthora species important for crops and trees worldwide has drawn the attention of the scientific community to focus research activities on different aspects of the diseases these species are causing. There is growing evidence of a rich soil-borne community of Phytophthora species in forests and natural areas of Europe but the ecological relationships of these species and the pathogenic interactions is not well understood.
Looking at chestnut forests, P. cambivora and P. cinnamomi are recognized as primarily responsible for the devastating decline and mortality of the dominant species in the habitat (Vannini & Vettraino, 2011). However, these species are only a small fraction of the Phytophthora biodiversity in chestnut groves, where a large number of additional species is present; some of them, that is P. plurivora, are by far more abundant. The latter is widely present in all Fagaceae habitats (Vettraino et al., 2002, 2005), although its pathogenic activity is evident only in beech forests, where it causes extensive decline of adult trees (Jung, 2009). The role of P. plurivora in other Fagaceae habitats, that is oak and chestnut forests, remains an open question. Its abundance suggests an adaptation and naturalization in chestnut soils where it might have a role, with other Phytophthora species, that is P. gonapodyides, in fine root turnover dynamics (Wells et al., 2002; Delatour, 2003; Cooke et al., 2007), plant debris degradation (Brasier et al., 2003; Cooke et al., 2007) and selection of seedling progenies or tree senescence. Other species can transiently contribute to the diversity of soilborne Phytophthoras in forests as inoculum introduced from time to time with the transport of infested soil and running surface water from neighbouring habitats. In definitive Fagaceae ecosystems, in general forests, are particularly permeable to soil-borne Phytophthora invasion due both to the wide host range of most Phytophthora species and their inoculum mobility across different habitats. Inoculum movement is particularly alarming in a global climatic change scenario that forecasts an increase in climatic anomalies, that is intense flooding and droughts, and changes in temperature regimes (IPCC, 2007). Changing climate is likely to modify the disease triangle and there is then the risk that some species, even those under-represented groups, could increase their relative presence and/or aggressiveness to old or new hosts (Jung et al., 2000; Vettraino et al., 2005; Desprez-Loustau et al. 2007; Pautasso et al., 2012). With this perspective, the detection and description of the soil-borne Phytophthora community at fine scale resolution gains importance, facilitating the elaboration of specific pest-risk analysis for the invaded habitats. In conclusion, the results presented in this study suggest, once again, how an advance in technology can provide tools to help describe complexity at a smaller scale and then, in the specific case, new perspectives in the approach to plant pathogen ecology and epidemiology, and support for management strategies.
Acknowledgements
This research was made possible by funding from the European Union Seventh Framework Programme FP7 2007-2013 (KBBE 2009-3) under grant agreement 245268 – Increasing Sustainability of European Forests (ISEFOR): Modelling for Security Against Invasive Pests and Pathogens under Climate Changes and the project MURST–COFIN 2008 ‘Emerging diseases caused by soil-borne pathogens: molecular monitoring of nurseries of ornamental plants and control strategies’.
References
Supporting Information
Table S1. Experimental design.
