


Abstract
Aerobic anoxygenic phototrophic (AAP) bacteria are found in a range of aquatic and terrestrial environments, potentially playing unique roles in biogeochemical cycles. Although known to occur in the Arctic Ocean, their ecology and the factors that govern their community structure and distribution in this extreme environment are poorly understood. Here, we examined summer AAP abundance and diversity in the North East Pacific and the Arctic Ocean with emphasis on the southern Beaufort Sea. AAP bacteria comprised up to 10 and 14% of the prokaryotic community in the bottom nepheloid layer and surface waters of the Mackenzie plume, respectively. However, relative AAP abundances were low in offshore waters. Environmental pufM clone libraries revealed that AAP bacteria in the Alphaproteobacteria and Betaproteobacteria classes dominated in offshore and in river-influenced surface waters, respectively. The most frequent AAP group was a new uncultivated betaproteobacterial clade whose abundance decreased along the salinity gradient of the Mackenzie plume even though its photosynthetic genes were actively expressed in offshore waters. Our data indicate that AAP bacterial assemblages represented a mixture of freshwater and marine taxa mostly restricted to the Arctic Ocean and highlight the substantial influence of riverine inputs on their distribution in coastal environments.

Introduction
Aerobic anoxygenic phototrophic (AAP) bacteria are photoheterotrophs that require oxygen for their growth and for bacteriochlorophyll a (Bchl a) synthesis. They inhabit a wide variety of illuminated habitats in diverse terrestrial, freshwater, and marine environments (Béjà et al., 2002; Csotonyi et al., 2010; Atamna-Ismaeel et al., 2012). First discovered in coastal marine waters (Shiba et al., 1979), AAP bacteria have been intensively studied in the marine environment (Cottrell et al., 2006; Mašín et al., 2006; Lehours et al., 2010). Their abundance and distribution vary greatly among oceanic regimes, suggesting that there is a broad range of potential ecological niches for these microorganisms. AAP bacteria seem to be more abundant in shelf and coastal areas than in the open ocean (Schwalbach & Fuhrman, 2005; Sieracki et al., 2006). Although their abundance can be high in some oligotrophic regions (Lami et al., 2007), AAP bacteria typically constitute a small percentage (2–4%) of total prokaryotes in oceanic environments (Cottrell et al., 2006; Jiao et al., 2007). However, their proportions can exceed 10% in eutrophic estuaries (Waidner & Kirchman, 2007). Despite the lower abundances in most oligotrophic pelagic marine environments, AAP bacteria constitute a very dynamic part of the bacterial community and potentially contribute significantly to the cycling of organic carbon in the upper ocean (Koblížek et al., 2007). Culture-dependent and -independent studies have shown AAP bacteria to be genetically diverse with members of the Alpha-, Beta-, and Gammaproteobacteria (Béjà et al., 2002; Yutin et al., 2007; Jeanthon et al., 2011). The environmental factors controlling the population structure and diversity of these photoheterotrophic bacteria remain poorly understood.
Arctic marine ecosystems are characterized by strong seasonality in incident light, ice cover, temperature, and river discharge which affect salinity and other biogeochemical properties. In the Beaufort Sea, the Mackenzie River delivers considerable freshwater, nutrients, and organic matter which exert strong controls on the productivity, salinity, and water circulation (Aagaard & Carmack, 1989; Opsahl et al., 1999). Despite a short growing season and extensive sea ice coverage, the most river-influenced of the world's oceans supports a productive aquatic ecosystem. Recent studies over the Mackenzie Shelf in the Beaufort Sea have revealed diverse and active communities of Bacteria and Archaea that vary across salinity gradients (Galand et al., 2006, 2008; Garneau et al., 2006).
Our current knowledge of the abundance, distribution, and activity of AAP bacteria in perennially cold marine waters is still limited. In the only study in the Arctic, AAP bacteria contributed 5–8% of the total prokaryotic community in spatially close coastal sites of the western Beaufort and eastern Chukchi Seas (Cottrell & Kirchman, 2009). Seasonal shifts in the abundance of AAP bacteria between summer and winter paralleled changes in the abundance of the total prokaryotic community. There were no substantial shifts in the community structure of AAP bacteria between the two seasons. Although pufM genes in Arctic surface waters could be assigned to taxonomic groups previously identified in metagenomic shotgun sequences from the GOS expedition (Yutin et al., 2007), their sequences were distinct from those retrieved in lower latitude waters (Cottrell & Kirchman, 2009).
In this study, we collected samples across a several-thousand kilometers transect above the 60°N latitude that yielded an unprecedented resolution of the Beaufort Sea during summer and explored transition zones between offshore and large Arctic rivers that have a major influence on coastal ocean biogeochemistry. To examine the AAP bacterial community structure and factors that govern it, we combined the use of infrared epifluorescence microscopy and culture-dependent and -independent approaches. The Beaufort Shelf surface circulation is strongly influenced by ice, winds, and freshwater input resulting from river discharge and sea ice melt. We hypothesized that AAP bacterial abundance and composition would change substantially along this transect and that riverine inputs would have a substantial influence on the AAP bacterial populations.
Materials and methods
Study area, sampling, and oceanographic parameters
The MALINA cruise took place onboard the Canadian research icebreaker CCGS Amundsen during summer 2009 from Victoria (BC, Canada) to the Beaufort Sea (Leg 1b) and then throughout the Beaufort Sea (Leg 2b) (Fig. 0001). Most of the stations sampled on the west–east transect in the Beaufort Sea (Leg 2b) were ice free. However, surface waters of eastward offshore waters were still ice covered. Surface seawater samples were collected with an acid cleaned bucket during Leg 1b and in the Mackenzie plume (stations 395, 398, 694, and 697) during Leg 2b. In the Beaufort Sea, seawater was collected from six depths using Niskin bottles mounted on a conductivity temperature depth probe (CTD) rosette. Ancillary data of temperature, salinity, pH, dissolved oxygen, colored dissolved organic matter, inorganic and organic nutrients, and chlorophyll a are given in Table S1 (Supporting Information).
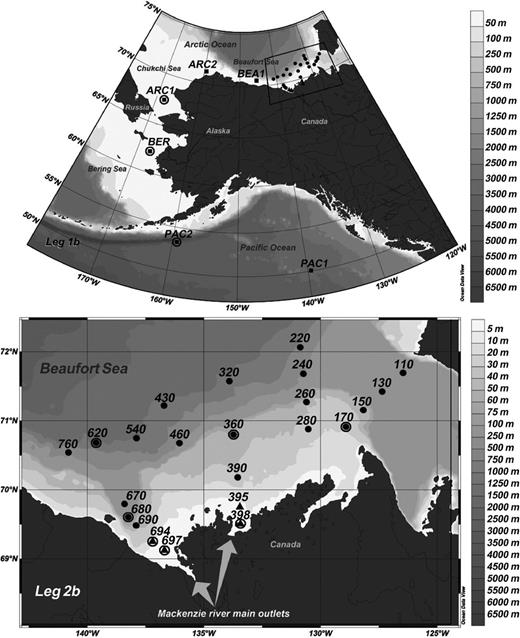
Locations of stations sampled during legs 1b and 2b of MALINA cruise. Leg 1b stations (black squares) were sampled only at the surface; leg 2b stations were sampled at several depths (black dots) or only at the surface (black triangles). Circles indicate stations where pufM clone libraries were constructed. Gray shades correspond to bottom depths.
Bacterioplankton biomass for DNA and total RNA extraction was collected onboard. Seawater samples were prefiltered through 47-mm-diameter and 3-μm pore-size polycarbonate filters (Cyclopore, Whatman) before the final collection of bacterioplankton cells onto 0.22-μm pore-size Sterivex cartridges (Millipore, Billerica, MA) for DNA extraction or onto 25-mm-diameter and 0.22-μm pore-size Durapore filters (Millipore) for RNA extraction. Sterivex cartridges were filled with 1.6 mL of lysis buffer (0.75 M sucrose, 50 mM Tris-HCl, pH 8), immediately frozen in liquid nitrogen, and stored at −80 °C until analysis. To limit the degradation of mRNA, small volumes of seawater (~ 1 L) were filtered as rapidly as possible, immediately upon retrieval of the CTD. RNA filters were transferred in collection tubes containing 0.8 mL of RLT buffer (Qiagen, Hamburg, Germany) with 1% of β-mercaptoethanol, frozen in liquid nitrogen, and stored at −80 °C until analysis. The time from the start of filtration to storage was 15–20 min.
Microscopic enumeration of AAP bacteria and total prokaryotes
Prokaryotes were enumerated by epifluorescence microscopy of paraformaldehyde-fixed samples that were filtered onto 0.2-μm pore-size black polycarbonate filters (Cottrell et al., 2006). Filters were stored at −80 °C for up to 4 months prior to analysis. Total prokaryotes were enumerated after staining with 4′,6-diamidino-2-phenylindole (DAPI), 1 μg mL−1 final concentration in 1× phosphate-buffered saline (PBS) for 10 min. The AAP bacteria were enumerated using an Intensified Retiga charge-couple device camera (Qimaging, Surry, BC, Canada) and image analysis routines to enumerate cells that fluoresce blue when stained with DAPI and have infrared fluorescence (BChl a signal), but not red or orange fluorescence (Chl a and phycoerythrin signals, respectively) (Cottrell et al., 2006). AAP bacterial abundance data were imported into Ocean Data View version 4 (Schlitzer, 2010) and interpolated using the DIVA gridding tool.
Isolation and identification of AAP bacterial strains
Seawater samples (50–100 μL) collected at the surface and at the deep chlorophyll maximum (DCM) were spread onto low nutrient heterotrophic medium (Cho & Giovannoni, 2004) prepared using seawater collected at station 860 at the surface and the DCM, respectively. Dimethylsulfoniopropionate (DMSP) was added to the medium at a final concentration of 100 nM. Culture plates were incubated for up to 2 months at 4 °C into thermostatic cabinets illumined by luminescent tubes at irradiance levels of 120-μmol photons m−2 s−1 (for surface samples) and 25-μmol photons m−2 s−1 (for DCM samples). BChl a-containing colonies were detected as previously described (Jeanthon et al., 2011).
Bacterial DNA was extracted using the QuickExtract™ Bacterial DNA Extraction Kit (Epicentre Biotechnologies, Madison, WI). Small-subunit (16S) rRNA genes were amplified by PCR using universal reverse primer 1492R and Bacteria-specific forward primer 27F (Table 0001), whose 5′ ends were labeled with 6-hexachlorofluorescein (6-HEX) and with 6-carboxyfluorescein (6-FAM), respectively. Reaction mixtures (25 μL) contained 5 × buffer (5 μL), 2 mM MgCl2, 10 pmoles of each deoxyribonucleotide triphosphate (dATP, dCTP, dGTP, dTTP; Eurogentec, Seraing, Belgium), 10 pmoles of each oligonucleotide primer, 1.25 U of GoTaq Flexi DNA polymerase (Promega, Madison, WI), and 1 μL of cell lysate. The initial denaturation step consisted of heating the reaction mixture at 95 °C for 5 min, and the thermal profile then consisted of 30 cycles of denaturation at 95 °C for 30 s, annealing at 55 °C for 30 s, and extension at 72 °C for 1.5 min. A final extension step was carried out at 72 °C for 10 min. The PCR products were digested with the restriction endonucleases HinfI and MspI (New England BioLabs, Ipswich, MA) for 4 h at 37 °C. After enzymatic inactivation at 80°C for 20 min, T-RFLP digests were diluted in Hi-Di™ formamide (Applied Biosystems, Carlsbad CA), and terminal-restriction fragments (T-RFs) were separated in a 3130 xl Genetic Analyzer (Applied Biosystems). Data were analyzed using the PeakScanner™ Software (Applied Biosystems).
Main features of T-RFLP groups determined among the 92 AAP isolates and closest relatives based on the 16S rRNA and pufM gene sequences
| T-RF size (bp) | Number of strains | Representative strains | 16S rRNA gene closest relative | pufM gene closest relative | |||||
| FAM | HEX | Name | Accession number | % Similarity | Name | Accession number | % Similarity | ||
| 300 | 121; 123 | 47 | RCC 2406 (RCC 2405; RCC 2400) | Sulfitobacter sp. ZS5-11 | FJ196046 | 99 | Unc.bacterium MALINA OTU5 | JN248469 | 100 |
| 298 | 123; 125 | 2 | RCC 2401 | Sulfitobacter sp. ZS2020 | FJ889550 | 99.6 | Unc.bacterium MALINA OTU4 | JN248468 | 92 |
| 299 | 123; 125 | 41 | RCC 2403 (RCC 2402; RCC 2404) | Loktanella sp. WM1 | EF421433 | 100 | Unc.bacterium MALINA OTU29 | JN248513 | 99 |
| 298 | 123; 124;125 | 2 | RCC 2642 | Loktanella salsilacus LMG 22002 | AJ582229 | 99.5 | Unc.bacterium MALINA OTU29 | JN248513 | 99 |
FAM, carboxyfluorescein; HEX, hexachlorofluorescein; T-RF, terminal restriction fragment.
16S rRNA gene sequences of at least two randomly chosen strains from each T-RFLP group were amplified by PCR using 8F-1492R primers (Table S2) following the same conditions as described above. PCR products were purified by ExoSAP-IT PCR purification kit (GE Healthcare) and sequenced using the latter primers with an ABI 3130 POP7 sequencer (Applied Biosystems).
16S rRNA gene sequences were compared with sequences in public databases with blastn (Altschul et al., 1997). The new sequences were aligned using the Q-INS-I algorithm of the MAFFT sequence alignment program version 6.5 (Katoh et al., 2009). A set of 16S rRNA sequences with high similarity to those determined in this study were retrieved and added to the alignment. Phylogenetic trees were computed using neighbor-joining, maximum parsimony, and maximum likelihood inference approaches using mega 5 (Tamura et al., 2011). Bayesian analyses [MrBayes; (Ronquist & Huelsenbeck, 2003)] were also performed to provide additional statistical support for the nodes.
The presence of pufM was determined using PCR amplification with specific primers (Lehours et al., 2010). When necessary, bands of the targeted size were isolated from the gel using a DNA gel extraction kit (Millipore). Gel-purified products were concentrated with a Microcon YM50 centrifugal filter devices (Millipore) and sequenced using pufMF and pufM-WAW primers (Table S2).
Diversity analysis of pufM gene
A total of 42 DNA samples were extracted as previously described (Marie et al., 2006). To select samples for pufM diversity analysis, amplification and fingerprinting of pufM communities using temporal temperature gradient electrophoresis (TTGE) were performed as described by Lehours et al. (2010). For the construction of partial pufM DNA clone libraries, fresh PCR products were cloned directly or after gel purification using the TOPO-TA cloning kit (Invitrogen, Carlsbad, CA) according to the manufacturer's instructions. The sequences were trimmed to remove any vector and primer sequences. DNA sequences were translated into amino acid sequences and aligned using the ClustalW program in mega 5 (Tamura et al., 2011). The resulting protein alignment was back translated to nucleotide acid sequences that were realigned manually. A conservative value of 94% nucleic acid sequence similarity was chosen for clustering sequences into Operational Taxonomic Units (OTUs) using MOTHUR (Schloss et al., 2009). Representative sequences (defined as the sequence with the minimum distance to all other sequences in the OTU) were obtained using MOTHUR. The coverage value (Mullins et al., 1995), the Shannon index, HShannon (Shannon et al., 1949), and the bias-corrected richness-estimator, SChao1 (Chao et al., 2005) were calculated for each library.
A pufM database containing 35 aligned sequences (720 total nucleotide positions) of cultured species and environmental clones retrieved from GenBank and the GOS scaffold nucleotide sequences was constructed using mega 5 (Tamura et al., 2011) according to Yutin et al. (2007). A phylogenetic tree was constructed by Bayesian inference using MrBayes with substitution rates varying according to codon positions. Four parallel MCMC chains of 3.5 million generations were run; trees were sampled every 100 generations. A consensus tree was constructed after the exclusion of 10.000 ‘burnin’ trees. The pufM database and the consensus tree were imported into arb software (Ludwig et al., 2004). Representative sequences of each OTU (245 pb) and short pufM environmental reference sequences were aligned as above and added to the consensus Bayesian tree using the ADD_BY_PARSIMONY algorithm implemented in ARB. Noninformative taxa were removed from the final tree.
For cluster analysis, the dataset was randomly resampled before analysis. A distance matrix was computed from the presence of OTUs in clone libraries at a 94% identity threshold using Dice coefficient (Dice, 1945) and a dendrogram was inferred with the unweighted pair-group average algorithm (UPGMA) as implemented in XLSTAT (Addinsoft, New York).
In situ abundance of OTU 6 members
OTU 6, the most abundant group retrieved in the pufM libraries, was targeted by qPCR. Primers targeting specifically pufM genes from OTU 6 (Table S2) were designed using ARB. Primer specificity was confirmed by constructing a clone library as described above and sequencing 31 clones. All sequences were identical to those of OTU 6 members. QPCR conditions were as in Table S2. Two plasmid clones from our pufM and 16S rRNA libraries were used as positive controls and for standard curves (10-fold dilution series) in the qPCR assays. Plasmid DNA was linearized with HindIII and quantified using the Picogreen assay (Invitrogen).
QPCR was performed in triplicate, with 1 μL of environmental sample DNA normalized to 100 pg μL−1 or plasmid DNA solution in a total reaction volume of 10 μL using the SYBR Green/ROX qPCR Master Mix kit (Applied Biosystems). QPCR assay was performed using a Chromo4 Real-Time PCR Detection System and the Opticon Monitor software package (Bio-Rad) with the following thermal cycling conditions: 95 °C for 15 min, 45 cycles of denaturation at 95 °C for 45 s, primer annealing at the primer-specific annealing temperature (Table S2) for 45 s with fluorescence measurements after this step, and polymerase extension at 72 °C for 15 s. Melting curves were generated after each assay to check the specificity of the amplification by heating from 65 to 95 °C at a rate of 0.1 °C.s−1 and taking fluorescence measurements every 0.5 °C. Only single peaks were observed in the dissociation curves for both the standards and samples, indicating specific amplification with each set of primers. Average amplification efficiencies were as follows: 16S rDNA = 99.2% and OTU 6-pufM = 97%.
No inhibition was detected when a known quantity of standard was added to DNA extracts from surface waters of stations 697, 680, 620, and 398 (data not shown). The estimates of OTU 6-pufM abundance were normalized to 16S rRNA gene abundance to estimate the fraction of the bacterial community bearing OTU 6-pufM type (Campbell et al., 2008).
Activity of OTU 6 members
Reverse transcription PCR was used to produce cDNA from mRNA transcripts to determine whether pufM was being transcribed by OTU 6 members at the time of sampling. RNA samples were extracted using the RNeasy Mini kit (Qiagen) following the manufacturer's instructions with several modifications. Glass beads (50 μL) were added to the samples after thawing on ice and the tubes were mixed vigorously for 10 min. Genomic DNA was removed using a Turbo DNA-free kit (Ambion, Life Technologies, Paisley, UK). DNA removal in RNA samples was confirmed by control PCR amplifications without the reverse transcription step. No amplification was detected in these controls. ThermoScript RT-PCR system (Invitrogen) was used for the reverse transcription of pufM mRNA from total RNA samples. All reverse transcription reactions were performed in a total reaction volume of 10 μL. cDNA synthesis was performed at 55 °C using the reverse primer as gene-specific primer. PCR products obtained as above were cloned directly or after gel extraction and sequenced. pufM genes amplified using cDNA from station 620 were cloned and sequenced as described above. Of 31 clones that were analyzed, all contained the expected pufM gene sequences.
Nucleotide sequence accession numbers
Unique environmental pufM gene sequences obtained in this study are available in GenBank database under the accession numbers JN248465–JN248539. The 16S rRNA and pufM gene sequences of the isolates are available in GenBank database under the accession numbers JN248461–JN248464 and JN378828–JN378831, respectively.
Results
Oceanographic context
Using salinity and temperature profiles, several water masses were delineated in the Beaufort Sea/Mackenzie system (Fig. S1; Table S1). Surface waters in the Mackenzie plume stations and under the influence of the Firth river (station 680) displayed the highest temperatures and lowest salinities. The influence of the Mackenzie plume decreased eastward in the shelf where colder and denser surface waters were recorded, which was likely due to the addition of ice melt from offshore waters. Below 40–50 m depth, cold, high salinity deep ocean waters consistent with Pacific Ocean intrusion were observed. Nitrate concentrations in surface waters were low. Surface water phosphate increased with salinity, whereas silicate and nitrate decreased, as expected in this river-influenced region (Carmack et al., 2004). Similar to hydrographic features, total Chl a levels decreased greatly from the river plume region toward the more oligotrophic marine shelf and offshore waters.
Abundance of total prokaryotes and AAP bacteria
Total prokaryotic abundances ranged from 9.1 × 10⁴ cells mL−1 to 3.4 × 10⁵ cells mL−1 in surface waters sampled from the North Pacific Ocean to the Chukchi Sea. Along this transect, AAP bacterial abundances as measured by infrared epifluorescence microscopy were low (about 0.1–0.5%) except in the Chukchi Sea (ARC1) where their contribution reached 14.8% of the total prokaryotic community. In the Beaufort Sea, abundances of total prokaryotes decreased slightly from the river plume to offshore surface waters (Table S1; Fig. 0002a–d). Similar to total Chl a, AAP abundances dropped 10-fold between the plume and the shelf surface waters and by another 10-fold between the shelf and offshore surface waters (Fig. 0002e; Table S1). AAP bacterial abundances were highest in surface waters of the Mackenzie plume (mean abundance of 6.3%), reaching 14% of total prokaryotes at station 398 (Fig. 0002f and g). High contributions (up to 10%) were also found in the bottom nepheloid layer (BNL) of transects 200 and 300 (Fig. 0002g and h).

Spatial distribution of total prokaryotes (cells mL−1) and AAP bacteria (%) in surface waters of the Beaufort Sea (a, e) and along the transects 600 (b, f), 300 (c, g), and 200 (d, h) as shown on the map (e).
For the overall dataset, total prokaryotes and AAP bacterial abundances were positively correlated with temperature and negatively with salinity (Table S3). AAP proportions correlated significantly with ammonium, silicate, total Chl a, and the different forms of organic carbon, nitrogen, and phosphorus. In contrast to relative AAP bacterial abundance, total prokaryote abundance did not covary significantly with most of the parameters. High AAP bacterial abundances in the BNL were related to dissolved inorganic nitrogen and phosphorus, suggesting the presence of a diffusive flux of nutrients from the organic-rich sediments, the BNL, or both (Sundby et al., 1992).
Diversity and distribution of environmental pufM sequences
Based on their TTGE band patterns and their location, 13 samples were selected for further cloning and sequencing. Of 365 clones analyzed, 43 distinct OTUs were identified after grouping the sequences at 94% nucleic acid sequence similarity. The diversity in the river-influenced stations was high as indicated by the SChao1 values (estimated numbers of expected OTUs) and diversity indices (Table S4), whereas the coverage index was low. However, coverage estimates (> 83%) and rarefaction curves (data not shown) indicated that most of the diversity was detected in the libraries from marine stations. The diversity of AAP bacteria was generally lower in surface than in deeper waters. Cluster analysis of the AAP bacterial community composition separated the Beaufort Sea samples in three clusters according to water masses (Fig. S2). The two main clusters separated surface samples (upper polar mixed layer) and waters below 50m (Pacific summer water). North Pacific Ocean and Bering Sea samples grouped together.
A phylogenetic tree was constructed for all 43 OTUs from this study and from previous studies of pufM sequences (Fig. 0003). The phylogenetic analysis revealed that 41 OTUs were tentatively assigned to Alpha- (22 OTUs, ~ 49% of the sequences) or Betaproteobacteria (17 OTUs; ~ 48% of the sequences). Two OTUs belonged to Gammaproteobacteria. Two singletons could not be confidently assigned.
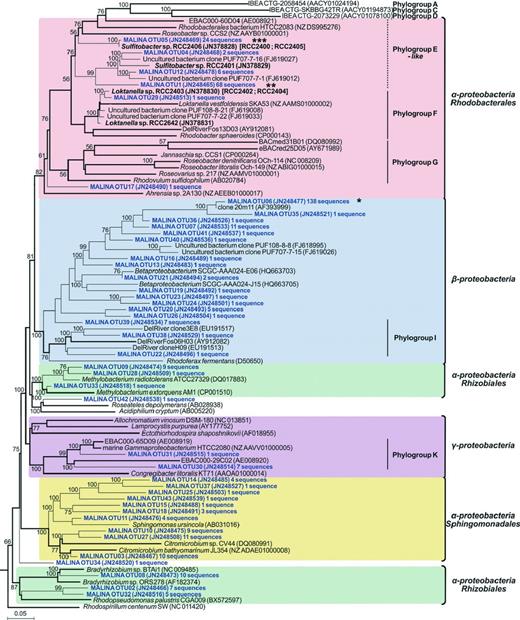
Phylogenetic tree showing the relationships between pufM gene sequences from MALINA isolates (in bold) and environmental samples (in blue) and relatives retrieved in GenBank (in black). Asterisks indicate the three most abundant OTUs in clone libraries. The tree is based on a Bayesian tree to which short sequences were added by ARB_PARSIMONY. Initial Bayesian tree is shown in bold lines. The numbers on nodes represent branch confidence values. Vertical bars indicate taxonomic groups defined by Yutin et al. (2007). The scale bar represents dissimilarity between nucleotide positions.
The betaproteobacterial OTU 6 was the most frequent OTU (38% of the sequences) and had pufM sequences identical (153 bp out of 245 bp) to that of environmental clones from the Monterey Bay (Béjà et al., 2002). OTU 6 belonged to a large cluster of 13 OTUs that also contained two sequences obtained by single-cell sequencing (Martinez-Garcia et al., 2012) and a mixture of arctic sequences (Cottrell & Kirchman, 2009), but it did not have any close relationship to known AAP bacteria. Two singleton OTUs belonged to betaproteobacterial phylogroup I defined by Yutin et al. (2007) that formed a sister lineage containing sequences of fosmid clones from the Delaware river (Waidner & Kirchman, 2005) and Rhodoferax fermentans (Page et al., 2004). Betaproteobacterial sequences dominated in clone libraries from river-influenced waters (Fig. 0004). OTU 6, the most abundant OTU, was recovered in all Beaufort Sea stations and in the Bering Sea, but was absent in the North Pacific Ocean and Chukchi Sea.
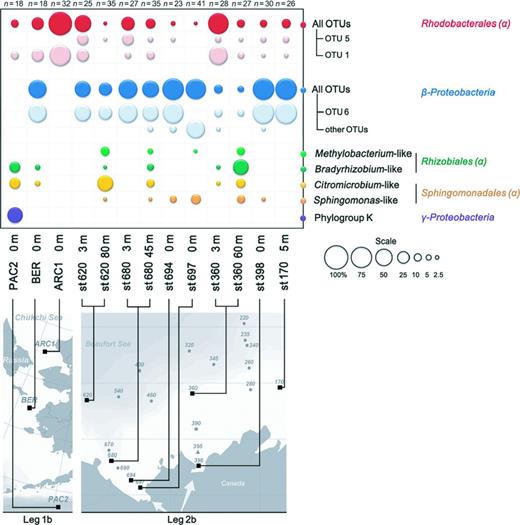
Relative abundance of phylogenetic clusters in samples from the North Pacific waters (leg 1b) to the Beaufort Sea (leg 2b). Numbers of analyzed clones in each library are indicated.
Alphaproteobacterial OTU 1 and OTU 5, the second and third most abundant OTU (18.6% and 6.6% of the sequences, respectively) together with OTU 4, -12, and -29 were closely related to environmental clones recovered from the Chukchi and Beaufort Seas (Cottrell & Kirchman, 2009) (Fig. 0003). These sequences dominated libraries from offshore waters of the Beaufort and Chukchi Seas. Among them, OTUs 4 and 5 were only detected in the Beaufort Sea (Fig. 0004). In contrast, OTU 1 was retrieved from the North Pacific Ocean to the Chukchi Sea with relative proportions increasing northwardly. It also occurred in most Beaufort Sea samples.
Other Alphaproteobacteria grouped mainly with cultivated members of the Bradyrhizobiaceae and of genera Citromicrobium, Methylobacterium, and Sphingomonas (Fig. 0003). Bradyrhizobiaceae- and Citrobacterium-like sequences showed similar distribution patterns. They co-occurred in surface waters of the North Pacific Ocean and in shelf and offshore DCM layers of the Beaufort Sea. Sequences related to Sphingomonas and Methylobacterium were only found at the surface in the Mackenzie mouth and at the DCM level along the plume (Fig. 0004). Gammaproteobacterial OTUs belonged to the phylogroup K defined by Yutin et al. (2007). They prevailed in surface water libraries of the North Pacific Ocean, but were not detected in higher latitude samples.
Diversity of AAP isolates
To gain more insights into the origin of the pufM genes obtained in this study, AAP bacteria were isolated that grew on low nutrient heterotrophic medium. BChl a-containing colonies were detected only from shelf and offshore surface waters of the Beaufort Sea. Based on T-RFLP analyses of 16S rRNA gene, the 92 pufM-positive strains were distributed in four groups (Table 0001). In accordance with their position in the pufM phylogenetic tree (Fig. 0003), representative strains of these groups had 16S rRNA gene sequences closely related to Sulfitobacter and Loktanella (Fig. 0005). Interestingly, the pufM partial sequences of most isolates were identical or nearly identical to environmental sequences obtained in this study. About half of the isolates were affiliated with S. marinus (Fig. 0005) and had pufM sequences that matched with OTU 5, the third most abundant OTU in the pufM libraries (Fig. 0003). The 16S rRNA gene sequences of both Sulfitobacter representatives RCC 2406 and RCC 2401 were most closely related with that of isolates from Antarctic Sea ice and Arctic marine sediments, respectively (Table 0001). The two other T-RFLP groups were affiliated to the genus Loktanella. Both Loktanella groups had pufM sequences almost identical to that of OTU 29. On the basis of their 16S rRNA gene sequences, both groups clustered with strains isolated from Antarctic lakes (Van Trappen et al., 2004), the major one having a sequence similar to that of Loktanella sp. WM1 isolated from the Baltic Sea (Salka et al., 2008). No gamma- or betaproteobacterial AAP strains were isolated.

Phylogenetic analysis based on the 16S rRNA sequences indicating the position of MALINA isolates. Numbers show nodal supports from maximum likelihood, Bayesian posterior probabilities, maximum parsimony, and neighbor-joining analyses, respectively. The scale bar represents dissimilarity percentage between nucleotide positions.
Abundance and activity of OTU 6 members
As pufM in the OTU 6 clade clustered with betaproteobacterial sequences, we hypothesized that OTU 6 members would have a freshwater origin. The relative abundance of OTU 6 was investigated using quantitative PCR along the two salinity gradients of the Mackenzie River (transects 300 and 600). Proportions of OTU 6-like pufM genes decreased gradually from higher temperature and lower salinity to lower temperature and higher salinity waters in both transects (Fig. 0006). However, we noticed a high proportion of OTU 6 at station 680 associated with increasing temperature and decreasing salinity. This contribution was higher than the expected based on simple dilution. It could be related to a local input of OTU 6 members released from the Firth River. A subsequent PCR survey of our samples using specific primers detected OTU 6 members in all Beaufort Sea surface samples except at the three northern offshore stations (110, 220, and 320).

Surface relative abundance of OTU 6 members (qPCR) and AAP bacteria (IR microscopy) along transects 300 and 600 in relation with temperature and salinity.
To investigate if members of this clade actively express photosynthetic genes in cold marine waters, we extracted mRNA from surface samples of transect 600 and amplified OTU 6-specific genes. We confirmed by sequencing that all pufM cDNA clones were OTU 6 members. Active OTU 6 members were detected in all samples including the most offshore station 620, although their contribution to total abundance was low according to qPCR assays (Fig. 0006).
Discussion
Little is known about AAP bacteria in polar environments. The main objective of this study was to explore their abundance, diversity, and distribution patterns in a significant and typical arctic region and to evaluate their ecology and biogeographical trends. Our results indicate that the distribution patterns generally observed in oligotrophic open ocean and eutrophic estuarine environments of temperate and tropical regions (Jiao et al., 2007; Waidner & Kirchman, 2008; Lamy et al., 2011) also occur in the Beaufort Sea.
Links between AAP population abundance and environmental variables
Our results indicate that particulate and dissolved organic matter and Chl a concentrations positively influenced the relative abundance of AAP bacteria, but did not contribute to the success of the prokaryote community as a whole. This suggests that AAP bacteria may respond to organic supply differently and have higher mineralization capacities than the bacterial community. In addition to AAP bacteria associated with the thick surface turbidity layer, proportions of AAP bacteria were high in the thinner but more turbid BNL. Interestingly, AAP bacteria in surface and bottom layers showed contrasting relationships to several environmental variables, suggesting that the two particle-rich environments represent substantially different habitats. The two habitats could differ because of different types of particles in the water column, phytoplankton, and mineral-rich fine particles in the surface layer and coarse aggregates of suspended sediments in the bottom layer (Doxaran et al., 2012). These particle-rich waters might be important not only in terms of sediment transport but also as sites of microbially mediated organic transformations. The latter possibility is consistent with observations of increased microbial production and activity in particle-rich surface and bottom waters of the Mackenzie plume (Vallières et al., 2008; Garneau et al., 2009). Although we did not quantify the proportion of particle-associated AAP bacteria, earlier studies in other nutrient-rich environments (Waidner & Kirchman, 2007) suggest that they may represent a significant part of the AAP bacterial community in the Mackenzie plume. Being associated with particles seems to enhance the synthesis of BChl a in estuaries (Cottrell et al., 2010). It is likely that the energy gained by AAP bacteria via phototrophy in these environments is suitable for cost-intensive metabolic processes such as degradation of humic-rich DOM from riverine and terrestrial runoff.
Aerobic anoxygenic phototrophic bacterial diversity and distribution
Most OTUs recovered were closely related (> 94% similarity) to existing Arctic sequences or belonged to novel OTUs. Only 8 OTUs matched sequences from elsewhere. The arctic pufM genes were also different from those in Antarctic sea ice and coastal seawater (Koh et al., 2011). Consistent with previous findings (Cottrell & Kirchman, 2009), this suggests that most OTUs found in this study might be restricted to the Beaufort Sea, which seems to constitute a microbial province favoring endemism (Lovejoy et al., 2007).
The most striking observation from our dataset is the widespread distribution of a AAP betaproteobacterial clade (OTU 6) in the entire shelf. Betaproteobacteria are usually low in abundance in the open ocean and the few betaproteobacterial sequences that have been retrieved from the marine environment are from coastal environments (Rappé et al., 2000; Riemann et al., 2008). In contrast, they represent a consistently large fraction of the bacterioplankton in freshwater lakes and diverse river types (Glöckner et al., 2000; Zwart et al., 2002) including the Mackenzie River where they are abundant (Garneau et al., 2006; Galand et al., 2008). Since the Arctic Ocean receives about 10% of global riverine discharge (Aagaard & Carmack, 1989), the stratified surface waters of the Arctic Ocean share many characteristics of an estuary where Betaproteobacteria form a minor fraction of the total prokaryotic community (Galand et al., 2009; Kirchman et al., 2010). Most betaproteobacterial OTUs recovered in this study were new (< 94% similarity to existing sequences) and do not group with the Rhodoferax, Roseateles, and Rubrivivax pufM clusters often identified in other estuarine and freshwater systems (Waidner & Kirchman, 2008; Salka et al., 2011). They formed several clusters divergent from the phylogroup I (Yutin et al., 2007) that include arctic sequences (Cottrell & Kirchman, 2009) and single amplified genome (SAG) sequences from temperate freshwater lakes (Martinez-Garcia et al., 2012). Interestingly, the 16S rRNA sequences from the latter pufM-containing SAGs were primarily related to the betaproteobacterial Polynucleobacter cluster that are common in the Mackenzie river (Galand et al., 2008). As horizontal gene transfer of the photosynthetic gene cluster is possible (Igarashi et al., 2001), phylogenetic data need to be interpreted with caution especially in groups with only a few species with known pufM and 16S sequences.
Our data clearly indicate that betaproteobacterial AAP bacteria exhibited a strong river to ocean gradient, suggesting that these bacteria grew in the Mackenzie River and then were mixed with Beaufort coastal waters. The distribution of OTU 6 in the Beaufort Sea was consistent with satellite observations of the offshore extension of Mackenzie turbid waters over the continental shelf (Doxaran et al., 2012). However, the presence and activity of OTU 6 in Beaufort coastal waters contrasted with that of other betaproteobacterial OTUs found only near the mouth of the Mackenzie River. As mortality of freshwater bacteria can be an important process in estuaries (Painchaud et al., 1995), one explanation is that OTU 6 members have a broader salinity tolerance than other AAP Betaproteobacteria. The presence of partial pufM sequences identical to that of OTU 6 in marine waters of Monterey Bay (Béjà et al., 2002) supports this hypothesis. Further studies are required to estimate their contribution in other marine Arctic regions and to identify parameters that control their distribution.
Previous studies showed that some Betaproteobacteria are still active in marine waters (Cottrell & Kirchman, 2004), including in the Arctic (Alonso-Sáez et al., 2008). Here, we showed that the OTU 6 pufM gene was actively transcribed in saline waters during the arctic summer, which is surprising because BChl a synthesis is partly or totally inhibited by light in AAP bacteria currently in culture (Yurkov & van Gemerden, 1993; Tomasch et al., 2011). Our data suggest that BChl a synthesis in OTU 6 members is not fully repressed by light, like in Dinoroseobacter shibae and Roseateles depolymerans (Suyama et al., 2002; Tomasch et al., 2011). In most AAP bacteria isolated so far, photoheterotrophy generates additional metabolic energy enhancing AAP bacterial growth under light (Koblížek et al., 2003; Cooney et al., 2006). Considering the variety of sharp environmental gradients encountered by OTU 6 members in the transition zone between freshwater and marine waters, it is likely that, when light is sufficient, photoheterotrophy may have different physiological roles in warm, organic matter-rich freshwater and in cold, saline oligotrophic waters. The nature of their physiological adaptation and metabolic versatility needs to be elucidated to understand the selective advantage that photoheterotrophy provides them.
To our knowledge, AAP strains have not previously been isolated from the Arctic Ocean. In this study, the isolates provided a valuable set of data that allowed the taxonomic identification of two predominant pufM phylotypes. We successfully isolated pufM-containing bacteria, but only from surface waters, consistent with the phototrophic character of AAP bacteria. Our arctic isolates were restricted to different species of the genera Sulfitobacter and Loktanella. Although these species were cultivated from temperate to polar regions (Labrenz et al., 2000; Van Trappen et al., 2004; Salka et al., 2008), the strains isolated in this study were most similar to microorganisms residing in polar waters. Among them, the Sulfitobacter strains clustering into OTU 5 were absent outside the Beaufort Sea, suggesting that they potentially represent typical arctic members. Sulfitobacter and Loktanella species are often found in surface waters, and numerous interactions with phytoplankton have been reported (Moran et al., 2007). These metabolically versatile bacteria can satisfy a significant part of their carbon and sulfur demands by assimilating DMSP released during the decay of phytoplankton blooms (González et al., 1999; Mou et al., 2005). The Beaufort Sea waters sampled during this study exhibited postbloom characteristics, with low levels of Chl a in the surface layer. As surface waters of the Beaufort Sea are oligotrophic in summer, the capacity to derive energy from light and reduced sulfur compounds would give a physiological advantage for competing in this extreme environment. The influence of light and starvation on BChl a and biomass formation has been studied in AAP bacteria such as Sulfitobacter and Loktanella that contain low amounts of BChl a (Biebl & Wagner-Döbler, 2006). As this type of AAP bacteria seems to use phototrophy genes only under simultaneous illumination and extreme shortage of organic nutrients, their distribution in arctic waters may be linked to their photoheterotrophic mode of metabolism.
Aerobic anoxygenic phototrophic diversity was highest at the shelf and offshore DCM layers of the Beaufort Sea where Pacific Summer Water mixes with the BNL. Methylobacterium- and Sphingomonas-like bacteria, mostly absent in surface waters, were common at these depths along the Mackenzie plume. Although a few species of both genera have been isolated from seawater (Vancanneyt et al., 2001; Wang et al., 2007), these bacteria have a widespread distribution in diverse terrestrial habitats including soil, freshwater, and lake sediments (White et al., 1996; Green, 2006). Our data suggest that Methylobacterium- and Sphingomonas-like bacteria share the same habitat, more likely associated with soluble humic material in river water (Kirk, 2011). In line with this hypothesis, these bacteria were found to actively participate in humic matter degradation (Balkwill et al., 2006; Hutalle-Schmelzer et al., 2010). Two groups of Bradyrhizobiaceae-related sequences were detected mostly in DCM samples of the Beaufort Sea shelf. One group was loosely associated to the metabolically versatile photosynthetic bacterium Rhodopseudomonas palustris that is widely distributed in nature including coastal marine sediments (Oda et al., 2003). The other grouped with strictly AAP Bradyrhizobium strains that form nitrogen-fixing nodules on stems and/or roots of many legumes (Giraud & Fleischman, 2004). Like Methylobacterium and Sphingomonas clusters, these clades were mostly recovered in the deep layers of the Mackenzie plume, suggesting that they were also entrained by the river sediment load. However, their distribution was similar to that of Citromicrobium-like clades that are typical marine bacteria (Yurkov et al., 1999; Jeanthon et al., 2011). Furthermore, we also retrieved them from North Pacific Ocean surface waters, supporting earlier reports of Bradyrhizobiaceae in the North Pacific Ocean gyre and the Bering Sea where terrestrial inputs are unlikely (Hu et al., 2006). It is therefore tempting to speculate that arctic Bradyrhizobiaceae-related pufM sequences are marine photosynthetic bacteria possibly transported in Pacific waters.
Conclusion
Our transect analysis in the coastal arctic ecosystem of the Mackenzie River and Beaufort Sea shelf revealed strong spatial gradients in environmental properties and in the abundance and composition of AAP bacterial communities. We showed that AAP bacteria represent a significant fraction of the total prokaryotic community in the arctic coastal environments impacted by riverine inputs. Our results highlight that OTU 6 members are an important and widely distributed but largely unknown component of AAP bacterial communities. However, we do not know the impact of phototrophic light harvesting on energy requirements and carbon metabolism of these bacteria. Future studies are needed to explore their role in biogeochemical cycling in coastal ecosystems.
Acknowledgements
This study was conducted as part of the Malina Scientific Program funded by Agence Nationale de la Recherche (ANR), Institut National des Sciences de l'Univers – Centre National de la Recherche Scientifique (INSU-CNRS), Centre National d'Etudes Spatiales (CNES), and European Space Agency (ESA). We thank all participants to the MALINA cruises for their help, especially M. Babin who coordinated the project, K. Lévesque for the logistics, and all CCGS Amundsen crew members. We warmly thank D. Doxaran, P. Raimbault, N. Garcia, and J. Ras for providing ancillary data. We are grateful to M. Koblížek for help with detection of AAP bacterial colonies using the infrared system available in his laboratory, M. Perennou and G. Tanguy (Biogenouest Sequencing Platform-FR2424-Station Biologique) for help with sequencing. This work was supported by the European Union programs MicroB3 (UE-contract-287589) and MaCuMBA (FP7-KBBE-2012-6-311975). D.B. was supported by a grant from the French Ministry of Higher Education and Research. D.L.K. and M.T.C. were supported by NSF grant OCE 1030306.
References
Supporting Information
Table S2. Summary of primers used in this study.
