


Abstract
Dissolved inorganic nitrogen (DIN) uptake by marine heterotrophic bacteria has important implications for the global nitrogen (N) and carbon (C) cycles. Bacterial nitrate utilization is more prevalent in the marine environment than traditionally thought, but the taxonomic identity of bacteria that utilize nitrate is difficult to determine using traditional methodologies. 15N-based DNA stable isotope probing was applied to document direct use of nitrate by heterotrophic bacteria on the West Florida Shelf. Seawater was incubated in the presence of 2 μM 15N ammonium or 15N nitrate. DNA was extracted, fractionated via CsCl ultracentrifugation, and each fraction was analyzed by terminal restriction fragment length polymorphism (TRFLP) analysis. TRFs that exhibited density shifts when compared to controls that had not received 15N amendments were identified by comparison with 16S rRNA gene sequence libraries. Relevant marine proteobacterial lineages, notably Thalassobacter and Alteromonadales, displayed evidence of 15N incorporation. RT-PCR and functional gene microarray analysis could not demonstrate the expression of the assimilatory nitrate reductase gene, nasA, but mRNA for dissimilatory pathways, i.e. nirS, nirK, narG, nosZ, napA, and nrfA was detected. These data directly implicate several bacterial populations in nitrate uptake, but suggest a more complex pattern for N flow than traditionally implied.
Introduction
Uptake of dissolved inorganic nitrogen (DIN) by marine heterotrophic bacteria has important implications for the global nitrogen (N) and carbon (C) balances (Kirchman, 1994; Allen et al., 2005). This is particularly true in environments where bacteria actively compete for nitrate with phytoplankton, as this can significantly affect estimates of new vs. recycled productivity (Kirchman, 2000). Traditionally, it has often been suggested that heterotrophic bacteria in marine systems satisfy their N demand primarily via the uptake of organic N, while being responsible for remineralization of N in the form of ammonium (Allen et al., 2001). It is now known that nitrate-utilizing bacteria are far more prevalent in marine systems than was previously recognized (Allen et al., 2001, 2005; Cai & Jiao, 2008), and that, nitrate uptake by heterotrophic bacteria can account for a sizable proportion of total inorganic N utilization in natural populations (Allen et al., 2002); for example, in a study of bacterial DIN uptake in the Barents Sea, it was observed that bacterial nitrate uptake accounted for as much as 14–40% of total nitrate uptake and a greater proportion of total nitrate utilization near the marginal ice zone (as opposed to the open Atlantic Ocean) and with depth (Allen et al., 2002). Bacteria can, therefore, contribute to nitrate utilization in marine systems and should not be ignored in estimates of new production (Allen et al., 2002). Molecular tools have shed some light on the diversity of bacteria containing assimilatory nitrate reduction genes in marine environments (Allen et al., 2001; Cai & Jiao, 2008), suggesting that a large diversity of such organisms exists. It has further been observed that their distribution and community structure are correlated with nitrate availability and utilization patterns (Allen et al., 2005).
Despite these observations, unresolved questions remain with respect to nitrate utilization by heterotrophic bacteria in marine systems; for example, the presence of genes does not necessarily imply activity. Another important limitation of prior studies has been the inability to differentiate N uptake by individual microbial populations. Distinguishing between bacterial and phytoplankton uptake is challenging, because N uptake measurements traditionally employ glass fiber filters (e.g. Whatman GF/F), with a nominal pore size of 0.7 μm. The rates calculated from such experiments are typically attributed to phytoplankton, but a sizable and variable bacterial component is retained on such filters (Gasol & Moran, 1999; Berg et al., 2001). Furthermore, measurements are taken on bulk communities, in which hundreds of different bacterial and phytoplankton populations can exist simultaneously. As a result, it is not always clear which phytoplankton or bacteria utilize different forms of N and how these populations interact. Culture-independent approaches have provided some insight into the distribution, diversity, and abundance of microbial populations, but they cannot demonstrate uptake of N directly.
15N-based DNA stable isotope probing (SIP) allows tracking of N into individual microbial taxa via the separation of DNA of differing isotopic composition through a cesium chloride gradient (Buckley et al., 2007a, b; Wawrik et al., 2009). The method was first applied to study bacterial communities in soils, demonstrating the presence of uncultivated diazotrophic lineages (Buckley et al., 2007a, b). More recently, the approach has been applied in marine environments to investigate N nutrition of Synechococcus and diatoms on the West Florida Shelf (Wawrik et al., 2009), demonstrating that N nutrition of these two phytoplankton is more complex than previously thought. Together, these studies illustrate that 15N-based DNA SIP is a powerful tool for investigating the N nutrition of specific microbial populations in the environment. This study relates to our previous work on phytoplankton N uptake (Wawrik et al., 2009) by exploring nitrate utilization by heterotrophic bacterioplankton in the same community. SIP experiments presented here demonstrate that N from 15N nitrate is readily incorporated into DNA of several bacterial populations. This suggests that both phytoplankton (Wawrik et al., 2009) and bacterioplankton are simultaneously utilizing the available nitrate pool on the West Florida Shelf.
Materials and methods
Work presented here is a companion study to a previously described SIP experiment describing phytoplankton N uptake (Wawrik et al., 2009). All environmental samples, incubations, and SIP fractions correspond to those previously described. A detailed description of the site, water chemistry, as well as N concentrations [ammonium, nitrate, urea, dissolved primary amines (DPA), dissolved organic nitrogen (DON)], uptake (ammonium, nitrate, urea and DPA), and regeneration rates (ammonium and nitrate) can also be found in the preceding study. Also included there are results from SIP control experiments comparing labeled and unlabeled DNA from cultures, ambient community DNA, and no treatment control (NTC) samples (Wawrik et al., 2009). No artifacts or unexpected density shifts were observed in any of the SIP controls, and control experiments are, therefore, not reiterated here.
Field site and incubation experiments
All field samples were collected during an ECology Of Harmful Algal Blooms (ECOHAB) cruise on the R/V Pelican on October 10, 2008. Samples were collected in the morning from 2-m depth using 20-L Niskin bottles at a station c. 2 km west of Narrows Key, outside of Charlotte Harbor (Lat. 26.6183 N, Long. −82.2455 W). Ambient seawater controls (T0) were filtered immediately, and filters were stored under liquid nitrogen. The following incubations of 400 mL of seawater were conducted in duplicate: no N source (NTC) and 2 μmol N L−1 addition of 15NH4Cl or Na15NO3. All incubations were for 24 h to ensure that sufficient time had passed to allow DNA replication by some portion of the bacterial population. Using rate measurements, we estimated that within 24 h, about 15% of the label was recycled (see ). Longer incubations were, therefore, deemed undesirable, as they would have likely prevented any detection of differences among treatments because of significant cross-feeding. As a result, any detected differences probably originated from major, fast growing populations. It should be noted that seawater was filtered by 0.45-μm filters, which may not have captured some small cells. In our experience, however, this tends to be a minor problem, and somewhere between 90% and 95% of DAPI countable cells are typically collected on these filters (B. Wawrik, unpublished data). Comparisons of DNA from cultures, the ambient community (TO), NTC bottles, and N treatments are found in the companion study and demonstrated that this was sufficient time to allow substantial labeling of Synechococcus and diatom populations at our study site (Wawrik et al., 2009). All incubations were conducted in 500-mL acid-cleaned polycarbonate bottles that were placed under two layers of neutral density screening under ambient light to simulate light intensity at c. 2-m depth. Continuous flow of seawater through the incubator was used to maintain temperatures near those of the sampled seawater.
DNA extraction
Seawater (400 mL) was filtered onto 0.45 μm Supor filters (PALL Life Sciences). Filters were stored in 0.75 mL of STE buffer (1 M NaCl, 100 mM Tris·HCL pH 8.0, 10 mM EDTA pH 8.0) and frozen in liquid N2 in the field. The filters were stored at −80 °C until DNA extraction. For extraction, 75 μL of 5% SDS and 20 μL of 20 mg mL−1 proteinase K were added, and samples were incubated for 30 min at 37 °C. Muffled glass beads (50–100 mg of 0.1 mm beads) were added, and samples were homogenized by bead-beating for two minutes before extraction with phenol/chloroform/isoamyl alcohol (25 : 24 : 1). DNA was precipitated with 0.1 volumes of 3 M sodium acetate (pH 5.3) and 0.6 volumes of isopropanol and then re-suspended in 50 μL of TE buffer (1 mM Tris pH 9.0, 10 mM EDTA pH 8.0).
CsCl gradient ultracentrifugation
Centrifugation and fractionation were conducted as previously described (Buckley et al., 2007a, b; Wawrik et al., 2009). Five to ten micrograms of DNA was fractionated, and each fraction's density was determined by measuring the refractive index. Density calculations were recorded as described by Birnie (1978), applying a small empirically determined correction factor for the effect of ethidium bromide (0.0038) to the measured refractive index (Wawrik et al., 2009).
Terminal restriction fragment length polymorphism (TRFLP) analysis
DNA from each fraction was amplified using universal 16S primers 27F 5′-AGAGTTTGATCMTGGCTC-3′ and 1525R 5′-AAGGAGGGTGWTCCARCC-3′ (Nakatsu & Marsh, 2007). The forward primer was labeled with carboxyfluorescein (FAM). PCR amplifications (30 μL volumes) were set up using PCR Supermix (Invitrogen, Carlsbad, CA) containing 0.5 μM of each primer and 1 μL of template DNA. An initial denaturation step of 95 °C for 3 min was followed by 35 cycles of: 96 °C for 30 s, 45 s at 55 °C, and 72 °C for 1.2 min. A final extension of 10 min at 72 °C was applied. PCR products were quantified by agarose gel electrophoresis and comparison of band brightness to duplicate lanes of 0.5 μg of Lamda HindIII DNA using a Kodak Gel Logic 100 Imaging System (Kodak). A 2.5-μL aliquot of each PCR was digested at 37 °C for 4 h using 2 units (10 U μL−1) of AluI restriction enzyme (Promega) in 2 μL of 10× buffer and 14.5 μL of sterile water. After digestion, samples were precipitated with 1.9 μL of 0.75 M sodium acetate (pH 5.2), 0.31 μL of 20 mg mL−1 glycogen, 0.09 μL ABI loading dye, and 37 μL of 100% ethanol. Pellets were re-suspended into HiDi formamide (Applied Biosystems) containing size standard LIZ 600 (Applied Biosystems) and run on ABI 3730 capillary sequencer for analysis. TRFLP data were then imported into matlab (MathWorks) to identify fragments that exhibited density shifts as a result of incubation with 15N-labeled ammonium or nitrate. This is performed visually by generating heat maps of the data for each of the treatments (see Supporting Information, Fig. S2). Only fragments with discernable distribution maxima were included in the analysis. Fragments that produced saturating signals on the ABI sequencer were not considered, because their distribution maxima cannot be clearly identified. To estimate sizing error, run-to-run variability was analyzed by considering individual peaks in the data set; for example, the peak corresponding to the 248-bp fragment was a major signal (> 200 fluorescence units) in 14 fractions of the 15N nitrate treatment. The standard deviation of the associated peak size in these fractions was 0.67 bp. This means that > 87% of the respective peak maxima were within ±1 bp (1.5 SD). All peak maxima were within < 1% of the predicted size.
Community analysis
Two approaches were used to analyze the ambient bacterial community composition (T0). For longer sequence reads (needed for in silico comparison to terminal restriction fragments), PCR products were generated using 27F and 1525R bacterial rRNA gene primers as indicated earlier. PCR products were gel-purified using a Gel Purification Kit (Qiagen) and ligated into pCR4.0-TOPO (Invitrogen) according to the manufacturer's instructions. Four hundred colonies were picked and inserts were sequenced using both the M13F and M13R priming regions on the vector. Reads were then assembled into operational taxonomic units (OTUs) at the 95% identity level and trimmed to remove vector. Primer sequences were included in the analysis to allow correct calling of terminal restriction fragment lengths. All sequences, for which the lengths of the terminal AluI fragment could not be unambiguously determined, were removed from the analysis.
For a more in-depth survey of bacterial community composition, 16S rRNA gene primers 27F 5′-AGAGTTTGATCMTGGCTC-3′ and 338R 5′-GCTGCCTCCCGTAGGAGT-3′ were used to amplify community DNA using the following cycling conditions: 95 °C for 3 min, followed by 35 cycles 96 °C for 15 s, 20 s at 55 °C, and 30 s at 72 °C. The forward primer was tagged for pyrosequencing and also included a unique identifying hexamer sequence (Hamady et al., 2008). Sequencing was conducted via FLX 454 chemistry at the University of South Carolina's Environmental Genome Sequencing Core.
Classification of sequences or OTUs was achieved using Mothur (v.1.21.1) (Schloss et al., 2009) by alignment with the silva reference alignment using the nast algorithm (Pruesse et al., 2007). Sequences containing ambiguous bases, homopolymers (N > 8), or a quality of < 25 were removed. Only sequences longer than 100 bp were included in the analysis. Potentially chimeric sequences were removed using ChimeraSlayer (www.broadinstitute.org). Each sequence was then classified using the RDP's naive Bayesian rRNA classifier (Wang et al., 2007).
RNA extraction
Ambient seawater (T0) was filtered onto 0.45 μm Supor filters and stored in 2-mL screw-cap tubes containing 0.75 mL of RLT buffer (Qiagen RNEasy Kit) and 50 mg of muffled glass beads (0.1 mm). Tubes were frozen in liquid N2 in the field and maintained at −80 °C until extraction. Extraction proceeded as previously described (Wawrik et al., 2002, 2003), by performing DNase digestion on the RNeasy column as recommended by the manufacturer. PCR with 16S rRNA gene primers was used to assay for the complete removal of contaminating DNA from RNA extracts before proceeding to reverse transcription (data not shown).
RT-PCR of nitrogen cycling genes
Reverse transcription was performed on RNA extracted from ambient seawater (T0) using a Superscript Vilo cDNA Synthesis Kit (Invitrogen), as recommended by the manufacturer. All PCR (cDNA template) were performed with PCR Supermix (Invitrogen) using PCR conditions described in respective references. PCR for the nitrite reductase genes nirS and nirK were conducted as described by Braker et al. (1998, 2000) using the following primers: nirS1F 5′-CCTAYTGGCCGCCRCART-3′, nirS6R 5′-CGTTGAACTTRCCGGT-3′, nirK1F 5′-GGMATGGTKCCSTGGCA-3′, and nirK5R 5′-GCCTCGATCAGRTTRTGG-3′. Nested RT-PCR for the nitrate assimilation gene nasA was performed as previously described by Allen et al. (2001) using the following nested PCR primer set: nas22 5′-TGYCCNTAYTGYGGNGT-3′, nas964 5′-CARCCNAAYGCNATGGG-3′, nasA1735 5′-ATNGTRTGCCAYTGRTC-3′, and nas1933 5′-CARTGCATNGGNAYRAA-3′. As a positive control and to assay for the quality of the extracted RNA, RT-PCR for rbcL genes was conducted using primers for the Form IA/B of RubisCO as previously described (Wawrik & Paul, 2004) (forward: 5′-TCIGCITGRAACTAYGGTCG-3′ reverse: 5′-GGCATRTGCCAIACRTGRAT-3′).
GeoChip analysis
The GeoChip 3.0 is a functional gene array that contains c. 28 000 probes and includes more than 57 000 gene sequences in 292 gene families (He et al., 2010). GeoChip analyses for both DNA and RNA were performed by amplification of template as described previously (Wu et al., 2006; Gao et al., 2007; Van Nostrand et al., 2009). Hybridizations were performed with a MAUI Hybridization System (BioMicro systems, UT) at 42 °C for 10 h according to the manufacturer's recommended method. The microarray was scanned by ScanArray Express Microarray Scanner (Perkin Elmer, Boston, MA) at 633 nm. ImaGene v. 6.0 (Biodiscovery, El Segundo, CA) was used to estimate spot intensity and identify poor-quality spots. Spots with a signal-to-noise ratio [((signal intensity − background)/standard deviation of background)] < 2.0 were removed as poor quality (He & Zhou, 2008). Mean Cy3 intensity of the universal standards in each subgrid was used to normalize the Cy5 intensity for samples in the same subgrid. The Cy5 intensity after the first normalization was normalized again by the mean value of three technical replicates. In addition, the data were normalized by the mean intensity of universal standards on the Cy3 channel in all slides for Cy5 intensity of the samples. If any of the replicates exceeded twice the standard deviation (signal–mean), the replicate was removed as an outlier, repeating this process iteratively until no such replicates were identified. A minimum of two positive spots were required for each gene to be considered for data analysis. Only spots for which both DNA and RNA signals were observed were considered positive. Combining RNA and DNA data was performed to gain confidence that detected signals originated from sizable and active populations. We acknowledge that rare community members can sometimes be highly active, but given the quantitative limitations of the microarray approach; this was deemed a more conservative approach than analyzing RNA alone.
Results
Samples were taken near Charlotte Harbor, FL, as part of an Ecology of Harmful Algae Blooms (EcoHAB) sampling cruise. A detailed site description, chemical characteristics, nitrogen uptake rates, nitrogen recycling rates, and phytoplankton species composition for the sampling time and location are described elsewhere (Wawrik et al., 2009).
Ambient bacterial species composition was surveyed using 454 pyrosequencing of 16S rRNA gene PCR products, yielding 4114 quality 16S sequences across the V1 and V2 regions of the 16S gene. Binning of sequences at the 97% identify level indicated the presence of 720 bacterial taxa. Keeping in mind that the choice of primers and the number of PCR cycles can influence the final composition of clone libraries (Polz & Cavanaugh, 1998; Acinas et al., 2005), it was observed that dominant among the classifiable sequences were Alpha-, and Gammaproteobacteria, as well as Bacteroidetes, Actinomycetales, and cyanobacteria (Fig. 0001). Most of the alphaproteobacterial OTUs were classified within the Roseobacter as well as within the SAR11 groups. Almost all of the gammaproteobacterial lineages were classified as Oceanospirillales and Alteromonadales. Classifiable cyanobacterial sequences were all associated with the Prochlorococcus and Synechococcus lineages, while those associated with the Bacteroidetes clustered within the Sphingobacteria. The detected Deltaproteobacteria belonged to lineages that could not be identified with confidence beyond the phylum level. Most of the detected Actinobacterial sequences were classified within the Acidimicrobiales. Sequences originated from chloroplasts accounted for 3.6% of the library. Approximately 3% of all quality reads could not be classified at any taxonomic level.
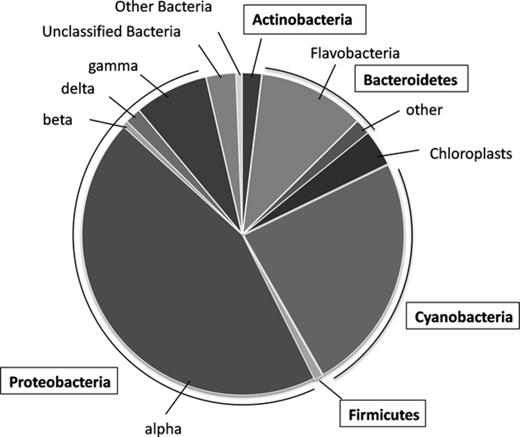
Phylogenetic analysis of bacterial 16S rRNA gene sequences (N = 4114) obtained by 454-based pyrosequencing of 16S PCR products. Class-level phylogenetic distribution is shown.
DNA was extracted from ambient seawater, NTC samples, as well as incubations with 2 μM of 15N ammonium or 2 μM of 15N nitrate, respectively. After ultracentrifugation and fractionation of this DNA, each fraction was examined via TRFLP analysis. The distribution of DNA in CsCl gradients is dependent on G+C content, as well as the degree of isotopic labeling (Buckley et al.,2007a, b; Wawrik et al., 2009). A comparison of the distribution of TRFs between control DNA and ammonium and nitrate treatments was, therefore, conducted to identify TRFs that exhibited DNA density shifts in response to the presence of 15N label (Fig. 0002). TRF analysis implicated four bacterial populations in nitrate uptake, producing the terminal fragments with length of c. 128 nt (Fig. 0002a,b), 151 nt (Fig. 0002c,d), 194 nt (Fig. 0002e,f), and 248 nt (Fig. 0002g,h). TRFs 128 and 151 also exhibited notable density shifts in 15N ammonium incubations, suggesting mixed N nutrition of these bacteria. TRFs 194 and 248 only displayed minor density shifts in the presence of 15N ammonium, suggesting that nitrate, but not ammonium, was utilized as an N source by these bacteria.
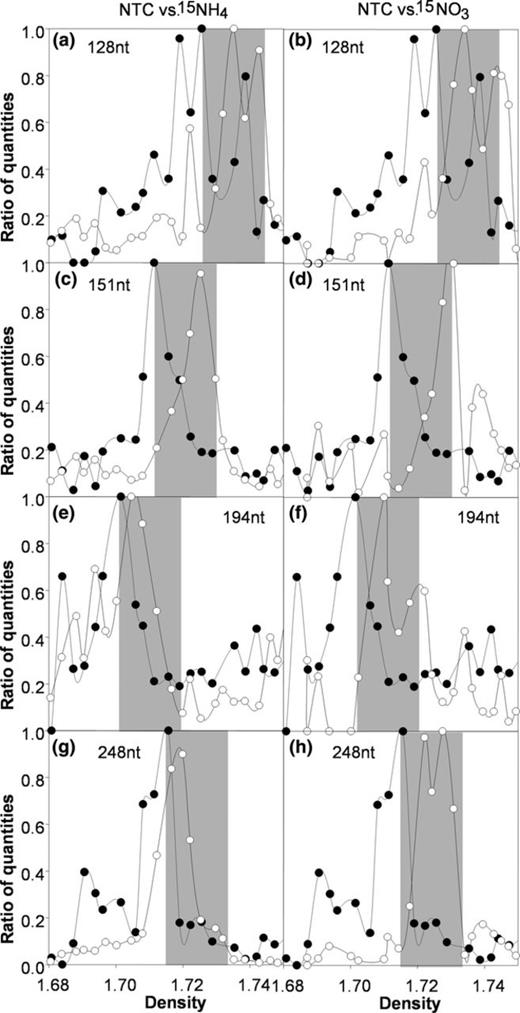
Analysis of TRFs detected in each density fraction of (●) ambient community DNA (NTC = no treatment control) and DNA extracted from bottle incubations with (○) 15N ammonium or 15N nitrate. Fragments for which a density shift was observed were plotted as a function of density (x-axis) and relative peak height (y-axis). Peak height was averaged across ± 1 nt to account for small sizing errors and then normalized to the highest detected signal. The width of gray boxes indicates the expected density shift for 100% labeling of DNA with 15N. The gray boxes are aligned on the left with the maximum peak height of ambient control DNA (NTC). Shown are ratios of quantities, which are calculated by dividing the peak height in each fraction by the highest value measured in any of the fractions obtained in a given CsCl column.
A clone library of full-length 16S PCR products (27F to 1525R) was generated from ambient microbial population (T0) for comparison with TRFLP data, and four hundred clones were sequenced bidirectionally using traditional Sanger sequencing. The resulting data were assembled and analyzed in silico to identify sequences that could produce specific TRFs (Table 0001). Sequences corresponding to the 128, 151, and 248 nt fragments were identified. Sequences that corresponded to the TRF at 128 nt fell within poorly classified alpha- and gammaproteobacterial lineages. One of the four OTUs that matched the TRF at 128 nt was classified within the genus Roseovarius. Allowing for a < 1% sizing error during TRFLP analysis, the fragment at 151nt was ascribed to the sequences in clone libraries producing a 152 nt fragment, which fell within unclassified gammaproteobacterial lineages belonging to the orders Alteromonadales and Oceanospirillales. More prominently, 61 sequence reads assembled into four OTUs that can produce a terminal fragment of 248 nt. These sequences were all classified within the alphaproteobacterial lineage Thalassobacter. Sequences corresponding to the 194 nt fragment were not detected in the library. The 194-bp fragment was, however, a relatively weak signal, compared with other fragments for which density shifts were observed (see Fig. S2). The absence of a corresponding sequence in the clone library was assumed to result from low abundance.
In silico prediction of terminal restriction fragments and phylogenetic classification of cloned 16S rRNA gene fragments
| Class | Order | Family | Genus | Predicted AluI TRF | # of clones |
| Alphaproteobacteria | Unclassified | Unclassified | Unclassified | 66 | 2 |
| Alphaproteobacteria | Unclassified | Unclassified | Unclassified | 72 | 2 |
| Alphaproteobacteria | Rhizobiales | Unclassified | Unclassified | 72 | 1 |
| Alphaproteobacteria | Rhizobiales | Rhodobacteraceae | Thalassobacter | 73 | 1 |
| Bacteroidetes | Uncultured | Unclassified | Unclassified | 73 | 2 |
| Gammaproteobacteria | Legionellales | Coxiellaceae | Coxiella | 74 | 125 |
| Gammaproteobacteria | Unclassified | Unclassified | Unclassified | 74 | 16 |
| Gammaproteobacteria | Unclassified | Unclassified | Unclassified | 74 | 1 |
| Bacteroidetes | Unclassified | Unclassified | Unclassified | 74 | 1 |
| Gammaproteobacteria | Oceanospirillales | Oleiphilaceae | Uncultured | 74 | 1 |
| Gammaproteobacteria | Oceanospirillales | Oleiphilaceae | Uncultured | 82 | 2 |
| Gammaproteobacteria | Pseudomonadales | Moraxellaceae | Acinetobacter | 85 | 1 |
| Gammaproteobacteria | Unclassified | Unclassified | Unclassified | 127 | 1 |
| Alphaproteobacteria | Rhizobiales | Rhodobacteraceae | Roseovarius | 127 | 1 |
| Alphaproteobacteria | Unclassified | Unclassified | Unclassified | 128 | 2 |
| Gammaproteobacteria | Unclassified | Unclassified | Unclassified | 128 | 1 |
| Gammaproteobacteria | Oceanospirillales | Oleiphilaceae | Uncultured | 138 | 2 |
| Alphaproteobacteria | Rhodobacterales | Rhodobacteraceae | Thalassobacter | 139 | 2 |
| Betaproteobacteria | Burkholderiales | Unclassified | Unclassified | 139 | 1 |
| Gammaproteobacteria | Oceanospirillales | Oleiphilaceae | Unculutred | 147 | 1 |
| Gammaproteobacteria | Alteromonadales | Unclassified | Unclassified | 152 | 14 |
| Gammaproteobacteria | Alteromonadales | Unclassified | Unclassified | 152 | 3 |
| Gammaproteobacteria | Alteromonadales | Uncultured | Unclassified | 152 | 2 |
| Gammaproteobacteria | Unclassified | Unclassified | Unclassified | 152 | 1 |
| Gammaproteobacteria | Oceanospirillales | Oleiphilaceae | Uncultured | 152 | 1 |
| Gammaproteobacteria | Unclassified | Unclassified | Unclassified | 152 | 1 |
| Alphaproteobacteria | Rhodobacterales | Rhodobacteraceae | Thalassobacter | 201 | 3 |
| Alphaproteobacteria | Unclassified | Unclassified | Unclassified | 201 | 2 |
| Verrucomicrobia | Unclassified | Unclassified | Unclassified | 201 | 1 |
| Gammaproteobacteria | Oceanospirillales | Oleiphilaceae | Uncultured | 201 | 1 |
| Gammaproteobacteria | Unclassified | Unclassified | Unclassified | 204 | 2 |
| Bacteroidetes | Flavobacteriaceae | Unclassified | Unclassified | 206 | 1 |
| Bacteroidetes | Unclassified | Unclassified | Unclassified | 207 | 2 |
| Cyanobacteria | Chroococcales | Unclassified | Unclassified | 217 | 1 |
| Alphaproteobacteria | Rhodospirillaceae | Unclassified | Unclassified | 221 | 1 |
| Deltaproteobacteria | Unclassified | Unclassified | Unclassified | 232 | 1 |
| Gammaproteobacteria | Oceanospirillales | Uncultured | Uncultured | 234 | 25 |
| Gammaproteobacteria | Oceanospirillales | Oleiphilaceae | Uncultured | 234 | 1 |
| Alphaproteobacteria | Rhodobacterales | Rhodobacteraceae | Thalassobacter | 248 | 56 |
| Alphaproteobacteria | Rhodobacterales | Rhodobacteraceae | Thalassobacter | 248 | 2 |
| Alphaproteobacteria | Rhodobacterales | Rhodobacteraceae | Thalassobacter | 248 | 2 |
| Alphaproteobacteria | Rhizobiales | Rhodobacteraceae | Thalassobacter | 248 | 1 |
| Gammaproteobacteria | Unclassified | Unclassified | Unclassified | 253 | 2 |
| Gammaproteobacteria | Alteromonadales | Endobugula | Uncultured | 273 | 1 |
| Alphaproteobacteria | Rhodobacterales | Rhodobacteraceae | Thalassobacter | 307 | 2 |
| Alphaproteobacteria | Rickettsiales | Uncultured | Unclassified | 352 | 1 |
| Alphaproteobacteria | Rhizobiales | Rhodobacteraceae | Thalassobacter | 391 | 1 |
A secondary aim of this study was to assay for mRNA of assimilatory nitrate reduction genes to corroborate SIP data. It was hypothesized that nitrate-assimilating bacteria would express the gene for the catalytic subunit of assimilatory nitrate reductase, nasA, which has been used in prior studies as the biomarker gene for the detection of nitrate-assimilating bacteria in marine systems (Allen et al., 2001; Adhitya et al., 2007; Cai & Jiao, 2008). These studies demonstrated the presence of nasA genes, but did not provide information regarding expression. We, therefore, analyzed community mRNA via RT-PCR and functional gene microarray analysis. RT-PCR of nasA genes was conducted using previously published primers (Allen et al., 2001). nasA mRNA was not detected, despite repeated amplification attempts and several rounds of PCR optimization (including testing of different primer concentrations, annealing temperatures, template concentrations, and adding excess TAQ polymerase; data not shown). RNA was considered to be of good quality and free of inhibitors, as other genes, such as the large subunit gene of RubisC/O (rbcL), nitrite reductase (nirS), and 16S rRNA gene could be easily amplified by RT-PCR (see Fig. S1). Primers and PCR conditions appeared to be adequate, as nasA genes could readily be PCR amplified and cloned from community DNA (see Fig. S1).
The unexpected lack of nasA mRNA in RT-PCR experiments prompted us to seek confirmation of these data. A secondary approach for mRNA was applied by utilizing the GeoChip 3.0 for mRNA hybridization. The GeoChip functional gene microarray contains probes for many of the key N-cycling genes (Fig. 0003), including nasA. DNA and mRNA hybridization were detected for ureC, nirS, nirK, narG, nosZ napA, nrfA, amoA, and nifH (Fig. 0003, Table 0002), representing key N-transformation genes for urea cycling, denitrification, dissimilatory nitrate and nitrite reduction, as well as N fixation. There was no evidence for the expression of assimilatory nitrate reduction genes, nasA (bacterial) and narB (cyanobacterial). Among the positive N-cycling gene probes (DNA + RNA hybridization signal), 35% originated from the Alpha- and Gammaproteobacteria, corroborating the importance of these two lineages at the site. Other bacterial lineages (Table 0002) implicated in N cycling by the GeoChip belonged to the Beta- and deltaproteobacteria, Clostridia, Aquificales, Halobacteria, and Chloroflexi. Bacterial and archaeal amoA mRNA were detected.
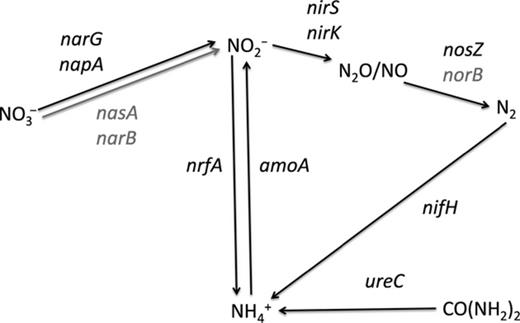
Schematic representation of a partial N cycle and the genes corresponding to pathways represented on the GeoChip 3.0. Black arrows and gene symbols indicate that DNA and mRNA hybridization signals were detected for these genes/pathways. Gray arrows and gray gene names indicate that mRNA was not detected.
DNA and mRNA GeoChip 3.1 analysis of N-cycling genes
| Genbank ID | Gene | Category | Class | Order | Organism | RNA | DNA | RNA/DNA |
| 150029098 | ureC | Ammonification | Alphaproteobacteria | Rhizobiales | Sinorhizobium medicae | 4899 | 4139 | 1.18 |
| 113941017 | ureC | Ammonification | Chloroflexi | Herpetosiphonaceae | Herpetosiphon aurantiacus | 6357 | 22227 | 0.29 |
| 151280243 | ureC | Ammonification | Betaproteobacteria | Burkholderiales | Janthinobacterium sp. | 7030 | 23908 | 0.29 |
| 34494851 | ureC | Ammonification | Halobacteria | Halobacteriales | Haloarcula aidinensis | 22409 | 31262 | 0.72 |
| 67985209 | ureC | Ammonification | Actinobacteria | Actinomycetales | Kineococcus radiotolerans | 66929 | 19056 | 3.51 |
| 57335474 | nirS | Denitrification | Gammaproteobacteria | Alteromonadales | Uncultured sp. | 4775 | 11493 | 0.42 |
| 149783097 | nirK | Denitrification | Alphaproteobacteria | Rhodobacterales | Uncultured sp. | 5138 | 10923 | 0.47 |
| 26278828 | narG | Denitrification | Actinobacteria | Actinomycetales | Uncultured sp. | 5864 | 27759 | 0.21 |
| 41349577 | narG | Denitrification | Halobacteria | Halobacteriales | Haloferax mediterranei | 6549 | 6441 | 1.02 |
| 116634745 | narG | Denitrification | Deltaproteobacteria | Desulfuromonadales | Uncultured sp. | 7589 | 9401 | 0.81 |
| 29125972 | nosZ | Denitrification | Gammaproteobacteria | Pseudomonadales | Uncultured sp. | 8061 | 7608 | 1.06 |
| 63081994 | nosZ | Denitrification | Alphaproteobacteria | Rhodospirillales | Uncultured sp. | 10543 | 14274 | 0.74 |
| 26278770 | narG | Denitrification | Betaproteobacteria | Burkholderiales | Uncultured sp. | 20703 | 51300 | 0.4 |
| 124488145 | napA | Dissimilatory N reduction | Aquificales | Hydrogenothermaceae | Uncultured sp. | 10912 | 7703 | 1.42 |
| 127511439 | nrfA | Dissimilatory N reduction | Gammaproteobacteria | Enterobacteriaceae | Shewanella loihica | 12646 | 5930 | 2.13 |
| 124488141 | napA | Dissimilatory N reduction | Gammaproteobacteria | Enterobacteriaceae | Uncultured sp. | 16142 | 14382 | 1.12 |
| 109645564 | nrfA | Dissimilatory N reduction | Clostridia | Clostridiales | Desulfitobacterium hafniense | 20143 | 28867 | 0.7 |
| 19481356 | amoA | Nitrification | Betaproteobacteria | Nitrosomonadale | Uncultured sp. | 4674 | 8923 | 0.52 |
| 82570859 | amoA | Nitrification | Unclassified Crenarcheota | Unclassified | Uncultured sp. | 5295 | 10711 | 0.49 |
| 95116083 | amoA | Nitrification | Unclassified Crenarcheota | Unclassified | Uncultured sp. | 9364 | 10400 | 0.9 |
| 44829089 | nifH | Nitrogen fixation | Clostridia | Clostridiales | Uncultured sp. | 7026 | 35833 | 0.2 |
| 148568718 | nifH | Nitrogen fixation | Chloroflexi | Chloroflexales | Roseiflexus sp. | 11549 | 9975 | 1.16 |
| 3157608 | nifH | Nitrogen fixation | Alphaproteobacteria | Rhizobiales | Uncultured sp. | 20649 | 5284 | 3.91 |
Fluorescence signal detected during GeoChip 3.1 analysis. Only those spots for which both DNA and RNA signal were detected were considered positive.
Discussion
15N-based DNA SIP is an emerging methodology for testing hypotheses with respect to microbial N cycling in the environment. The technique allows for the interrogation of N nutrition of specific microbial populations and has been applied to identify novel diazotrophic bacteria in soil (Buckley et al.,2007a, b), to study N uptake by Synechococcus and diatoms in marine systems (Wawrik et al., 2009), and to study N utilization by bacteria in petroleum-contaminated arctic soils (Bell et al., 2011). The aim of the current study was to apply a community-based 15N SIP approach to identify bacterial populations in a coastal, subtropical, marine environment that were actively utilizing N in the form of nitrate.
An important limitation of SIP studies is the potential for ‘cross-feeding’, where N in one form is transformed, through any number of processes, into another form. It is possible, for example, that some of the 15N label in 15N nitrate amendments could have been converted to 15N ammonium via remineralization of particulate organic nitrogen (PON). The degree to which cross-feeding is a problem, however, is dependent on the question being addressed. Generally, if only the final fate of N substrates (i.e. ammonium or nitrate) is in question, then cross-feeding is not an issue. The approach used here traces the transfer of N into bacterial DNA, irrespective of the actual form of the N when it was taken up. More specifically, if one seeks to define which N substrates are utilized, then the results can be more ambiguous and additional measurements are helpful. With respect to the bacterial community studied here, the fate of the added 15N nitrate is clear – uptake into DNA. To address the more specific concern, the following case can be made that the effect of ‘cross-feeding’ on SIP data was likely minor and that direct nitrate uptake by bacteria was indeed occurring. The concentration of PON was 5.78 μmol N L−1, while the nitrate uptake rate was 0.065 μmol N L−1h−1. After 24 h of incubation, 15N could, therefore, account for at most 27% of total PON. Given a 0% labeled PON pool at T0 and 27% labeling at the end, it follows that c. 0.27 μmoles of 15N ammonium could have been produced, given the measured ammonium regeneration rate of 0.082 μM N h−1 (Wawrik et al., 2009). The result would be that about 15% of total ammonium uptake could originate from recycled 15N, which is less than the observed density shifts observed in 15N nitrate treatments. In addition, at least two of the observed fragments (TRFs 194 and 248) increased in density in the presence of 15N nitrate, but not in the presence of 15N ammonium. While replicates would be helpful for statistical comparison of nitrate and ammonium treatments, the data indicate that 15N nitrate conversion to ammonium was likely a minor contributor to density shifts. If nitrate was first converted to ammonium, TRFs 194 and 248 would be equally labeled in 15N ammonium and 15N nitrate treatments, as the actual microbial activity observed would be ammonium uptake.
SIP analysis implicates several poorly classified marine gammaproteobacterial lineages, as well as the alphaproteobacterium Thalassobacter in nitrate uptake. Thalassobacter belongs to the Alphaproteobacteria and is closely related to the marine Roseobacter species. Alphaproteobacteria are well known to be important components of marine bacterioplankton, and sequences belonging to this lineage often make up a sizable percentages of 16S clone libraries; for example, in two libraries from the coastal Pacific (coast of California), 55% of sequences was classified as Alphaproteobacteria, and FISH analysis indicated that this group accounted for 3–34% of DAPI countable cells (Cottrell & Kirchman, 2000). Within the Alphaproteobacteria, distinct lineages have been demonstrated to be particularly abundant. Sar 11 (Pelagibacter ubique), for example, can account for 50% of the bacterioplankton in the open ocean (Morris et al., 2002). Similarly, the Roseobacter group can account for 10–20% of bacterial populations, particularly in coastal marine environments (Gonzalez & Moran, 1997; Moran et al., 2007). Nitrate utilization genes can be identified in the genomes of species belonging to the Roseobacter group, including Sulfitobacter sp., Roseovarius sp., Roseobacter sp., and Octadecabacter sp. They are also absent from the genomes of other Roseobacter species, notably Silicibacter (Moran et al., 2007). Thalassobacter sp. was first isolated from a site in the Mediterranean Sea (Macian et al., 2005) and is strictly aerobic, bacteriochlorophyll a-containing, and heterotrophic, with a wide salinity tolerance range (0.85–7%). It utilizes pyruvate and acetate, but is unable to utilize simple sugars as growth substrates. The ability to reduce nitrate to nitrite is absent from the type strain, and denitrification has not been observed (Macian et al., 2005). Genomic information is not available for bacteria within this genus, and confirmation of the presence of a nitrate-reducing complex can, therefore, not be obtained. Data described here, however, suggest that N from nitrate was incorporated into Thalassobacter DNA in the environment, suggesting that different ecotypes of Thalassobacter may exist.
Prior studies describing the diversity of assimilatory nitrate reductase genes (nasA/narB) in marine environments revealed the presence of cytophagal, cyanobacterial, clostridial, and proteobacterial lineages (Allen et al., 2001; Adhitya et al., 2007; Cai & Jiao, 2008). Alphaproteobacterial lineages were among those detected (Adhitya et al., 2007; Cai & Jiao, 2008), but Gammaproteobacteria typically represent the bulk of the nasA gene diversity. Within the Gammaproteobacteria, the Alteromonadales appear to be a particularly dominant group (Adhitya et al., 2007; Cai & Jiao, 2008). In line with prior reports for this lineage, SIP data described here (TRF at 151 nt) also suggest that Alteromonadales are relevant in nitrate uptake. Alteromonadales are primarily associated with marine environments where they can be facultatively anaerobic and occur across a wide range of oceanic conditions, including sea ice, surface water, and deep sea sediments (Bowman & McMeekin, 2005). The type strain, Alteromonas macleodii, does not appear to utilize nitrate (Bowman & McMeekin, 2005), but a search of the two available genomes (A. macleodeii ATCC 27126, and ‘Deep Ecotype’) indicates the presence of a nitrate reduction operon that includes nitrate reductase, nitrite reductase, as well as an ABC-dependent nitrate/nitrite transporter.
Despite observations from SIP experiments, which suggest that N from 15N nitrate is readily incorporated into the DNA of several bacterial populations, no evidence for the expression of nasA genes was observed using the two different approaches. Several factors may have contributed to this observation. First, it is possible that nasA PCR primers used for RT-PCR contain sequence mismatches to relevant bacteria at our study site. The primers were originally designed on the basis of sequences from Gammaproteobacteria, Bacteroidetes, and Cytophaga (Allen et al., 2001). Marine alphaproteobacterial nasA sequences were not available at the time, but a comparison of the nested primer pairs to nasA sequences of Roseobacter sp. MED193, Roseovarius sp. 217, and Octadecabacter antarcticus 307 indicates that only a single mismatch exists in one of the four primers (nas1933). Furthermore, the primers have been successfully employed to amplify nasA from a wide range of environmental bacteria and locations, including a Norwegian fjord, the Barents Sea, the Skidaway River, the South Atlantic Bight, the North Pacific Gyre, and the South China Sea (Allen et al., 2001; Cai & Jiao, 2008). We, therefore, expect that primer biases were of minor importance. Support for this assumption is provided by the observation that nasA mRNA was also not observed using the GeoChip. Detection by hybridization is typically less sensitive to biases introduced by single base-pair mismatches. Although the GeoChip cannot be considered to be a comprehensive array with respect to marine environments, it does contain a sizable number of relevant N-cycling gene probes from a diversity of important marine species. The array contains 106 assimilatory nitrate reductase gene probes (See Table S2). Of these, 82 are of marine origin, including nasA genes from alpha-, beta-, and gammaproteobacteria (53 probes), as well as several marine cyanobacterial narB gene sequences (29 probes). Included are probes representing several Roseobacter strains as well as sequences detected in several environmental surveys (Allen et al., 2001; Adhitya et al., 2007; Cai & Jiao, 2008). The array, therefore, represents a relatively comprehensive representation of known marine nasA/narB sequences. Parallel analysis via the GeoChip and RT-PCR amplification should, therefore, be sufficiently sensitive to detect nasA mRNA from relevant marine Alpha- and Gammaproteobacteria.
Disparate observations between SIP and mRNA experiments might be explained by active denitrification as evidenced by mRNA signals for denitrification genes (nirS, nirK, and nosZ), which were readily detected by RT-PCR and GeoChip analysis. Denitrification proceeds via nitrite as a shared intermediate in both assimilatory and dissimilatory nitrate reduction pathways. mRNA for both the periplasmic and membrane-bound nitrate reductase genes (napA and narG, respetively) was detected. Dissimilatory nitrate reduction could, therefore, provide a continuous supply of nitrite for both denitrification and further assimilatory N reduction to ammonium. Under such circumstances, bacterial populations capable of regulating assimilatory nitrate vs. nitrite reduction genes would gain an energetic advantage. Dissimilatory nitrate reduction (denitrification), as a metabolic trait, is widely distributed among facultatively anaerobic bacterial and archaeal species. Historically, denitrification is, therefore, understood as a process that primarily occurs across aerobic/anaerobic interfaces (Zehr & Ward, 2002). It has, however, been reported that denitrification can occur in the presence of atmospheric levels of O2 in the alphaproteobacterium, Paracoccus pantotrophulus (Robertson et al., 1995,). Similar observations have been made in a strain of Pseudomonas stutzeri (Su et al., 2001), suggesting that this trait may be more widely distributed. The environmental significance of aerobic denitrification remains unclear (Zehr & Ward, 2002), but GeoChip analysis in this study indicated mRNA transcription of several denitrification genes (Table 0002) in Alpha- and Gammaproteobacteria.
Nitrogen reduction via dissimilatory nitrate reduction to ammonium (DNRA) has also been reported for some marine systems. The importance of DNRA as a nitrate sink is traditionally only recognized for sediments with high organic loading (Christensen et al., 2000). The process is, therefore, typically considered to be most relevant in coastal sediment (Bonin et al., 1998), and it has been suggested that it is unlikely to occur in the water column (Zehr & Ward, 2002). More recently, however, DNRA has been observed in the Peruvian oxygen minimum zone (Lam et al., 2009). 15N ammonium was produced during 15N-nitrogen oxide incubations, and high levels of nrfA mRNA were detected. nrfA encodes a cytochrome c nitrite reductase (Einsle et al., 1999) and is considered to be the functional biomarker gene for DNRA (Lam et al., 2009). We also detected nrfA mRNA in the current study (Table 0002). Another potential pathway for N from nitrate to ammonium is anammox (Kartal et al., 2007). Kuenia stuttgartiensis reduces nitrate to nitrite and ammonium, and then subsequently utilizes both of these substrates in the anammox process. Neither DNRA nor anammox, however, are likely to be the key mechanisms behind 15N incorporation from nitrate into DNA observed in SIP analysis. Ammonium generated by anammox bacteria is converted to N2 gas, and is therefore not available for assimilation by other community members. Further, any DNRA or ammonium release by anammox would be detected as part of the measured ammonium regeneration rates (see Discussion of N recycling and cross-feeding earlier).
Overall, these observations speak to the complexity of N flow in marine systems and the fact that individual N transformation processes are often tightly linked. The present study applies 15N-based DNA SIP to pelagic marine bacterial communities and provides evidence for the uptake of N from nitrate into several proteobacterial lineages, notably Thalassobacter and Alteromonadales. mRNA data presented here, however, highlight the importance of multiple experimental approaches to understand N flow dynamics. 15N-based DNA SIP measurements are well suited to addressing questions regarding the N cycle and the fate of different N substrates, but are greatly informed by an integrated approach that includes targeted 15N tracer studies and other molecular techniques conducted in parallel.
Acknowledgements
The authors thank the crew of the R/V Pelican for providing excellent shipboard support. Cruise time was supported by a grant from the NOAA ECOHAB program via NA 06 NOS4780246 to D.B. This work was supported by National Science Foundation grants OCE-0961900 to B.W. and OCE-0960806 to D.A.B. GeoChip analysis was supported by ENIGMA through the Office of Science, Office of Biological and Environmental Research, of the U.S. Department of Energy under Contract No. DE-AC02-05CH11231. This is contribution number 3187 of the Virginia Institute of Marine Science, The College of William and Mary.
References
Supporting Information
Additional Supporting Information may be found in the online version of the article:
Fig. S1. RT-PCR of N-cycling genes.
Fig. S2. Example of heat map used to identify DNA from bacterial populations that exhibits density shifts in the presence of 15N label.
Table S1. Complete list of probes that displayed positive hybridization signals for DNA and RNA during GeoChip 3.1 analysis.
Table S2. Probes for assimilatory nitrate reductase genes (nasA/narB) on the GeoChip 3.1.
Table S3. Comparison of 16S rRNA gene sequence library data obtained by 454 and Sanger sequencing.
Please note: Wiley-Blackwell are not responsible for the content or functionality of any supporting materials supplied by the authors. Any queries (other than missing material) should be directed to the corresponding author for the article.
Author notes
Editor: Tillmann Lueders
