


Abstract
The tree pathogenic fungi Heterobasidion annosum s.s. and Heterobasidion parviporum cause root and butt rot in Norway spruce (Picea abies) and produce serious economic losses to the forest sector in Europe. We experimentally studied inter- and intraspecific differences between H. parviporum and H. annosum s.s. in the way they infect stumps and spread into neighbouring trees. Eleven H. parviporum and nine H. annosum s.s. isolates were artificially inoculated on stumps of two spruce stands after first thinning. After 15 years, the same isolates were reisolated from neighbouring trees. Heterobasidion parviporum spread more frequently from the inoculated stumps to the neighbouring trees than H. annosum s.s. The surroundings of H. annosum s.s. stumps that did not spread were often colonized by H. parviporum. Heterobasidion annosum s.s. spread was restricted mainly to the areas of the plot where no other Heterobasidion genotypes had been inoculated. In such cases, H. annosum s.s. tended to develop into bigger genets than H. parviporum. The probability of stump-to-tree spread of H. parviporum depended on the diameter of the stumps, suggesting that H. parviporum spread may relate to the presence of heartwood. Both H. parviporum and H. annosum s.s. proved to be strong pathogens on Norway spruce; however, when competing for the same trees, H. parviporum seemed capable of excluding H. annosum s.s. from the stand.
Introduction
The genus Heterobasidion includes several root and butt rot pathogenic species causing significant economical losses to the forest sector in the Northern Hemisphere (Woodward et al., 1998). In Europe, there are three partially intersterile biological species: Heterobasidion annosum sensu stricto (Fr.) Bref., Heterobasidion parviporum Niemelä & Korhonen and Heterobasidion abietinum Niemelä & Korhonen. The different Heterobasidion species tend to occur more frequently on certain tree species suggesting host specialization (Korhonen & Stenlid, 1998), which is supported by phylogenetic reconstruction of the evolutionary history of this fungus (Johannesson & Stenlid, 2003; Linzer et al., 2008). Host specialization has also been suggested to act as a postzygotic isolation mechanism, increasing reinforcement due to the low fitness of hybrids between species specialized in different hosts (Olson & Stenlid, 2001; Garbelotto et al., 2007).
Root and butt rot caused by H. parviporum and Heterobasidion annosum s.s. in Norway spruce [Picea abies (L.) Karst.] results in severe economic losses to Scandinavian forestry (Bendz-Hellgren et al., 1998). Both H. annosum s.s. and H. parviporum cause the same disease to Norway spruce but they differ in their range of hosts and pathogenicity, and they also seem to have fundamental metabolism differences (Johansson et al., 1998, 1999; Asiegbu, 2000; Maijala, 2000). Heterobasidion parviporum is considered a primary pathogen mostly causing root and butt rot on a single tree species, Norway spruce. On the other hand, H. annosum s.s. is a generalist primary pathogen, which, according to Johansson (2004), seems to have more pathogenic characters than H. parviporum. It occurs on a wide range of hosts, including broadleaf and conifer species, although its damages are particularly severe on pines, typically Scots pine (Pinus sylvestris L.). While H. annosum s.s. can produce root and butt rot in spruce trees and mortality and necrosis to spruce seedlings, the virulence of H. parviporum on pines is low as suggested by greenhouse experiments (Stenlid & Swedjemark, 1988; Swedjemark et al., 1999; Werner & Łakomy, 2002a, b) and field observations (Korhonen, 1978; Korhonen & Piri, 1994; Gonthier et al., 2003). Heterobasidion annosum s.s. and H. parviporum coexist in sympatry with their respective hosts in extensive forested areas of Central Europe; however, in Scandinavia they differ in their geographical distribution. Heterobasidion parviporum has been observed in Northern Finland (68°N in Korhonen et al., 1998) covering the area where both spruce and pine are distributed (Bendz-Hellgren et al., 1998), while H. annosum s.s. seems restricted to its southern part (northern record at 64°N; Finland).
Controversy exists concerning the epidemiology of the two pathogens in spruce stands. Korhonen & Piri (1994) observed that spruce stumps appeared to be more frequently infected by H. parviporum than by H. annosum s.s.; thus, stumps could be considered species selective. Gonthier (2003) observed that whereas spruce stumps were infected by both H. annosum s.s. and H. parviporum, tree-to-tree spread was mostly dominated by H. parviporum. Gonthier (2003) concluded that stumps were species neutral and that standing trees were species selective, as suggested earlier by Harrington (1989). Supporting a higher adaptation of H. parviporum to infect living trees, Vasiliauskas & Stenlid (1998) observed that H. parviporum would reach a higher height in the stem than H. annosum s.s. The capacity of spread within tree and stump root systems plays is a key role when making simulations of the disease (Pukkala et al., 2005). Understanding whether both species behave differently on Norway spruce stands can improve the predictions of the economic losses they could cause.
Most of the data available are observational; thus, stump-to-tree and tree-to-tree spread of H. parviporum and H. annosum s.s. needs to be studied experimentally. Wellendorf & Thomsen (2008) studied the spread of one isolate of H. annosum s.s. and one isolate of H. parviporum after 5 years, yet intraspecific variation should also be considered. Under natural conditions, airborne spores of both species are able to infect stumps created after harvesting and thinning operations. Once the stump is infected, the fungus spreads to neighbouring trees by means of root contacts (Redfern & Stenlid, 1998). The prevalence of a certain species on the stand may be explained by the quantity of airborne inoculum at the time of the thinning (Stenlid, 1994; Möykkynen et al., 1997), but it may also reveal differences between H. annosum s.s. and H. parviporum in the capacity to infect stumps and spread within the roots of trees and stumps. A faster spore germination and subsequent colonization of the roots of a certain species would confer a decisive advantage against the other when competing for the host (Stenlid & Rayner, 1989).
The present study aimed to experimentally describe the inter- and intraspecific spread patterns of H. annosum s.s. and H. parviporum in Norway spruce stands.
Materials and methods
Experimental design
The experiment was conducted in two stands located in Southern Sweden (Bertilstorp 55°45′57″N 14°3′15″E and Christinehof 55°42′15″N 14°6′25″E) at an elevation of 125 and 116 m above sea level and site indices of 32.9 and 34.9, respectively (Oliva et al., 2008). The stands were first-rotation P. abies plantations established on a former agricultural land. A thorough description of the stand's characteristics can be found in Oliva et al., (2008). At the tree age of 25 years, the first commercial thinning was conducted in the summer and three treatments were randomly applied on two 20 m × 20 m plots in each location: (1) Natural infection: no treatment applied, and therefore stumps were subjected to natural infection; (2) 50% infection: Half of the stumps were artificially infected with H. annosum s.l. conidia and the other half were protected with urea (50% infection, hereafter); and (3) 100% infection: all stumps were artificially infected with H. annosum s.l. conidia (100% infection, hereafter). One replicate of each treatment was grouped in a block within every location. Artificial infections were carried out with conidia of 11 H. parviporum isolates and nine H. annosum s.s. isolates (Table 1). The conidial suspensions were prepared as described by Bendz-Hellgren & Stenlid (1998). Every stump received conidia of a particular genotype from a single Petri dish, which was diluted in 1–41 mL of water depending of the size of the stump (bigger stumps received more diluted conidia suspensions). Conidia were spread with a syringe, and every stump received between 1 and 20 million spores. Plots subjected to 50% infection treatment typically included one inoculation of every isolate, while plots subjected to 100% infection treatment included one to three inoculations of every isolate. Immediately after conidia spreading, stumps were covered with a plastic bag, which was removed 5 days later. The position of stumps and trees was recorded with 0.1 m precision. Before the first thinning, the diameter at breast height of the trees was measured twice in two perpendicular directions. The position of measurement was permanently marked. Of the original 16 plots, two plots, one 50% infection-treated plot and one 100% infection-treated plot, had to be excluded from the experiment due to severe storm damage. A total of 179 first-thinning stumps were artificially inoculated. Before the first thinning, the plots had on average 1875 trees ha−1 in Bertilstorp and 2167 trees ha−1 in Christinehof.
Isolates used for artificial infection and average values of pathogenicity measures (Table 2)
| Species | Isolate | Origin | Host | Coordinates | Stump- to-tree spread (%) | Severity of stump- to-tree spread (%) | Number of trees infected surrounding the stump (trees) | Genet size (trees) | Maximum distance covered (m) | Periodic increment (% respect initial diameter) |
| H. parviporum | Br 228 | Brynge, Sweden | P. abies | 63°15′N 18°20′E | 70.2 abc | 92.9 | 1.75 | 1.99 | 2.71 | 77.5 |
| Fr 141 | Frossarbo, Sweden | P. abies | 60°03′N 17°25′E | 86.6 a | 72.7 | 1.47 | 1.72 | 2.29 | 70.7 | |
| Fr 154 | Frossarbo, Sweden | P. abies | 60°03′N 17°25′E | 59.6 abcd | 77.8 | 1.26 | 1.34 | 1.96 | 65.3 | |
| Fr 189b | Frossarbo, Sweden | P. abies | 60°03′N 17°25′E | 11.2 ef | 100.0 | 2.16 | 2.18 | 3.21 | 71.0 | |
| Rå 65 | Rånäs, Sweden | P. abies | 59°48′N 18°18′E | 63.3 abcdf | 85.7 | 2.64 | 3.01 | 4.23 | 41.8 | |
| Rb 175 | Ramsåsa, Sweden | P. abies | 55°33′N 13°51′E | 78.0 af | 81.8 | 1.41 | 1.48 | 2.44 | 73.4 | |
| Rb 94 | Ramsåsa, Sweden | P. abies | 55°33′N 13°51′E | 74.7 abf | 91.7 | 1.93 | 2.20 | 2.80 | 72.5 | |
| Sä 150 | Sätuna, Sweden | P. abies | 59°44′N 18°32′E | 61.9 abcd | 61.5 | 1.82 | 1.94 | 2.74 | 67.4 | |
| Sä 177 | Sätuna, Sweden | P. abies | 59°44′N 18°32′E | 49.6 abcde | 40.0 | 1.04 | 1.09 | 2.14 | 74.7 | |
| Sä 182 | Sätuna, Sweden | P. abies | 59°44′N 18°32′E | 67.1 abcd | 80.0 | 1.44 | 1.51 | 2.05 | 65.1 | |
| Sä 30 | Sätuna, Sweden | P. abies | 59°44′N 18°32′E | 67.5 abcdf | 78.6 | 1.76 | 1.98 | 2.92 | 63.6 | |
| H. annosum s.s. | Mj 20 | Mjölby, Sweden | P. sylvestris | 58°19′N 15°07′E | 29.3 bcdef | 60.0 | 1.67 | 1.51 | 1.76 | 57.3 |
| Mj 65 | Mjölby, Sweden | P. sylvestris | 58°19′N 15°07′E | 21.7 def | 100.0 | 2.17 | 2.25 | 2.12 | 35.8 | |
| Mj 87 | Mjölby, Sweden | P. sylvestris | 58°19′N 15°07′E | 44.1 abcde | 85.7 | 1.40 | 1.34 | 2.21 | 61.5 | |
| Rb 136 | Ramsåsa, Sweden | P. abies | 55°33′N 13°51′E | 56.3 abcde | 93.3 | 2.50 | 2.92 | 3.77 | 54.6 | |
| Rb 200 | Ramsåsa, Sweden | P. abies | 55°33′N 13°51′E | 22.2 cdef | 85.7 | 3.25 | 3.37 | 3.44 | 77.6 | |
| Rb 245 | Ramsåsa, Sweden | P. abies | 55°33′N 13°51′E | 37.5 abcdef | 81.8 | 3.39 | 3.48 | 2.45 | 61.4 | |
| Rb 82 | Ramsåsa, Sweden | P. abies | 55°33′N 13°51′E | 8.4 f | 66.7 | 2.29 | 1.87 | 1.94 | 51.4 | |
| Sä 16 | Sätuna, Sweden | P. abies | 59°44′N 18°32′E | 10.9 e | 33.3 | 1.08 | 1.16 | 2.17 | 56.7 | |
| Sä 34 | Sätuna, Sweden | P. abies | 59°44′N 18°32′E | 10.5 ef | 66.7 | 2.16 | 2.18 | 2.88 | 64.7 |
Identical letter shows a conservative grouping of means according to Fisher's protected least significant difference method at P<0.05. All isolates had been isolated from standing living trees.
Fungal isolation
In April 2007, all trees were observed for the presence of rot at stump height by extracting wood cores by means of an increment borer. If the first wood core was not rotten, trees were drilled again at stump height perpendicularly to the first assessment. The increment borer was sterilized with ethanol after every drilling. Rotten wood cores were kept in sterile plastic bottles in the dark at room temperature for 1 month and observed regularly for the presence of H. annosum s.l. conidiophores. Conidia from the rotten cores were picked with a needle and transferred onto a Petri dish containing Hagem agar medium (Stenlid, 1985). In 2005 and 2007, two severe storms affected the experiments; trees were wind-thrown and a second thinning was performed in some of the plots with no significant intensity differences between locations and treatments (Oliva et al., 2008). A conspicuous H. annosum s.l. fruiting was observed on these stumps, and so fruiting bodies were also collected. Pieces of the tissues were excised aseptically, cultured in Hagem agar medium with cloramphenicol (0.2 g L−1) and later retransferred to fresh Hagem medium. Both dead and living trees were observed for the presence of H. annosum s.l. fruiting bodies. No fruiting bodies were observed in living trees. Only one isolate was retained from every tree and stump, because one genotype is typically observed per tree (Swedjemark & Stenlid, 1993).
After the 2007 isolation campaign, H. annosum s.l. was identified in 24% of rotted trees (Oliva et al., 2008). A second isolation campaign was carried out in December 2008. Rotten trees whose wood cores did not yield any mycelium growth in 2007 were drilled three times in 2008. At this isolation attempt, two wood cores were extracted at 1.5 m stem height and one wood core was extracted at 1 m from the ground. The higher drilling points aimed for more active mycelia (Stenlid & Wästerlund 1986). Wood cores were stored in plastic bottles and placed in culture during the same day in the same media used for fruiting body isolation. Isolation from stumps or dead trees was also performed again in 2008.
Isolate tracking and mapping of the genets
Molecular fingerprinting using microsatellites was performed for 71 isolates originating from the most infected plots (100% infection-treated plots) of both locations and from the naturally infected plot with the highest rot incidence. The molecular fingerprint of these isolates was compared with the molecular fingerprint of the inoculated strains. The inoculated strains were kept in glass bottles during the years of the experiment in the fridge at 4–6 °C and were successfully regenerated in Hagem medium in 2008. DNA was extracted from 0.5 cm2 of H. annosum s.l. mycelia growing in Hagem medium using a cetyltrimethylammoniumbromide-based method (Kåren et al., 1997). Six microsatellite loci (Ha-ms1, Ha-ms2, Ha-ms4, Ha-ms6 and Ha-ms10) were amplified using the fluorescent-labelled primers and the cycling conditions described in Johannesson & Stenlid (2004). Taxon-specific competitive-priming PCR (TSCP-PCR) was used for typing the isolates as H. annosum s.s. and H. parviporum as in Gonthier (2003). Products were electrophoresed and analysed by genemarker hid software version 1.7 (State College, Pennsylvania). Microsatellite classification was confirmed by somatic compatibility tests (Stenlid, 1985). Only one microsatellite locus (Ha-ms1) could be consistently amplified for H. annosum s.s. isolates; hence, the molecular fingerprinting included only the H. parviporum isolates (50 isolates).
The remaining 207 isolates were grouped in genets by means of somatic compatibility tests. In naturally infected plots, the genets were mapped by crossing the isolates all-against-all and observing the somatic incompatibility interaction (Stenlid, 1985). Genets were confirmed with a second round of pairings. Isolates and genets from the same plot were sorted into different Heterobasidion species-groups according to the morphology of the interaction zone. The isolates from the group with fewer isolates (typically corresponding to H. annosum s.s.) and the isolates that could not be clearly assigned into a species-group were typed by TSCP-PCR as described above. In artificially infected plots, a sequential approach was adopted. First, every isolate was crossed twice with other isolates collected from nearby trees or stumps and with the original isolates artificially introduced in nearby stumps. Those isolates not matching any of the nearby-collected or nearby-inoculated isolates were then crossed twice with all artificially inoculated isolates belonging to the same Heterobasidion species as the unknown-origin isolate.
We attempted the reconstruction of the infection pathways using the system in Fig. 1. We assumed that genets of the artificially introduced isolates originate from the closest stump that had been artificially infected with the same isolate. Decayed trees whose genotype was not identified were used for filling gaps between artificially infected stumps and distant decayed trees with the same genotype. Pathways involving longer stump-to-tree distances were preferred over pathways involving longer tree-to-tree distances (Bendz-Hellgren et al., 1999); likewise pathways involving first-thinning stumps were preferred over pathways involving living trees (Piri & Korhonen, 2008).
System used for reconstructing the pathway of infection from artificially infected stumps into the surrounding trees. Trees were assumed in a grid. From artificially infected first-thinnings stumps (‘a’ or ‘g’), infection was supposed to spread first within a 3 × 3 tree matrix. Beyond these 3 × 3 trees, two types of spread are possible: if the tree is located in the corner (b), five trees may be infected (dashed line); if the tree is located on the side (c), three trees may be infected. Always the shortest pathway was selected, i.e. ‘d’ was selected over ‘b’. Stump-to-tree pathways were preferred over tree-to-tree pathways (e). Trees/stumps decayed, but without fungal isolation, and located within a pathway of infection were also assumed to be infected by that isolate (e) and included in the calculations of the variables ‘number of trees colonized in the surrounding of the stump’ and ‘severity of stump-to-tree spread’. This same criterion also included first-thinning stumps (f). When not involved in an infection pathway, decayed trees without isolation were not assigned to any genet (g). According to Table 2, the isolate ‘x’ would have the following values for the variables stump-to-tree spread, severity of stump-to-tree spread, number of trees colonized in the surrounding of the stump and genet size: 1, 5/6, 5 and 6, respectively. The isolate ‘y’ would have 1,1/2, 1 and 1, respectively.
Statistical analysis
Interspecific differences were studied by comparing H. annosum s.s. and H. parviporum in terms of stump-to-tree spread, severity of stump-to-tree spread, number of trees colonized in the surroundings of the stump, genet size, maximum distance covered and periodic increment of the infected trees (Table 2) considering artificially infected plots (50%-conidia-treated and 100%-conidia-treated plots). The model included the fixed factors: treatment (50% conidia and 100% conidia), Heterobasidion species (H. annosum s.s. and H. parviporum) and the interaction between the treatment and the Heterobasidion species. The block nested to the location was included as a random factor. Given a particular species, the particular isolate was considered as a random representative of the population of isolates of that species, and it was included in the model as a random factor. When natural infected plots were included in the analysis, we used the same model as when studying only artificially infected plots but we did not include the particular isolate as a random factor. We could not compare artificial and natural infected treatments in terms of stump-to-tree spread because we had no information on the stumps that were infected in natural infection plots or the species that was infecting the stumps. The location was included as a fixed factor when natural infection plots were also included in the analysis. Periodic increment comparisons were performed with and without including healthy trees. We studied the effect of artificial inoculation vs. natural infection, by comparing the natural infected plots with the 50% infection, and the 100% infection-treated plots in terms of genet size and proportion of H. parviporum vs. H. annosum s.s. (% of rotten trees infected by H. parviporum). Fixed effects were tested with the number of degrees of freedom according to the Kenward–Roger correction.
Description of the studied variables
| Variable | Description |
| Stump-to-tree spread | Binary variable; it measured whether the artificial infection of a certain stump spread into neighbouring trees (1) or not (0). |
| Severity of stump-to-tree spread | Expressed the proportion of trees around the artificially infected stump colonized by the inoculated isolate. Only stumps from which spread has been observed were considered. It included trees assumed colonized following the system in Fig. 1 without H. annosum s.l. isolation. |
| Number of trees colonized in the surroundings of the stump | Expressed the number of trees around the artificially infected stump colonized by the inoculated isolate. It included trees assumed colonized following the system in Fig. 1 without H. annosum s.l. isolation. |
| Genet size | Expressed the total number of trees in the plot infected by the same isolate originating from the same artificially infected stump. Only trees from which the same isolate was reisolated were considered. |
| Maximum distance covered | Maximum distance covered by the isolate from the stump in which it was artificially inoculated. Cartesian distances calculated based on the reconstruction of the infection pathway (Fig. 1). |
| Periodic increment | Percent increment of diameter since the start of the experiment. Increment relative to the initial diameter. Only H. annosum-infected trees were considered. For intraspecific analysis, only trees from which the same isolate has been reisolated were considered. |
Trees were assumed to be in a grid; thus, stumps were surrounded by eight trees. Healthy trees and trees infected by the same isolate were considered suitable to be infected and thus included in the calculation. First-thinning stumps, missing trees, trees decayed by unidentified isolates and trees decayed by other fungi/genotypes were excluded from the calculation.
We explored intraspecific differences using the same dependent variables as for interspecific differences (Table 2). In this case, the particular isolate was considered a fixed factor. Not enough data were available for testing the interaction between the treatment and the isolate. Tests of intraspecific differences were carried out considering H. annosum s.s. and H. parviporum together and separately.
Residuals of the variables ‘stump-to-tree spread’ and ‘proportion of H. parviporum’ were assumed to follow a binomial distribution of the residuals and logit was used as a link function. Residuals of the variables ‘genet size’ and ‘number of trees colonized in the surroundings of the stump’ were supposed to follow a Poisson distribution, and the natural logarithm was used as link function. In both cases, overdispersion was corrected. Models were analysed using the glimmix procedure in sas/stat v. 9.1.3 following the recommendations of Schabenberger & Pierce (2002). Means are presented with their confidence interval (CI) at 95%.
We studied the spread patterns of H. parviporum and H. annosum s.s. genotypes by comparing the frequency of spread towards the immediacy of other stumps infected or not by other genotypes. We computed the number of times that every genotype was located within the area surrounding another stump (3 × 3 trees) inoculated by another genotype, or instead it spread to an area not belonging to the surroundings of any artificially infected stump. We differentiated whether the observations were made on stumps from which the artificial infection spread or not. Frequencies were compared by Fisher's exact method.
In one location (Bertilstorp), the diameter was measured at breast height (1.3 m above ground) of the thinned trees before the first thinning. We studied the association between the diameter of the stumps and the dependent variables between species (Table 2). Diameter at breast height (d1.3, cm) was transformed into diameter at stump height (dstump, cm) following Laasasenaho (1982): dstump=2+1.25 ×d1.3. The probability of infection was analysed by a logistic regression that included the diameter at stump height, the Heterobasidion species and the interaction between both. The plot and the particular isolates were included as random factors. The block could not be included because only replicates of the 50% conidia treatment and one replicate with the 100% conidia treatment were left in the location and both corresponded to different blocks. After testing the effect of both species together, a separate equation was fitted for each species, and in these cases, no random effects were included.
Airborne infection of the stumps tends to occur in a 1-cm-wide ring corresponding to the heartwood–sapwood boundary region (Bendz-Hellgren & Stenlid, 1998). We predicted the heartwood–sapwood boundary area, the diameter of the heartwood and the percentage of the section occupied by heartwood [equation S4b in Wilhelmsson (2002)]. The diameter of the sapwood was calculated by subtracting the diameter of the heartwood and the bark thickness from the diameter at stump height [equation S5b in Wilhelmsson (2002)]. The initial diameter at breast height of infected trees was compared between species as with the other variables in Table 2.
Several isolates used for artificial inoculation in this study had been used in previous investigations (Table 3). Available data included measures of sapwood and inner bark growth (Swedjemark & Stenlid, 1997), fungal growth (with and without including dead seedlings) and mortality rate in pine and spruce seedlings (Swedjemark et al., 1999), and average incidence of infection, growth in sapwood and incidence of infection and mortality in 17 tree species (Swedjemark & Stenlid, 1995). We studied the correlation between these measures and the variables from this study by using the glm procedure of the sas/stat v. 9.1.3. We considered H. parviporum and H. annosum s.s. together and separately. We selected the best BOX-COX transformation of the dependent and the independent variable in order to meet the assumptions of linearity and normality. We studied whether significant correlations were species specific by testing the hypotheses of equal slope and equal intercept between species. We used type III tests on fixed effects and R2 and root mean-square error (RMSE) as fit statistics for model comparison.
Pathogenicity measures of the artificially inoculated isolates on pine and spruce seedlings
| Number of isolates | |||||
| Variable | H. parviporum | H. annosum s.s. | Source | Mean and SD (in parenteses) | Description |
| Sapwood growth | 8 | – | Swedjemark & Stenlid (1997) | 74.3 (5.1) | H. annosum growth (mm) on the sapwood of 4-year-old ramets from 10 P. abies clones of two provenances 34 days after inoculation. |
| Inner bark growth | 8 | – | Swedjemark & Stenlid (1997) | 21.1 (4.9) | Lesion length in the inner bark (mm) of 4-year-old ramets from 10 P. abies clones of two provenances, 34 days after inoculation with H. annosum. |
| Fungal growth in pine, dead seedlings included | 9 | 9 | Swedjemark (1999) | 51.7 (33.0) | H. annosum extension up and down from the point of inoculation (mm) in 4-year-old pine seedlings 34 days after artificial infection. Dead seedlings included in the measurements. |
| Fungal growth in spruce, dead seedlings included | 9 | 9 | Swedjemark (1999) | 83.7 (17.5) | H. annosum extension up and down from the point of inoculation (mm) in 4-year-old spruce seedlings 34 days after artificial infection. Dead seedlings included in the measurements. |
| Fungal growth in pine | 9 | 9 | Swedjemark (1999) | 29.6 (15.2) | H. annosum extension up and down from the point of inoculation (mm) in 4-year-old pine seedlings 34 days after artificial infection. Dead seedlings excluded from the measurements. |
| Fungal growth in spruce | 9 | 9 | Swedjemark (1999) | 81.3 (20.2) | H. annosum extension up and down from the point of inoculation (mm) in 4-year-old spruce seedlings 34 days after artificial infection. Dead seedlings excluded from the measurements. |
| Mortality in pine | 9 | 9 | Swedjemark (1999) | 36.1 (27.3) | Percent of 4-year-old pine seedlings dead 34 days after artificial infection with H. annosum. |
| Mortality in spruce | 9 | 9 | Swedjemark (1999) | 25.6 (20.4) | Percent of 4-year-old spruce seedlings dead 34 days after artificial infection with H. annosum. |
| Incidence of infection | 4 | 5 | Swedjemark & Stenlid (1995) | 80.1 (3.9) | Percent of 2–4-year old seedlings of 11 conifer and 6 broadleaf tree species infected by H. annosum 6 weeks after artificial infection. |
| Growth in sapwood | 4 | 5 | Swedjemark & Stenlid (1995) | 44.8 (11.4) | Fungal extension up and down from the point of inoculum (mm) in seedlings (2–4 years old) of 11 conifer and 6 broadleaf tree species, 6 weeks after artificial infection with H. annosum. Dead seedlings excluded. |
| Incidence of mortality | 4 | 5 | Swedjemark & Stenlid (1995) | 12.6 (6.0) | Percent of seedlings (2–4 years old) of 11 conifer and 6 broadleaf tree species dead 6 weeks after artificial inoculation of H. annosum. |
Average of the isolates used in this study.
Results
Genetic structure of the infected plots
All inoculated strains were reisolated nearby an artificially inoculated stump after 15 years (Fig. 2). The fungus Heterobasidion annosum s.l. was reisolated from 73.5% of the rotten trees. The microsatellite fingerprints of 31 H. parviporum isolates collected in artificially infected plots matched with the fingerprint of the H. parviporum isolates that had been artificially introduced 15 years before. The microsatellite classification was congruent with the results obtained from somatic compatibility tests.
Representation of the studied plots. First-thinning stumps are represented with a triangle and trees with a circle. Isolates tagged with the same colour belong to the same genotype in artificially infected plots. For naturally infected stands, isolates with the same colour within a plot belong to the same genotype, i.e. only one genet of Heterobasidion annosum s.s. with more than one tree was found. Heterobasidion annosum s.s. isolates are represented with a cross. In artificially infected stands, isolates not corresponding to any inoculated isolate are also represented. Plots located in Bertilstorp and Christinehof are respectively tagged with B and C. Plots tagged with the same number belong to the same block.
Interspecific spread differences
The fungus H. parviporum spread from artificially infected stumps to neighbouring trees more frequently than H. annosum s.s. (P=0.0019) (Table 4). After 15 years, a high proportion of the trees surrounding artificially infected stumps were colonized (75–79%) (Table 4), and this colonization occurred equally in the case of H. annosum s.s.- and H. parviporum-infected stumps (P=0.73). During this time, Heterobasidion annosum s.s. was able to colonize a higher number of trees immediately surrounding the stump than H. parviporum (P=0.018) (Table 4). The difference between both species tended to be affected by the percentage of stumps artificially inoculated in the plot (P=0.070). In the plots in which 50% of the stumps had been infected, H. annosum s.s. colonized a higher number of trees than H. parviporum [3.14 trees CI: 1.86–5.33 vs. 1.6 trees CI: 0.96–2.65, P=0.04 Tukey's honestly significant difference (HSD) test], while in plots in which 100% of the stumps had been infected, no significant differences were observed (1.8 trees CI: 1.1–2.96 vs. 1.58 trees CI: 0.87–2.86, P=0.89 Tukey's HSD test). After 15 years, artificial infections of H. annosum s.s. tended to develop into larger genets than artificial infections of H. parviporum (P=0.098) (Table 4), although the difference was not significant. No significant genet size differences were observed when the natural-infected plots were included in this analysis (P=0.11) or between H. annosum s.s. and H. parviporum only on natural infection plots (P=0.82) (Table 4). The size of the genets did not correlate with the intensity of the second thinning (Pearson's correlation index=−0.43, P=0.21). No significant differences of maximum distance covered were observed between H. parviporum and H. annosum s.s. (P=0.97) (Table 4). The proportion of trees and stumps infected by H. annosum s.s. was higher (P=0.031) in artificial infection plots than in natural infection plots (36.3% of H. annosum s.s. CI: 13.5–67.6% and 5.2% CI: 1–23.2). Among artificial infection plots, we did not observe significant differences (P=0.32) between 100% and 50% infection treatments (23.9% of H. annosum s.s. CI: 4.2–68.9% and 49% CI: 12.2–86.9, respectively).
Mean Heterobasidion annosum s.s. and Heterobasidion parviporum values of stump-to-tree spread, severity of stump-to-tree spread, number of trees colonized in the surroundings of the stump, genet size, maximum and mean distance covered and initial diameter and periodic increment of infected trees
| Artificial infection | Natural infection | |||||||
| Number of samples | H. parviporum | H. annosum s.s. | Number of samples | H. parviporum | H. annosum s.s. | |||
| Stump-to-tree spread (%) | 179 | 57.3 (41.9–78.3) a | 26.8 (18.4–39.2) b | – | – | – | ||
| Severity of stump-to-tree spread (%) | 81 | 75.5 (51.4–90) a | 78.7 (54.3–92) a | – | – | – | ||
| Number of trees colonized in the surroundings of the stump | 81 | 1.59 (1.1–2.29) b | 2.38 (1.64–3.46) a | – | – | – | ||
| Genet size (trees) | 81 | 1.79 (1.12–2.85) a | 2.41 (1.51–3.86) a | 56 | 1.48 (1.03–2.13) a | 1.36 (0.64–2.89) a | ||
| Maximum distance covered (m) | 81 | 2.65 (1.84–3.46) a | 2.64 (1.78–3.5) a | – | – | – | ||
| Periodic increment (%) | 71 | 68.3 (62.4–74.1) a | 59.6 (52–67.1) a | 40 | 63.7 (55.8–71.7) a | 79.5 (42.6–116.5) a | ||
| Initial diameter of infected trees (cm) | 155 | 13.3 (12.4–14.2) a | 13.3 (12.3–14.2) a | 81 | 13.8 (13.1–14.4) a | 14.1 (12.2–16.1) a | ||
| Stump-to-tree spread | No spread | Stump-to-tree spread | No spread | |||||
| Diameter of initial stumps (cm) | 48 | 19.38 (13.72–25.03) a | 15.29 (11.2–19.39) b | 16.15 (11.87–20.43) a | 18.59 (14.02–23.16) a | – | – | – |
Pathogenicity measures 15 years after natural and artificial infection of the stumps of the first thinning in Norway spruce stands. In the case of stump-to-tree spread, genet-size, maximum distance covered and periodic increment, only trees with confirmed presence of Heterobasidion annosum s.s. were included. 95% CI are shown in parentheses. Identical letter shows no significant differences at P<0.05.
Spatial spread patterns of H. annosum s.s. and H. parviporum
The spread patterns of the inoculated genotypes did not occur at random (Table 5, χ2 test: P<0.0001). After artificial infection, H. parviporum was mainly observed colonizing trees immediately adjacent to artificially inoculated stumps from which other H. parviporum genets (26%) spread or from which H. annosum s.s. did not spread (41%) (Table 5). Heterobasidion annosum s.s. was mainly observed infecting trees on areas of the plots where no other genets had been inoculated (36% of the cases) or in areas where other H. annosum s.s. had been inoculated but did not spread (26%). Heterobasidion annosum s.s. was more often observed colonizing areas of the plots where no genotypes had been inoculated other than H. parviporum. The surroundings of artificially inoculated stumps with H. annosum s.s. that did not spread appeared to be more often occupied by H. parviporum than by H. annosum s.s. (Table 5). Heterobasidion parviporum was found more often colonizing the surroundings of inoculated stumps from which H. annosum s.s. did not spread, than in the surroundings of stumps from which H. parviporum did not spread (P<0.0001). The same pattern was less evident in the case of H. annosum s.s. (P=0.09). It happened very seldom (6%) that a H. parviporum genet spread into the surroundings of a stump inoculated with an H. annosum s.s. genotype that also spread into other trees. More often, H. parviporum spread into the surroundings of stumps infected by other H. parviporum genotypes that spread (26%) (P<0.0001). Heterobasidion annosum s.s. tended to be less frequently colonizing the surroundings of artificially inoculated stumps with H. parviporum that spread than other H. parviporum genotypes. Inoculations in the border of the plot showed a spread (42.0%) similar to inoculations performed at the middle of the plot (47.7%) (P=0.48).
Spread patterns of Heterobasidion annosum s.s. and Heterobasidion parviporum genets 15 years after artificial infection on Norway spruce stumps
| Within the surroundings of stumps artificially infected | ||||||
| H. annosum s.s. | H. parviporum | |||||
| Number and frequency of observations | Spread | No spread | Spread | No spread | Outside surroundings of artificially infected stumps | |
| 100% infection treatment | ||||||
| H. annosum s.s. | 4 | 17 | 11 | 9 | 7 | |
| 8% | 35% | 23% | 19% | 15% | ||
| H. parviporum | 12 | 69 | 46 | 31 | 5 | |
| 7% | 42% | 28% | 19% | 3% | ||
| Fisher's exact test (P) | 0.76 | 0.40 | 0.58 | 1.0 | 0.007 | |
| 50% infection treatment | ||||||
| H. annosum s.s. | 4 | 4 | 1 | 2 | 23 | |
| 12% | 12% | 3% | 6% | 67% | ||
| H. parviporum | 0 | 11 | 4 | 5 | 11 | |
| 0% | 35% | 13% | 16% | 35% | ||
| Fisher's exact test (P) | 0.11 | 0.037 | 0.18 | 0.24 | 0.013 | |
| All treatments | ||||||
| H. annosum s.s. | 8 | 21 | 12 | 11 | 30 | |
| 10% | 26% | 15% | 14% | 36% | ||
| H. parviporum | 12 | 80 | 50 | 36 | 16 | |
| 6% | 41% | 26% | 19% | 8% | ||
| Fisher's exact test (P) | 0.31 | 0.014 | 0.057 | 0.38 | <0.0001 | |
Two levels of artificial infection were performed: artificial infection of all stumps (100% infection) or half of the stumps (50% infection). Shown is the number and frequency of observations in which individual genotypes colonized the surroundings of stumps (area of 3 × 3 trees, Fig. 1) infected with other genotypes of Heterobasidion annosum s.s. and Heterobasidion parviporum. Stumps are divided into those from which the inoculated genotype spread and those from which it did not spread. A fifth category indicates the number of observations on trees located in areas of the plot outside the surroundings of any artificially infected stump. Fisher's exact tests are performed between species within the same column. Proportion pairs significantly different are shown in bold.
Stump size and spread of H. annosum s.l.
The association between the diameter of the stumps and the probability of stump-to-tree spread after artificial inoculations was different between H. parviporum and H. annosum s.s. (P=0.013) (Fig. 3). The probability of stump-to-tree spread increased with the diameter of the stumps in the case of H. parviporum (P=0.028) (Fig. 3a), whereas no association was found between the probability of stump-to-tree spread and the diameter of the stumps for H. annosum s.s (P=0.17) (Fig. 3b). The same pattern was observed when the size of the stumps from where artificial inoculations spread into neighbouring trees was studied (difference between Heterobasidion species significant at P=0.017). Stumps from where H. parviporum spread had a bigger diameter than the stumps from where it did not spread (P=0.038) (Table 4). No differences of diameter were observed between the stumps from where H. annosum s.s. spread or did not spread (P=0.16). The association between the diameter of the stump and the number of trees immediately colonized in the surrounding of the stump was significantly different for artificial inoculations with H. annosum s.s. and H. parviporum (test for different intercept: P=0.027; test for different slope: P=0.0085). The number of trees infected by H. annosum s.s. increased with the diameter of the stumps (P=0.030) (Fig. 4a), while no association was found in the case of H. parviporum (P=0.72) (Fig. 4b). The diameter of the heartwood and the sapwood, and the proportion of stump area represented by the heartwood, the sapwood and of the heartwood–sapwood boundary zone, for stumps within the range of diameters of the stumps used in the artificial inoculations are shown in Fig. 5.
Probability of stump-to-tree spread depending on the diameter of the stump for Heterobasidion parviporum (P=0.028) (a) and for Heterobasidion annosum s.s. (P=0.18) (b) following artificial inoculation. The ‘x’ axis shows the presence (1) and absence (0) of stump-to-tree spread, and the ‘y’ axis shows the diameter of the stumps at the time of the inoculation.

Predicted heartwood and sapwood diameter (a) and surface (b) according to Wilhelmsson (2002), and predicted surface of the heartwood–sapwood boundary area where Heterobasidion annosum s.l. airborne infections are typically observed (Bendz-Hellgren & Stenlid, 1998).
Characteristics of infected trees
No initial diameter differences were observed between H. parviporum-infected and H. annosum s.s.-infected trees (P=0.45). Heterobasidion annosum s.s.-infected trees tended to present a lower periodic increment than H. parviporum-infected trees (P=0.078) (Table 4), although this difference was not significant. No significant periodic increment differences were observed among healthy, H. annosum s.s.-infected and H. parviporum-infected trees (P=0.11), or when natural infections plots were included in the analysis (P=0.17).
Intraspecific spread differences
We observed intraspecific variation in terms of stump-to-tree spread (P=0.017). The majority of H. parviporum and H. annosum s.s. isolates were respectively grouped together into high and low stump-to-tree spread (Table 1). The H. annosum s.s. isolate Rb136 was similar to the majority of H. parviporum isolates, and the H. parviporum isolate Fr189b was similar to the majority of H. annosum s.s. isolates. When considering H. parviporum and H. annosum s.s. together or separately, no intraspecific differences were detected in terms of stump-to-tree spread, severity of stump-to-tree spread, number of trees colonized in the surroundings of the stump, genet size, maximum distance covered and periodic increment of the infected trees.
At the isolate level, we observed correlations between the variables measured in the present study (Table 6). While stump-to-tree spread did not correlate with any of the other studied variables, genet size, number of trees colonized in the surroundings of the stump and maximum distance covered were correlated. In the case of H. parviporum, the severity of stump-to-tree and a smaller growth of the infected trees also correlated with these three variables.
Significant (P<0.05) correlations between Heterobasidion annosum s.s. and Heterobasidion parviporum pathogenicity measures (Table 2) recorded 15 years after artificial inoculation on Norway spruce stumps
| Number of trees colonized in the surroundings of the stump | Genet size | Maximum distance covered | Periodic increment | ||
| H. parviporum and H. annosum s.s. | |||||
| Severity of stump-to-tree spread | 0.47, P=0.037 | 0.53, P=0.017 | 0.45, P=0.047 | – | |
| Number of trees colonized in the surroundings of the stump | 0.97, P<0.0001 | 0.57, P=0.009 | – | ||
| Genet size | 0.70, P=0.001 | – | |||
| H. parviporum | |||||
| Severity of stump-to-tree spread | 0.66, P=0.027 | 0.64, P=0.033 | – | – | |
| Number of trees colonized in the surroundings of the stump | 0.98, P<0.0001 | 0.95, P<0.0001 | −0.62, P=0.004 | ||
| Genet size | 0.94, P<0.0001 | −0.64, P=0.033 | |||
| Maximum distance covered | – | −0.67, P=0.024 | |||
| H. annosum s.s. | Genet size | 0.96, P<0.0001 | – | 0.67, P=0.047 | – |
Each cell shows the Pearson correlation coefficient and t-test probability.
Correlation between pathogenicity measures on seedlings and trees
In the case of H. annosum s.s. isolates, several variables measured in the present experiment (Table 2) correlated with pathogenicity measures observed on seedlings in other short-term experiments (Table 3). In terms of probability of stump-to-tree spread, the H. annosum s.s. isolates showed a stronger association with the growth on the sapwood of spruce seedlings than H. parviporum isolates (Fig. 6a). A model allowing a different intercept or a different slope between species resulted in a similar fit (R2=0.654, RMSE=0.148 vs. R2=0.68, RMSE=0.142, respectively). The number of trees colonized in the surroundings of the stump correlated negatively with the growth of H. annosum s.s. on the sapwood of pine seedlings (Fig. 6b), but no significant association was found in the case of H. parviporum. A model allowing different intercepts between species showed a higher fit to the data than a model allowing different slope (R2=0.29, RMSE=0.59 and R2=0.45, RMSE=0.52, respectively). When considering only the H. annosum s.s. isolates, the stump-to-tree spread correlated with a higher mortality in pine seedlings (r=0.67, P=0.0044), and a smaller periodic increment of infected trees correlated with a lower mortality in spruce seedlings (r=0.72, P=0.029). In the case of H. parviporum, only a smaller periodic increment of infected trees correlated with a higher growth on the sapwood of spruce seedlings (dead seedlings included, Table 3) (r=−0.75, P=0.019). When studying both H. annosum s.s. and H. parviporum together, the number of trees colonized in the surroundings of the stump correlated with the incidence of mortality on 17 tree species (Fig. 7a). A linear model including the incidence of mortality and a different intercept for each of species explained the frequency of stump-to-tree spread (R2=0.80, RMSE=0.41) better than the species alone (R2=0.39, RMSE=0.61) (Fig. 7b).
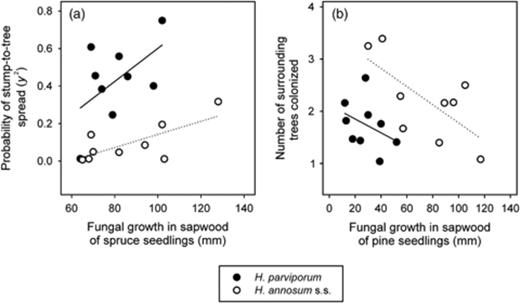
Correlation between spread measures of several Heterobasidion annosum s.s. and Heterobasidion parviporum isolates after artificial infection on stumps, and the fungal growth of the same isolates on sapwood of spruce seedlings (a) and pine seedlings (b) 34 days after infection (including dead seedlings) (Swedjemark et al., 1999) (Table 3). The frequency of stump-to-tree spread significantly correlated with the fungal growth in spruce seedlings in the case of H. annosum s.s. (R2=0.54, P=0.029) but not in the case of H. parviporum (R2=0.29, P=0.14). The number of trees colonized in the surroundings of the artificially infected stumps (Table 2) significantly correlated with the fungal growth in pine seedlings in the case of H. annosum s.s. (R2=0.46, P=0.044) but not in the case of H. parviporum (R2=0.14, P=0.32). The transformation of the variables is shown in parentheses.
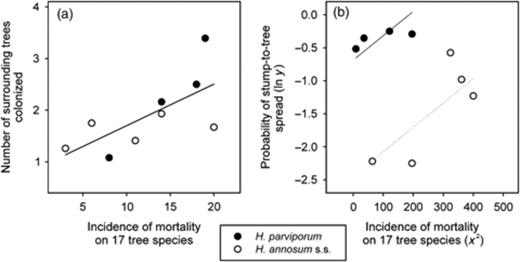
Correlation between the average mortality produced by several Heterobasidion annosum s.s. and Heterobasidion parviporum isolates on 17 tree species and the number of trees colonized in the surroundings of the artificially infected stumps (R2=0.46, P=0.045) (a) and the probability of stump-to-tree spread (b). In (b), the incidence of mortality was significant (P=0.03) when a different intercept for each species (P=0.003) was included in the linear model. The transformation of the variables is shown in parentheses. Incidence of mortality is expressed as a percentage.
Discussion
The fungi H. annosum s.s. and H. parviporum cause the same disease to Norway spruce (root and butt rot) but they seem to differ in the way they infect stumps and spread into neighbouring trees. Fifteen years after artificial inoculation on first-thinning stumps, H. parviporum was able to spread more frequently into neighbouring trees than H. annosum s.s. Artificial infections of H. parviporum spread more frequently from bigger stumps (Fig. 3a) and we hypothesize that this may relate to the amount of heartwood in the stumps. In an even-aged plantation, such as the ones in the present study, all trees have relatively similar crown sizes and therefore similar sapwood size (Longuetaud et al., 2006) (Fig. 5a). Under these conditions, diameter differences among trees normally account for heartwood differences; thus, after a certain stump size, it would be expected that the size of heartwood increases exponentially (Fig. 5b) (Sellin, 1994). Supporting the implication of heartwood in the successful transfer from stump-to-tree, we observed a sharp increase of the successful infections between 15 and 20 cm of diameter (Fig. 4a). Airborne infections are mostly established in the boundary zone between sapwood and heartwood (Bendz-Hellgren & Stenlid, 1998). Within the studied range of stump diameters, the predicted contribution of the sapwood–heartwood boundary area into the total stump surface (Fig. 5b) does not seem to match with the observed diameter-dependent pattern of infection (Fig. 3a). However, because the presence of such area is linked with the presence of heartwood, the possibility of this area contributing to colonization in natural stumps cannot be discarded. On the heartwood, or on the limit between the heartwood and the sapwood, H. parviporum may find more suitable moisture conditions for stump colonization than in sapwood where the moisture content may be too high (Bendz-Hellgren & Stenlid, 1998). Garbelotto (1997) observed that Heterobasidion occidentale sp. nov. Otrosina & Garbelotto would be more dependent on the presence of large roots for an efficient movement among trees, again suggesting a dependence on the heartwood for stump-to-tree spread.
Small-diameter trees (approximately 2 cm), probably with only sapwood, can spread H. parviporum after artificial inoculation (Gunulf et al., 2009). Causes other than the presence of heartwood might thus explain the stump-to-tree spread; however, the conditions met on small stumps may not resemble those found in first-thinning stumps. Under natural conditions, infection of precommercial thinning stumps (only with sapwood) occurs very seldom: 1% of 200 stumps in Bendz-Hellgren & Stenlid (1998), even after artificial inoculation (26%). This fact contrasts with the high infection rate on thinning stumps (73% and 95% after natural and artificial infection, respectively), suggesting a higher effect of the artificial infection on small stumps than on the thinning stumps. Furthermore, moisture content of the sapwood of precommercial thinning stumps drops much quicker than in thinning stumps (from 126% to 87% vs. 148% to 149% in 3 months, respectively) (Bendz-Hellgren & Stenlid, 1998). A faster drop of moisture in the sapwood of small stumps together with a high amount of inoculum may enable colonization of the sapwood by H. parviporum.
In our experiment, the inoculated genotypes were probably competing for the same trees. Inter- and intraspecific competition between H. annosum s.l. genotypes may therefore explain the fact that no-spread was observed from several infected stumps. This did not seem to be the case for H. parviporum. In case of interspecific competition, we would have expected a higher presence of H. annosum s.s. than H. parviporum on the surroundings of stumps of H. parviporum genotypes that did not spread. Yet, both species occurred at similar frequencies (Table 5). In case of intraspecific competition, we would expected a higher frequency of H. parviporum on the surroundings of stumps of H. parviporum that did not spread than on the surroundings of other H. parviporum genotypes that spread. Yet, the contrary was observed.
A faster spread of the H. parviporum genotypes could have impeded the development of H. annosum s.s. genets, and thus explain its low spread. Heterobasidion parviporum more often colonized trees around stumps from which H. annosum s.s. did not spread than H. annosum s.s. Very seldom, H. parviporum was observed colonizing the surroundings of stumps from which H. annosum s.s. spread (Table 5). If H. parviporum was more efficient than H. annosum s.s. in colonizing trees, the only chances for H. annosum s.s. to develop would be the area of the plot were no H. parviporum genotypes had been introduced. Indeed, the majority of H. annosum s.s. observations (72%) occurred on areas of the plot where either other H. annosum s.s. genotypes had been inoculated or no other inoculations were conducted. After 15 years, both H. annosum s.s. and H. parviporum had colonized a high percentage of the trees surrounding the artificially infected stumps (78% and 75%, respectively). However, the number of trees colonized by H. annosum s.s. was higher, and the difference between both species tended to be even higher in those plots in which only 50% of the stumps had been artificially infected. The lower inter- and intraspecific competition in these plots could have benefited H. annosum s.s. that developed freely without being outcompeted by the spread of other H. parviporum genotypes.
There is little information in the way H. annosum s.s. spreads within spruce stumps and trees. In a similar study performed on Picea sitchensis (Bong.) Carr., Morrison & Redfern (1994) observed that H. annosum s.s. survival on stumps was mostly due to colonization of the sapwood as heartwood infection did not progress. In their study, the sapwood pathway resulted in a success of transfer to neighbouring trees of 22% and it was always associated with viable mycelia at bark surface. A similar process may have taken place in our experiment. Our study was carried out in former agricultural soil, which could have facilitated ectopic growth since the level of antagonistic microorganisms is presumably lower than in forest soils (Rishbeth, 1951). Contrary to H. parviporum, the stump-to-tree spread of H. annosum s.s. did not link with the diameter of the stumps (Fig. 3b), and we observed that a higher number of trees were colonized by H. annosum s.s. when inoculated in bigger stumps (Fig. 4b). Bigger stumps may imply a higher number of root-to-root contacts and therefore higher chances of infection via ectopic growth. The stump-to-tree spread of H. annosum s.s. may relate to its capacity of spreading in the sapwood. Heterobasidion annosum s.s. has shown a higher growth on sapwood of spruce seedlings than H. parviporum (Swedjemark et al., 1999), and according to our data, 54% of the variation in stump-to-tree spread frequency may be explained by the capacity of growth on the sapwood of spruce (Fig. 6a). The number of spruce trees colonized correlated with a lower capacity of growth on pine (Fig. 6b), i.e. the more pathogenic the strains were on pine the less pathogenic they were on spruce. Interestingly, the H. annosum s.s. isolates adapted better to spruce showed a similar (low) pathogenicity on pine as H. parviporum isolates (Fig. 6b). Although with a small amount of samples, more pathogenic strains tended to colonize a higher number of trees and spread more frequently (Fig. 7a and b). Infection capacity on seedlings thus seemed to couple with our observations on adult spruce trees.
The observed epidemiological differences between H. annosum s.s. and H. parviporum following artificial inoculation may help to understand their behaviour under natural conditions. The incidence of H. annosum s.s. in first-rotation spruce stands tends to be low (% of H. annosum s.s.): 0% in Hanso (1994), 6% in Korhonen (1992), 7% in Berglund & Rönnberg (2004) and 10% in this study. Under natural conditions, the prevalence of one species is determined to a large extent by the presence of a nearby source inoculum of the same species (Stenlid, 1994; Möykkynen et al., 1997). In the present experiment, stumps were infected with equal amounts of inoculum of each species, and still a larger presence of H. parviporum was observed. A higher adaptation of H. parviporum to spread from spruce stumps could thus partly explain the species ratio observed under field conditions and its capacity to outcompete H. annosum s.s. Higher incidences of H. annosum s.s. have been reported in second-generation stands (% of H. annosum s.s.), where a substantial amount of H. annosum s.l. infection originates from a carry-over from the former rotation (Korhonen et al., 1992; Oliva et al., 2010): 66% of the genets (Stenlid, 1987), 100% of the isolations in both Vollbrecht (1995) and Vollbrecht & Stenlid (1999), 81% in Rönnberg & Vollbrecht (1999), 44% in Vasiliauskas & Stenlid (1998) and 34% in Korhonen (1992). These situations may resemble the conditions met in our 50% infection treatment where the H. annosum s.s. genotypes developed freely without having to compete with H. parviporum during the course of stump colonization and the subsequent spread into the neighbouring trees.
Our observations made after artificial inoculation and on stands growing on former agricultural land may not resemble those met under natural conditions. On agricultural land, Heterobasidion spread from thinning stumps is much higher than in old forest sites (Oliva et al., 2010). Natural infection results in a high diversity of small genets that may or may not fuse (Redfern et al., 1997; Swedjemark & Stenlid, 2001), providing somatic incompatibility reactions between isolates that can delay the spread of the infection towards the surrounding trees. Artificial infection eliminates inter- and intraspecific competition because conidial germlings readily fuse and quickly colonize the substrate. Artificial infection increases the amount of airborne infections (Bendz-Hellgren & Stenlid, 1998; Oliva et al., 2008), although it did not appear to translate into a larger size of the genets than on naturally infected plots. In our study, the size of the genets seemed to be determined more by inter- and intraspecific competition. We have shown that H. parviporum is a stronger pathogen than H. annosum s.s. on P. abies, as observed earlier (Stenlid & Swedjemark, 1988; Vasiliauskas & Stenlid, 1998; Swedjemark et al., 1999; Wellendorf & Thomsen, 2008). In competition, H. parviporum may be more aggressive than H. annosum s.s., although when growing alone H. annosum s.s. may create big genets, even bigger than H. parviporum. Even though some variation was found among isolates of each species, in general the behavior was consistent within species.
Acknowledgements
We would like to thank the landowners of Christinehofs gods for hosting the experiment. The field work assistance by Nicklas Samils and Carmen Romeralo is acknowledged. This research was partially funded by Swedish Research Council for Environment Agricultural Sciences and Spatial Planning (FORMAS), and by ‘Future Forests’ financed by the MISTRA Foundation for Strategic Research. J.O. was funded first by the scholarship 2006 BE 00500 and later with the postdoctoral grant 2008 BP A 00013, both from the DURSI-GENCAT.
References
