


Abstract
This study aimed to evaluate the effects of oat β-glucan in combination with low- and high-dietary calcium phosphate (CaP) content on gastrointestinal bacterial microbiota, prevalence of butyrate-production pathway genes and fermentation end-products in 32 weaned pigs allocated to four diets: a cornstarch–casein-based diet with low [65% of the calcium (Ca) and phosphorous (P) requirement] and high CaP content (125% and 115% of the Ca and P requirement, respectively); and low and high CaP diets supplemented with 8.95% of oat β-glucan concentrate. Pigs were slaughtered after 14 days, and digesta were collected for quantitative PCR analysis, and quantification of short-chain fatty acids and lactate. The high CaP content reduced gastric lactate and streptococci and propionate in the large intestine. Oat β-glucan distinctly raised gastric bacterial numbers, and colonic lactobacilli and bifidobacteria. Although not reflected by gene copies of butyrate-production pathway genes, oat β-glucan also increased gastric, caecal and colonic butyrate concentrations, which may be favourable for intestinal development in weaned pigs. Thus, a high CaP content negatively affected the intestinal abundance of certain fermentation end-products, whereas oat β-glucan generally enhanced bacterial numbers and activity. The results emphasize the importance of the stomach for bacterial metabolism of oat β-glucan in weaned pigs.
Introduction
Weaned pigs are susceptible to disturbance of the commensal microbiota in the immediate period after weaning due to social stress, low feed intake and immature intestinal functions (Lallès et al., 2007). Feeding strategies to maintain the commensal intestinal microbiota include dietary supplementation of organic acids, probiotics, nondigestible carbohydrates, phytobiotics or pharmacological levels of zinc and copper (Lallès et al., 2007). Less is known about the impact of other dietary minerals, such as calcium (Ca) and phosphorous (P), on the intestinal microbiota of weaned pigs. A dietary Ca content above the requirement has been considered as disadvantageous for the health of weaned pigs because of the high buffering capacity of Ca salts and the immature gastric barrier function at weaning (Lawlor et al., 2005). Moreover, environmental concerns with regard to eutrophication of surface water necessitate the reduction of P excretion in pig manure (Knowlton et al., 2004). However, dietary calcium phosphate (CaP) content stimulated faecal lactobacilli and mucosal integrity, decreased faecal enterobacteria in rats (Ten Bruggencate et al., 2004) and potentiated the growth-stimulating effect of inulin on faecal lactobacilli (Ten Bruggencate et al., 2004). Pig diets contain nondigestible carbohydrates, which are fermented in the large intestine. If a similar benefit of dietary CaP contents can be achieved in weaned pigs, CaP might be used to stabilize the commensal microbiota after weaning.
Cereal β-glucans are recognized as functional ingredients in human and animal nutrition (Naumann et al., 2006; Snart et al., 2006); barley and oats contain 2–12%β-glucan depending on the genotype (Wood, 2002). Supplementation of β-glucan concentrates may be advised to ensure adequate consumption of β-glucans to gain nutritional benefits. In growing pigs, mixed-linked β-glucans, supplemented either in the form of cereals or as a concentrate, were readily fermented, reduced the intestinal number of enterobacteria and increased intestinal butyrate concentrations (Lynch et al., 2007; Metzler-Zebeli et al., 2010a). Less is known about the effects of dietary β-glucans on butyrate fermentation and intestinal microbiota in weaned pigs. Fermentation of β-glucans to butyrate in the gastrointestinal tract may be favourable for intestinal development and function of the young pig. Butyrate is the main fuel for the colonocytes and regulates gene expression leading to anti-inflammatory effects (Hamer et al., 2008). Dietary supplementation of butyrate enhanced digestive and absorptive functions in the stomach and small intestine of weaned pigs (Claus et al., 2007; Mazzoni et al., 2008). Butyrate-producing bacteria do not form a homogeneous phylogenetic group but belong to several clostridial clusters. Therefore, quantification of the enzymes involved in the last step of the butyrate production used by different clostridial species, i.e. butyryl-CoA:acetate CoA-transferase and butyrate kinase, can be used to quantify butyrate-producing bacteria in the gastrointestinal tract (Louis et al., 2004, 2010; Louis & Flint, 2007).
The aim of this study was to evaluate the effects of an oat β-glucan concentrate in combination with low- and high-dietary CaP content on the bacterial community, butyrate-producing bacteria and fermentation end-products, especially butyrate, in the gastrointestinal tract of weaned pigs.
Materials and methods
Animals and diets
All procedures involving animal handling and treatment were approved by the University of Alberta Animal Care and Use Committee for Livestock, and followed principles established by the Canadian Council on Animal Care (1993). A total of 32 pigs (Large White × Landrace) weaned at 21 days were used in a 2 × 2 factorial arrangement in a block-randomized design. Standard commercial rearing conditions (photoperiod, humidity and temperature) were used at the Swine Research and Technology Centre of the University of Alberta (Edmonton, AB, Canada). Pigs were housed individually with free access to water. The pigs were fed according to the standard weaning protocol for 5 days after weaning. To facilitate the change from the pelleted cereal-based starter diet to the cornstarch-based experimental diets, the starter diet was blended with the experimental diets (50/50 v/v) on day 5. On day 6 after weaning, pigs [average body weight (BW) 7.8±0.2 kg] were randomly allocated to four feeding groups. The experiment was carried out in four replicates with eight pigs each. Two pigs per replicate received one of the four experimental diets resulting in a total of eight observations per diet.
Four experimental diets were formulated to contain two levels each of CaP and oat β-glucan (Table 1). Lowering the acid-binding capacity of starter diets, including reduced dietary amounts of Ca salts, has been recommended to ease the transition from milk to solid feed in order to prevent gastrointestinal disorders in newly weaned pigs (Lawlor et al., 2005). Based on the aforementioned background, the CaP content of the low CaP diets was formulated to be marginally deficient (65% of the requirement for 5–10 kg BW pigs; Nutrient Requirement Council, 1998); thereby, the available P requirement was still met. Moreover, the selected CaP sources, i.e. dicalcium phosphate, limestone and casein, were of high bioavailability (95–100%; Nutrient Requirement Council, 1998) ensuring that the dietary CaP was mostly available for the weaned pig. The high CaP diets were formulated to contain a CaP content that was not drastically in excess (125% and 115% of the Ca and P requirement for 5–10 kg BW pigs, respectively) and in a range that is still used in starter diets in practice in North America. To prevent that other cell wall components of cereals masked potential effects of oat β-glucan, a semi-purified cornstarch–casein diet was formulated to meet or exceed nutrient requirements for 5–10 kg BW pigs according to Nutrient Requirement Council (1998) recommendations, except for Ca and P (65% of the requirement; low CaP control diet). The low CaP control diet was supplemented with dicalcium phosphate to reach a Ca and a P supply of 125% and 115% of the actual Ca and P requirement of pigs between 5 and 10 kg (Nutrient Requirement Council, 1998; high CaP control diet). To reach a dietary β-glucan content of 5%, the low and high CaP control diets were supplemented with 8.95% oat β-glucan concentrate (OatVantage, GTC Nutrition, Missoula, MT) at the expense of cornstarch (low and high CaP β-glucan diets). A total of 3% purified cellulose (Solka-Floc 40 NF, International Fiber Corporation, Urbana, OH) was included in all diets to prevent constipation, particularly in those fed the control diets. The diets were fed for 14 days according to 3 × their maintenance requirement (3 × 110 kcal DE kg−1 BW0.75). The feed was offered in mashed form twice daily at 08:00 and 16:00 hours. On the last day, all pigs received their last meal 3–4 h before euthanization to ensure that digesta were equally distributed in the stomach and small intestine (Pieper et al., 2008).
Composition of the experimental diets (g kg−1 as-fed)
OatVantage (GTC Nutrition).
†Solka-Floc 40 NF (International Fiber Corporation).
Provided (per kg of diet): vitamin A, 8250 IU; vitamin D3, 825 IU; vitamin E, 40 IU; niacin, 35 mg; d-pantothenic acid, 15 mg; riboflavin, 5 mg; menadione, 4 mg; folic acid, 2 mg; thiamine, 1 mg; d-biotin, 0.2 mg; and vitamin B12, 0.025 mg.
Provided (per kg of diet): Zn, 100 mg as zinc sulphate; Fe, 80 mg as ferrous sulphate; Cu, 50 mg as copper sulphate; Mn, 25 mg as manganous sulphate; I, 0.5 mg as calcium iodate; and Se, 0.1 mg as sodium selenate.
Slaughtering and sampling
On days 14 and 16 each, four pigs were slaughtered. General anaesthesia was induced in the pigs with an injection of Ketalean (12 mg kg−1; Ketamine HCl, Biomeda MTC, Cambridge, ON, Canada), Rompun (2 mg kg−1; Xylazine, Bayer Cross, Toronto, ON, Canada) and Stressnil (8 mg kg−1; Merial Canada Inc., Baie D'Urfé, QC, Canada). Pigs were euthanized by intracardiac injection of Euthanyl Forte (0.44 mg kg−1; MTC Pharmaceutical, Cambridge, ON, Canada) and immediately exsanguinated. Thereafter, the abdominal cavity was opened and the entire small and large intestine were removed. Total digesta from the stomach were collected by cutting the stomach wall 5 cm cranial to the pylorus. The small and large intestines were carefully dissected from the mesentery. Digesta from the ileum (last 20 cm of the small intestine), caecum and mid-colon (colon was divided into three equal parts) were aseptically collected. The digesta samples were placed in an ice-water bath until transfer to −20 °C. Subsamples of digesta were taken for bacterial quantification and stored at −80 °C. Because ileal digesta could be collected from less than half of the pigs, the ileum was excluded from analysis.
Genomic DNA extraction and quantitative PCR (qPCR)
Total genomic DNA were extracted from digesta using the QIAamp DNA Stool Mini Kit (Qiagen, Mississauga, ON, Canada) according to the manufacturer's instructions. For quantification of 16S rRNA gene copy numbers of bacterial groups, group-specific primers (Metzler-Zebeli et al., 2010a) were used. qPCR was performed on a 7500 Fast Real-Time PCR System (Applied Biosystems, Foster City, CA) using the detection software (version 2.01, Applied Biosystems). Each reaction was run in duplicate in a volume of 25 μL in optical reaction plates sealed with optical adhesive film (Applied Biosystems). The reaction mixture consisted of 12.5 μL QuantiFast SYBR Green Mastermix (Qiagen), 1 μL (10 μM) of primers and 1 μL of template DNA. Because of the degeneration of the butyryl-CoA:acetate CoA-transferase and butyrate kinase primers, higher primer concentrations were used in the reaction mixture, which was 20 μM each. Amplification involved one cycle at 95 °C for 5 min, followed by 40 cycles of denaturation at 95 °C for 15 s, primer annealing at the optimal temperatures (Metzler-Zebeli et al., 2010a) for 30 s and extension at 72 °C for 30 s. Melt curve data were obtained after amplification by denaturation at 95 °C for 1 min, followed by cooling to 55 °C for 1 min and a stepwise increase of the temperature from 55 to 95 °C at 10 s per 0.5 °C. Data were collected at the extension step. Melting curves were checked to verify amplification of the expected PCR product. Standard curves were generated using serial dilutions of the purified and quantified PCR products generated by standard PCR and genomic DNA from pig intestinal contents (Lee et al., 2006). The detection limit was 102, 103 and 104 gene copy numbers g−1 wet weight for the group specific, butyryl-CoA:acetate CoA-transferase and butyrate kinase primers, respectively.
Short-chain fatty acids (SCFA) and lactate
Gastrointestinal digesta were analysed for SCFA using GC with a method adapted from Htoo (2007). Briefly, 0.2 mL of 25% phosphoric acid, 0.3 mL of internal standard solution (25 μmol mL−1) (4-methyl-valeric acid; Sigma-Aldrich, Oakville, ON, Canada) and 1 mL of milliQ water were added to 1 g of caecal and colonic digesta, mixed well and centrifuged for 10 min at 4000 g. For stomach samples, a total of 0.2 mL of 25% phosphoric acid, 0.2 mL of internal standard solution (25 μmol mL−1) and 0.5 mL of milliQ water were mixed with 1 g of gastric digesta. The supernatant was transferred into 1.5-mL Eppendorff tubes and centrifuged for 15 min at 17 000 g. This step was repeated once or twice depending on the clarity of the supernatant obtained. The clear supernatant was analysed for SCFA (i.e. acetic, propionic, butyric, isobutyric, valeric, isovaleric and caproic acid) using a Varian model 3400 Gas Chromatograph (Varian, Walnut Creek, CA) with a Stabilwax-DA column (30 m × 0.25 mm i.d.; Restek, Bellefonte, PA). A flame-ionization detector was used with an injector temperature of 170 °C and a detector temperature of 190 °C. Concentration of d- and l-lactate was measured using an enzyme kit (R-Biopharm, Darmstadt, Germany).
Chemical analysis
Diet β-glucan content was determined using a commercial enzyme kit (method 995.16; AOAC, 2006; Megazyme International Ireland Ltd, Bray, Ireland). Dry matter content in digesta was analysed according to AOAC (2006; method 930.15). The pH was measured in fresh digesta.
Statistical analysis
The data of this study were analysed using the mixed procedure of the statistical analysis system (sas) (version 9.3.1; SAS Institute Inc., Cary, NC). Fixed effects included replicate and treatment effect. Sow and weaned pig were considered as random effects, assuming a first-order autoregressive variance–covariance structure. Orthogonal contrasts were used to test the effect of the dietary CaP level (low vs. high), β-glucan (β-glucan vs. control diet) and the interaction of CaP level ×β-glucan diet. If an interaction occurred, multiple comparisons of least-squares means were performed using the pdiff option of sas. Degrees of freedom were approximated using the Kenward–Rogers method. The results are presented as least-squares means±SE of means. A probability level of P≤0.05 was defined as significant. A trend was discussed at 0.05<P≤0.1.
Linear discriminant analysis of jmp software (version 8.0.1, SAS Institute Inc.) was applied to examine potential relationships between diets and gene copies of bacterial groups in gastric, caecal and colonic digesta. Principal component analysis (PCA) was performed to examine any potential grouping of gene copies of bacterial groups, butyrate-production pathway genes, fermentation end-products and pH according to the different diets using jmp software.
Results
All pigs were healthy throughout the study and symptoms of intestinal disorders were not observed. Oat β-glucan concentrate contained 565.3 g kg−1β-glucan on dry matter basis resulting in 67.2 and 53.5 g β-glucan kg−1 diet on dry matter basis for the low and high CaP β-glucan diets, respectively. Both β-glucan inclusion and the high-dietary CaP content decreased (P<0.05) gastric dry matter content, whereas diet did not affect the dry matter content in the caecum and colon (Table 2). Similarly, a dietary effect on gastric, caecal and colonic pH could not be established.
Physicochemical characteristics of gastric, caecal and colonic digesta in weaned pigs fed diets with or without oat β-glucan and different CaP contents
| Control diet | Oat β-glucan diet | P-value | ||||||
| Low CaP | High CaP | Low CaP | High CaP | SEM | CaP level | β-Glucan | CaP ×β-glucan | |
| DM content (%) | ||||||||
| Stomach | 32.9a | 23.9b | 22.5b | 22.2b | 2.35 | 0.057 | 0.017 | 0.076 |
| Caecum | 26.7 | 26.3 | 21.6 | 23.5 | 2.56 | 0.132 | 0.787 | 0.652 |
| Colon | 36.5 | 40.5 | 33.8 | 37.8 | 2.74 | 0.155 | 0.332 | 0.999 |
| PH | ||||||||
| Stomach | 4.9 | 5.0 | 5.1 | 5.0 | 0.10 | 0.930 | 0.303 | 0.337 |
| Caecum | 6.7 | 6.8 | 6.5 | 6.0 | 0.17 | 0.300 | 0.581 | 0.596 |
| Colon | 6.7 | 6.8 | 6.9 | 6.7 | 0.10 | 0.417 | 0.410 | 0.315 |
Data are presented as least-squares means (n=8). a,bWithin a row, means without a common superscript differ (P<0.05).
SEM, SE of the mean; DM, dry matter.
Bacterial microbiota and butyrate-production pathway genes
To detect shifts in bacterial microbiota in stomach, caecum and mid-colon, bacterial 16S rRNA genes were quantified by qPCR (Table 3). Effects of the diet on gastric microbiota were mainly attributable to β-glucan. 16S rRNA gene copy numbers of Lactobacillus spp., Streptococcus spp., Clostridium clusters I and XIVa, the Bacteroides–Prevotella–Porphyromonas group and Enterobacteriaceae increased (P<0.05) with β-glucan inclusion; gene copy numbers of total bacteria and Enterococcus spp. tended to increase (P<0.10) with β-glucan. Furthermore, the number of gastric Streptococcus spp. was lower (P<0.01) with high-dietary CaP. An interaction (P<0.05) between the CaP content and β-glucan was observed for the Bacteroides–Prevotella–Porphyromonas group in the stomach. High CaP content decreased their numbers in the absence of β-glucan but increased their numbers in the presence of β-glucan.
16S rRNA gene copy numbers (log10 16S rRNA gene copies g−1 wet weight) of bacterial groups in stomach, caecum and colon of weaned pigs fed diets with or without oat β-glucan and different CaP contents
| Control diet | Oat β-glucan diet | P-value | ||||||
| Bacterial groups | Low CaP | High CaP | Low CaP | High CaP | SEM | CaP level | β-Glucan | CaP ×β-glucan |
| Stomach | ||||||||
| Total bacteria | 8.9 | 8.9 | 9.3 | 9.2 | 0.18 | 0.773 | 0.052 | 0.814 |
| Lactobacillus spp. | 7.8 | 7.7 | 8.1 | 8.1 | 0.15 | 0.908 | 0.011 | 0.686 |
| Enterococcus spp. | 7.9 | 7.8 | 8.0 | 7.9 | 0.06 | 0.240 | 0.051 | 0.377 |
| Streptococcus spp. | 7.8 | 7.3 | 8.2 | 7.8 | 0.12 | 0.002 | 0.006 | 0.731 |
| Bifidobacterium spp. | 6.7 | 7.0 | 7.0 | 7.0 | 0.37 | 0.627 | 0.677 | 0.771 |
| Clostridium cluster I | 4.1 | 3.9 | 4.5 | 4.3 | 0.16 | 0.768 | 0.023 | 0.260 |
| Clostridium cluster IV | 4.2 | 4.1 | 4.3 | 4.3 | 0.13 | 0.596 | 0.164 | 0.479 |
| Clostridium cluster XIVa | 4.4 | 4.2 | 4.6 | 4.7 | 0.12 | 0.574 | 0.022 | 0.308 |
| Bacteroides–Prevotella–Porphyromonas | 6.0b | 5.7b | 6.1b | 6.9a | 0.23 | 0.419 | 0.014 | 0.032 |
| Enterobacteriaceae | 5.0 | 5.2 | 5.6 | 6.3 | 0.30 | 0.160 | 0.008 | 0.414 |
| Caecum | ||||||||
| Total bacteria | 11.2 | 11.3 | 11.4 | 11.3 | 0.06 | 1.000 | 0.174 | 0.390 |
| Lactobacillus spp. | 9.1 | 9.3 | 9.3 | 9.3 | 0.11 | 0.588 | 0.218 | 0.619 |
| Enterococcus spp. | 6.7a | 6.2b | 6.2b | 6.4ab | 0.12 | 0.218 | 0.148 | 0.016 |
| Streptococcus spp. | 8.4 | 8.2 | 8.0 | 8.1 | 0.11 | 0.762 | 0.033 | 0.128 |
| Bifidobacterium spp. | 7.4 | 7.8 | 7.6 | 8.1 | 0.33 | 0.206 | 0.376 | 0.877 |
| Clostridium cluster I | 5.9 | 6.1 | 5.8 | 6.1 | 0.19 | 0.232 | 0.804 | 0.862 |
| Clostridium cluster IV | 8.3 | 8.3 | 8.1 | 8.4 | 0.16 | 0.419 | 0.520 | 0.385 |
| Clostridium cluster XIVa | 8.1 | 8.5 | 7.9 | 8.2 | 0.15 | 0.032 | 0.131 | 0.949 |
| Bacteroides–Prevotella–Porphyromonas | 10.2 | 10.2 | 10.4 | 10.3 | 0.09 | 0.852 | 0.157 | 0.531 |
| Enterobacteriaceae | 8.8 | 9.2 | 8.9 | 9.1 | 0.21 | 0.102 | 0.954 | 0.648 |
| Colon | ||||||||
| Total bacteria | 11.0 | 11.0 | 11.1 | 11.1 | 0.09 | 0.751 | 0.449 | 0.989 |
| Lactobacillus spp. | 8.7 | 8.8 | 9.1 | 9.1 | 0.15 | 0.862 | 0.026 | 0.798 |
| Enterococcus spp. | 6.5 | 6.1 | 6.3 | 6.2 | 0.17 | 0.125 | 0.810 | 0.240 |
| Streptococcus spp. | 8.1 | 7.8 | 7.7 | 7.7 | 0.16 | 0.281 | 0.145 | 0.199 |
| Bifidobacterium spp. | 7.3 | 7.2 | 7.9 | 8.2 | 0.33 | 0.736 | 0.019 | 0.519 |
| Clostridium cluster I | 5.7 | 5.7 | 5.9 | 5.6 | 0.24 | 0.635 | 0.709 | 0.483 |
| Clostridium cluster IV | 8.5 | 8.5 | 8.2 | 8.3 | 0.18 | 0.787 | 0.156 | 0.970 |
| Clostridium cluster XIVa | 8.6 | 8.4 | 7.8 | 8.0 | 0.16 | 0.933 | 0.001 | 0.306 |
| Bacteroides–Prevotella–Porphyromonas | 9.8 | 9.8 | 9.9 | 9.8 | 0.12 | 0.590 | 0.627 | 0.642 |
| Enterobacteriaceae | 8.9 | 9.1 | 9.7 | 9.0 | 0.20 | 0.242 | 0.487 | 0.878 |
| Coverage (%) | ||||||||
| Stomach | 102 | 86 | 92 | 81 | 7.2 | 0.033 | 0.238 | 0.705 |
| Caecum | 84 | 90 | 80 | 91 | 4.0 | 0.048 | 0.712 | 0.608 |
| Colon | 81 | 83 | 77 | 83 | 4.7 | 0.407 | 0.670 | 0.695 |
Data are presented as least-squares means (n=8). a,bWithin a row, means without a common superscript differ (P<0.05).
SEM, SE of the mean.
Effects of the diet on caecal microbiota were limited to reduced 16S rRNA gene copy numbers of Streptococcus spp. (P<0.05) in the presence of β-glucan and increased numbers of Clostridium cluster XIVa (P<0.05) with the high CaP contents in the diet. Additionally, there was an interaction (P<0.05) for the gene copy number of Enterococcus spp. in the caecum. Their number was lower when the high CaP content was added to the control diet, but increased with the high CaP β-glucan diet. In the colon, gene copy numbers of Lactobacillus spp. and Bifidobacterium spp. increased (P<0.05) with β-glucan, whereas the number of Clostridium cluster XIVa decreased (P<0.01) with β-glucan.
Overall, bacterial group primers used in the present study accounted for 77–102% of gene copies of total bacteria in gastric, caecal and colonic digesta. In gastric and caecal digesta, the bacterial group primers coverage was altered in pigs fed the high-dietary CaP diets compared with the low CaP diets (CaP content P<0.05; Table 3).
Butyrate-production pathways were analysed by qPCR to quantify butyrate-producing bacteria (Table 4). High CaP content decreased (P<0.05) the gene copies of butyryl-CoA:acetate CoA-transferase in gastric digesta, particularly in pigs fed the control diet, as shown by the interaction (P<0.05) of CaP and β-glucan. The butyryl-CoA:acetate CoA-transferase in gastric digesta was lower with the control diet, but unaffected with the β-glucan diet. Diet did not affect butyryl-CoA:acetate CoA-transferase and butyrate kinase in caecal digesta and butyrate kinase in colonic digesta. The β-glucan decreased (P<0.05) the gene copy number of the butyryl-CoA:acetate CoA-transferase in the colon.
Gene copy numbers of butyrate-production pathway genes (log10 gene copies g−1 wet weight) in stomach, caecum and colon of weaned pigs fed diets with or without oat β-glucan and different CaP contents
Detection limit: 4 log10 gene copies g−1 wet weight. a,bWithin a row, means without a common superscript differ (P<0.05).
Data are presented as least-squares means (n=8).
SEM, SE of the mean.
Fermentation end-products
Lactate was the dominant product of bacterial fermentation in gastric digesta. High-dietary CaP decreased total lactate and l-lactate (P<0.05) in gastric digesta (Table 5). The β-glucan tended to increase (P<0.10) the total SCFA concentration in gastric digesta, resulting in the highest concentration for the high CaP β-glucan diet. This was associated with increased (P<0.05) gastric butyrate and valerate concentrations and a trend (P<0.10) for higher propionate concentration in gastric digesta for β-glucan diets.
Concentrations of fermentation metabolites (μmol g−1 wet weight) in stomach, caecum and colon of weaned pigs fed diets with or without oat β-glucan and different CaP contents
| Control diet | Oat β-glucan diet | P-value | ||||||
| Metabolites | Low CaP | High CaP | Low CaP | High CaP | SEM | CaP level | β-Glucan | CaP ×β-glucan |
| Stomach | ||||||||
| Total lactate | 172.2 | 140.0 | 172.3 | 124.7 | 16.58 | 0.024 | 0.650 | 0.645 |
| d-Lactate | 67.1 | 76.2 | 80.9 | 63.1 | 9.60 | 0.654 | 0.974 | 0.174 |
| l-Lactate | 105.1 | 63.5 | 91.5 | 69.7 | 9.45 | 0.003 | 0.698 | 0.306 |
| Total SCFA | 9.8 | 9.5 | 13.9 | 32.5 | 6.62 | 0.180 | 0.052 | 0.168 |
| Acetate | 6.4 | 5.9 | 7.3 | 10.2 | 1.72 | 0.478 | 0.145 | 0.327 |
| Propionate | 1.1 | 1.6 | 1.8 | 5.2 | 1.23 | 0.134 | 0.098 | 0.262 |
| Isobutyrate | 0.2 | <0.1 | <0.1 | 0.3 | 0.11 | 0.893 | 0.815 | 0.087 |
| Butyrate | 1.0 | 0.9 | 2.8 | 10.4 | 2.46 | 0.143 | 0.031 | 0.139 |
| Isovalerate | 0.2 | 0.2 | 0.2 | 0.6 | 0.12 | 0.130 | 0.116 | 0.116 |
| Valerate | 0.2 | 0.4 | 1.3 | 4.9 | 1.26 | 0.161 | 0.037 | 0.186 |
| Caproate | 0.6 | 0.5 | 0.4 | 1.0 | 0.16 | 0.190 | 0.291 | 0.231 |
| Caecum | ||||||||
| Total SCFA | 182.1 | 160.8 | 181.6 | 161.7 | 11.50 | 0.087 | 0.988 | 0.957 |
| Acetate | 101.4 | 94.7 | 86.4 | 81.8 | 5.63 | 0.325 | 0.021 | 0.855 |
| Propionate | 52.7 | 43.3 | 60.0 | 48.1 | 4.90 | 0.040 | 0.226 | 0.805 |
| Isobutyrate | 3.3a | 2.7ab | 1.9c | 2.4bc | 0.21 | 0.800 | <0.001 | 0.026 |
| Butyrate | 13.5 | 11.2 | 16.5 | 15.7 | 2.02 | 0.451 | 0.074 | 0.723 |
| Isovalerate | 3.6a | 2.8ab | 1.7c | 2.5bc | 0.29 | 0.933 | 0.001 | 0.013 |
| Valerate | 6.8 | 5.5 | 14.0 | 10.5 | 1.90 | 0.220 | 0.004 | 0.557 |
| Caproate | 1.0 | 0.6 | 1.0 | 0.7 | 0.24 | 0.223 | 0.860 | 0.902 |
| Colon | ||||||||
| Total SCFA | 99.5 | 79.2 | 126.2 | 118.3 | 10.91 | 0.207 | 0.006 | 0.577 |
| Acetate | 62.0 | 54.9 | 71.8 | 68.7 | 6.57 | 0.445 | 0.085 | 0.762 |
| Propionate | 19.0 | 11.8 | 29.0 | 24.3 | 3.13 | 0.067 | 0.001 | 0.683 |
| Isobutyrate | 1.9 | 1.6 | 2.9 | 2.7 | 0.31 | 0.361 | 0.002 | 0.789 |
| Butyrate | 9.4 | 6.1 | 11.7 | 12.4 | 1.41 | 0.356 | 0.005 | 0.166 |
| Isovalerate | 2.7 | 2.2 | 3.9 | 3.9 | 0.43 | 0.557 | 0.003 | 0.596 |
| Valerate | 3.4 | 2.0 | 5.6 | 5.3 | 0.64 | 0.184 | <0.001 | 0.425 |
| Caproate | 1.0 | 0.7 | 1.3 | 1.0 | 0.14 | 0.044 | 0.028 | 0.901 |
Data are presented as least-squares means (n=8). a,b,cWithin a row, means without a common superscript differ (P<0.05).
SEM, SE of the mean.
In caecal digesta, total SCFA tended to be lower (P<0.10) in diets with high CaP, and particularly caecal propionate was reduced (P<0.05) by high CaP. Caecal acetate, isobutyrate and isovalerate concentrations were reduced (P<0.05) by dietary inclusion of β-glucan, whereas caecal valerate increased (P<0.05) and butyrate tended to be higher (P<0.10) when β-glucan was included in the diet. There was an interaction (P<0.05) of CaP content and β-glucan for branched-chain fatty acid concentration (i.e. isobutyrate and isovalerate) in caecal digesta. In pigs receiving the control diet, CaP reduced the caecal isobutyrate and isovalerate concentrations, whereas CaP increased them in pigs receiving the β-glucan diet. In colonic digesta, the high CaP content tended to decrease (P<0.10) the propionate concentration. In contrast, β-glucan increased (P<0.05) the colonic concentration of total SCFA, propionate, isobutyrate, butyrate, isovalerate, valerate and caproate and tended to increase (P<0.10) the colonic concentration of acetate.
Multivariate analysis
Linear discriminant analysis of diets and gene copy numbers in gastric (Fig. 1a), caecal (Fig. 1b) and colonic digesta (Fig. 1c) divided the effects of diets into three, two and one clusters, respectively. Effects of the high CaP β-glucan diet and the low CaP control diet on gastric microbiota overlapped in their 95% confidence intervals, the high CaP control diet and the low CaP β-glucan diet clustered separately (Fig. 1a). In the caecum, the low and high CaP β-glucan diets and the high CaP control diet formed one cluster and the low CaP control diet clustered separately (Fig. 1b). For colonic samples, 95% confidence intervals of dietary interventions overlapped; however, microbiota of pigs receiving the low CaP control diet differed from the low CaP β-glucan diet (Fig. 1c).
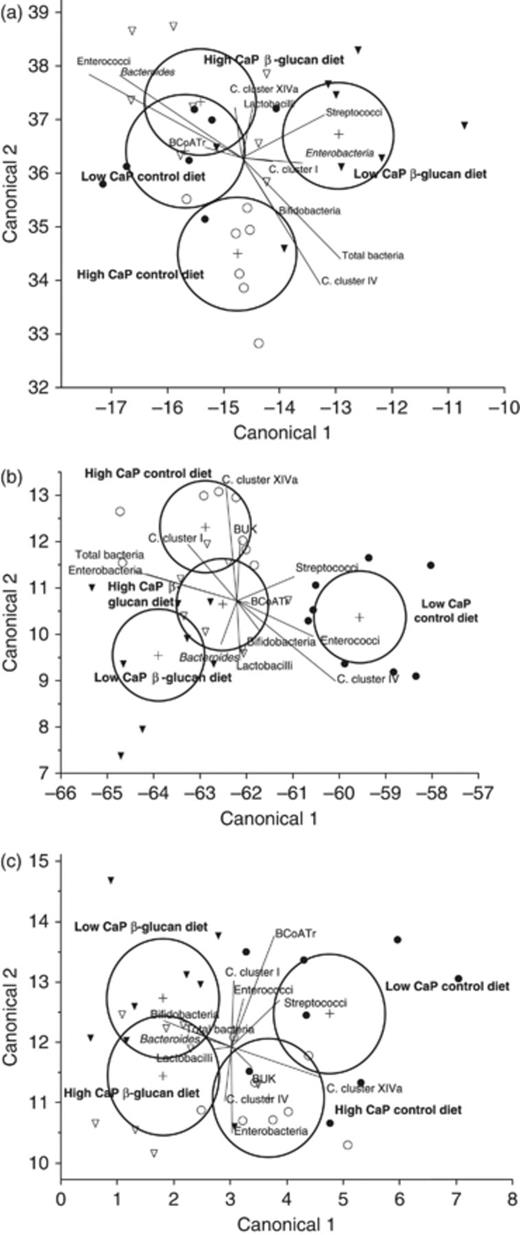
Linear discriminant analysis of the control and oat β-glucan diets with low and high CaP content and data from qPCR, in stomach (a), caecum (b) and colon (c): low CaP control diet (●), high CaP control diet (○), low CaP oat β-glucan diet (▾) and high CaP oat β-glucan diet (▿). Circles indicate 95% confidence intervals. BUK, butyrate kinase; BCoATr, butyryl-CoA:acetate CoA-transferase. n=8 per diet.
In the stomach, the high CaP β-glucan diet and the low CaP control diet were correlated to butyryl-CoA:acetate CoA-transferase, Clostridium cluster XIVa and Lactobacillus spp., the low CaP β-glucan diet was linked to Streptococcus spp. and Enterobacteriaceae, and the high CaP control diet correlated to Bifidobacterium spp. and Clostridium cluster IV (Fig. 1a). Caecal Clostridium clusters I and XIVa, and the butyrate kinase discriminated best for the high CaP control diet (Fig. 1b). In the colon, total bacteria, Lactobacillus spp., Bifidobacterium spp. and the Bacteroides–Prevotella–Porphyromonas group discriminated best for the low and high CaP β-glucan diets (Fig. 1c), whereas the high CaP control diet correlated more to butyrate kinase, Clostridium cluster IV and Enterobacteriaceae.
Figure 2 represents the loading plots of PCA showing the qPCR data of bacterial groups and butyrate-production pathway genes, fermentation end-products and pH responsible for the variation of the principal component (PC)1 and 2 and the correlations among individual variables. The first PC component covered 38.6%, 29.0% and 34.3% of the variation in the stomach, caecum and colon, respectively. PC2 explained 15.4%, 21.6% and 23.5% of the variation in the stomach, caecum and colon, respectively. In the stomach (Fig. 2a), SCFA, total bacteria and lactobacilli formed a cluster that highly correlated to PC1. Total, d- and l-lactate were negatively correlated to PC2, whereas butyryl-CoA:acetate CoA-transferase, Clostridium clusters I, IV and XIVa and Streptococcus spp. formed a third cluster and positively correlated to PC2. Loading plots of caecal data (Fig. 2b) indicated that total bacteria, Bacteroides–Prevotella–Porphyromonas, streptococci, enterococci, total SCFA, acetate, propionate, butyrate and isobutyrate formed one cluster highly related to PC1. A second cluster included enterobacteria, bifidobacteria, Clostridium clusters IV and XIVa, butyryl-CoA:acetate CoA-transferase, butyrate kinase and lactobacilli, and was positively correlated to PC2. In the colon (Fig. 2c), the measured parameters did not form distinct clusters. However, Clostridium clusters IV, XIVa, butyryl-CoA:acetate CoA-transferase and Enterobacteriaceae were highly correlated to PC2, whereas butyrate kinase, Clostridium cluster I, colonic pH and Enterococcus spp. were negatively correlated to PC2. Total SCFA, acetate, propionate, butyrate, isobutyrate, valerate and isovalerate were more positively related to PC1. In all intestinal compartments, Clostridium clusters IV, XIVa and butyryl-CoA:acetate CoA-transferase were highly correlated to each other; likewise, branched-chain fatty acids clustered together with valerate and caproate.
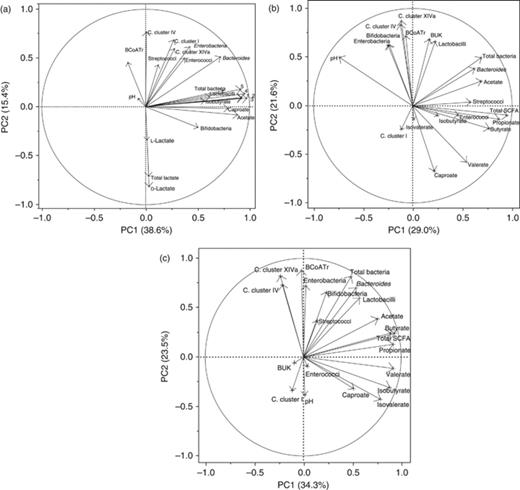
Loading plot showing the correlations among gene copies of bacterial groups, butyrate-production pathway genes, fermentation end-products and pH in gastric (a), caecal (b) and colonic (c) digesta of the first two eigenvalues (PC1 and PC2). BUK, butyrate kinase; BCoATr, butyryl-CoA:acetate CoA-transferase. n=8 per diet. (a) 1, Total SCFA; 2, isovalerate; 3, propionate; 4, butyrate; 5, valerate.
Discussion
In the present study, we investigated whether oat β-glucan in combination with dietary CaP contents modifies the gastrointestinal microbiota, butyrate-producing bacteria and fermentation end-products in the gastrointestinal tract of weaned pigs. The high coverage of the gene copies of total bacteria by the gene copies of the different bacterial groups evidenced that the primers we used comprised most of the important bacterial groups in the gastrointestinal tract of weaned pigs. Effects of complex carbohydrates are generally more apparent in the lower gastrointestinal tract; however, the present results emphasize that oat β-glucan can promote overall bacterial numbers and metabolic activity already in the stomach of weaned pigs. Moreover, none of the gastric bacterial groups specifically benefited from the oat β-glucan; on the contrary, there was an overall stimulating effect on bacterial numbers. β-Glucan-degrading organisms are found among all investigated bacterial groups that were enhanced by oat β-glucan except Enterobacteriaceae (Teather & Erfle, 1990; Walter et al., 2005; Beckmann et al., 2006). Bacteria may additionally benefit from an extended digesta retention time in the stomach caused by viscous β-glucan (Leterme et al., 2000), thereby allowing more time for the microbiota to proliferate. Moreover, β-glucan produced by lactobacilli enhanced their acid tolerance and resistance to gastric juice 15-fold (Stack et al., 2010) and increased numbers of lactobacilli in the stomach may relate to the protective effect of oat β-glucan to low gastric pH. Different from previous studies with barley β-glucan in rats (Snart et al., 2006), we did not find a specific effect on caecal numbers of lactobacilli. However, numbers of lactobacilli and bifidobacteria in the colon increased with oat β-glucan in the diet. The reduced colonic numbers of the Clostridium cluster XIVa with oat β-glucan are in agreement with a study in growing pigs, which compared the same oat β-glucan to cellulose and carboxymethylcellulose (Metzler-Zebeli et al., 2010a).
In contrast to rat studies (Ten Bruggencate et al., 2004), high CaP content did not increase intestinal numbers of lactobacilli, or decrease numbers of Enterococcus spp., Clostridium cluster IV and lactobacilli species as observed recently in the ileum of growing pigs (Metzler-Zebeli et al., 2010b). In the present study, the high-dietary CaP solely reduced the number of gastric Streptococcus spp. Ca can influence bacterial growth by a range of factors, such as induction of increased gastric acid secretion (Floor et al., 1991) or interference in bacterial adhesion to the intestinal mucosa (Geesey et al., 2000; Larsen et al., 2007). We did not observe an effect of Ca on gastric pH; however, the stomachs of the pigs were full at the time of euthanization and the buffering capacity of casein may have masked potential diet effects on gastric pH (Lawlor et al., 2005). The high CaP diets modified the proportion of all investigated bacterial groups to the gene copy number of total bacteria in gastric and caecal digesta, indicating that the overall bacterial community rather than specific bacterial groups was influenced by the high CaP content. Interestingly, the high-dietary CaP content stimulated the Clostridium cluster XIVa in the caecum. A similar effect was observed in the distal ileum of growing pigs that were fed phytase-supplemented corn–soybean meal-based diets (Metzler-Zebeli et al., 2010b). These findings were related to the greater availability of phytate-bound P in the small intestine (Metzler et al., 2008). Thus, the stimulating effect of CaP on Clostridium cluster XIVa may be associated with the higher availability of P rather than Ca. Activity and growth of rumen cellulolytic and hemicellulolytic bacteria decline when the dietary P level becomes deficient (Durand & Komisarczuk, 1988; Wider, 2005). Linear discriminant analysis of qPCR data and loading plots of PCA largely supported that the bacterial microbiota were differently affected by diet in the stomach, caecum and colon, most likely in relation to bacterial degradation of oat β-glucan and absorption of CaP along the gastrointestinal tract.
The high starch content of the diets likely potentiated gastric lactate fermentation in the present study (Argenzio & Southworth, 1974). However, the high CaP content appeared to decrease the metabolic activity of lactate-producing bacteria, or to stimulate rapid metabolism of lactate by lactate-utilizing bacteria. Dietary supplementation of oat β-glucan favoured gastric butyrate and valerate fermentation, particularly in weaned pigs fed the high-dietary CaP content. Strikingly, gastric butyrate and valerate concentrations were comparable to concentrations found in the caecum and colon. Similar gastric concentrations were rarely reported in the literature. For instance, Mathews (1993) reported butyrate and valerate concentrations of 5.1 and 1.9 μmol mL−1, respectively, in the stomach of pigs 14 days after weaning independently of the dietary treatment. More recently, feeding coarse nonpelleted barley–wheat-based diets caused accumulation of butyrate from 0 up to 1.6 to 2.5 μmol g−1 and increased the abundance of Megasphaera elsdenii, a butyrate-producing bacterium, in the stomachs of growing pigs compared with pigs fed finely ground diets (Mikkelsen et al., 2004, 2007; Canibe et al., 2005). Butyrate production in the upper gastrointestinal tract may be favourable for the piglet's development and growth performance because of its benefits for mucosal maturation, differentiation and function of the stomach and small intestine (Tsukahara et al., 2003; Claus et al., 2007; Mazzoni et al., 2008). The simultaneous stimulation of butyrate and valerate in the present study may have occurred by cross-feeding of butyrate and valerate producers with lactate. In an in vitro incubation system using human stool, butyrate was the main end-product of lactate metabolism (55%), but valerate was also formed (3%) (Bourriaud et al., 2005). Butyrate-producing bacteria were quantified by qPCR analysis of genes in the butyrate-production pathways (Louis et al., 2004, 2010). Oat β-glucan did not increase numbers of genes coding for butyrate production, indicating that only the metabolic activity of butyrate-producing bacteria was changed. Similarly, caecal and colonic butyrate concentrations were increased with oat β-glucan, but the gene copy numbers of the butyrate-production pathway genes were unaffected in the caecum. Colonic numbers of the butyryl-CoA:acetate CoA-transferase were even lower with oat β-glucan. The fact that numbers of intestinal bacteria do not necessarily relate to their metabolic activity (Macfarlane & Macfarlane, 2003) was confirmed by the loading plot of PCA in which butyrate-production pathway genes were negatively correlated with the butyrate concentration in the stomach and caecum.
Organisms in the Clostridium clusters IV and XIVa utilize the butyryl-CoA:acetate CoA-transferase pathway (Louis et al., 2004). Accordingly, Clostridium clusters IV and XIVa and the butyryl-CoA:acetate CoA-transferase were correlated in the loading plots of PCA for all gastrointestinal segments. Furthermore, some lactic acid-producing bacteria (depending on the gut segment) were also positively correlated to the butyryl-CoA:acetate CoA-transferase, Clostridium clusters IV and XIVa in the loading plots, supporting the importance of cross-feeding between lactate producers and lactate-utilizing butyrate-producing bacteria (Belenguer et al., 2006). Finally, the gene copy number of the butyrate kinase was higher in caecal and colonic digesta of weaned pigs than those of the butyryl-CoA:acetate CoA-transferase. In contrast, the butyryl-CoA:acetate CoA-transferase is the dominant butyrate-production pathway in the large intestine of growing pigs (Metzler-Zebeli et al., 2010a) and humans (Louis et al., 2004). This difference between growing and weaned pigs may be related to the immature bacterial community of the young pig.
The metabolic activity of propionate producers in the caecum and colon were reduced by high CaP contents. Propionate producers can be found among Bacteroides spp., Clostridium cluster IX and Mitsuokella and Veillonella spp. (Maci & Probst, 1979; Collins et al., 1994; Mikkelsen et al., 2007). Another possibility might have been an increased absorption of propionate from these intestinal segments provoked by the high-dietary CaP content.
In conclusion, the present study provide evidence that composition and metabolic activity of gastric microbiota benefited from dietary inclusion of oat β-glucan in addition to the effect of oat β-glucan on caecal and colonic microbiota. In contrast to rat studies, high-dietary CaP did not selectively stimulate intestinal lactobacilli; however, it decreased gastric streptococci and lactate. Although dietary CaP content should be kept close to the actual requirement because of the buffering capacity of Ca and environmental issues with respect to P excretion, the positive synergistic effect of the high-dietary CaP content and oat β-glucan on gastric butyrate concentrations may be interesting for the nutrition of weaned pigs during the first few weeks after weaning with respect to stimulation of intestinal development, function and health by butyrate.
Acknowledgements
The German Research Foundation (ME 3434/2-1) is gratefully acknowledged for provision of a postdoctoral research grant to B.U.M. Further thanks go to Alberta Livestock and Meat Agency for funding this study. Appreciation is extended to Kim Williams, Charlane Gorsak, Seema Hooda, Jose Landero and Prajwal Regmi of the Department of Agricultural, Food and Nutritional Science at the University of Alberta for their assistance with the care and handling of the pigs and sampling. Thava Vasanthan of the Department of Agricultural, Food and Nutritional Science at the University of Alberta is thanked for the β-glucan analysis by his laboratory. M.G.G. acknowledges Research Chairs of Canada for funding.
References
