


This study evaluated the influence of changes in the microbial community structure on reoxidation of reduced uranium during a postbiostimulation period. Effluent groundwater from acetate-stimulated sediment flow-through columns was analyzed over 60 days after acetate amendment was discontinued. Only a small reoxidation of iron or uranium (17%) occurred in the presence of 1–2 mg L−1 O2 influent groundwater for the 2-month period. Most uranium reoxidation occurred during the first 2 weeks after biostimulation with acetate was discontinued. Groundwater and sediment microbial community compositions suggested that two processes played important roles immediately after the cessation of acetate addition. The first process was characterized by a predominance of both sediment-bound and planktonic microorganisms most closely related to Hydrogenophaga sp., Thiobacillus sp., and Gallionella sp., which could oxidize a variety of reduced compounds. The second process was characterized by organisms closely related to Lysobacter sp. and Sterolibacterium sp., with the potential to feed on complex organic compounds from biomass turnover. The presence of these bacteria and the lack of uranium oxidation implied that after acetate addition was stopped, reduced inorganic compounds and dead biomass became electron donors for a microbial community capable of using low ambient oxygen as a terminal electron acceptor, contributing to the preservation, at least temporarily, of biogenic U(IV).
Introduction
Over the past decade, many studies have used a variety of approaches to remediate uranium-contaminated groundwater (i.e. Morrison et al., 2001; Finneran et al., 2002). Biostimulation has been a promising uranium remediation strategy (Anderson et al., 2003; Wu et al., 2006; Cardenas et al., 2008). The current bioremediation strategies for subsurface plumes of uranium stimulate an indigenous microbial community to reduce soluble U(VI) to insoluble U(IV), preventing further mobility of uranium in groundwater. This is achieved through the addition of a carbon source such as acetate, lactate, or ethanol (Abdelouas et al., 1998; Anderson et al., 2003; Istok et al., 2004; Sani et al., 2004). Past studies have focused on the microbially mediated U(VI) reduction to biogenic insoluble U(IV) minerals (Lovley & Phillips, 1992; Abdelouas et al., 1998; Anderson et al., 2003; Wu et al., 2006), their reoxidation in the presence of different oxidants (Finneran et al., 2002; Senko et al., 2002; Gu et al., 2005; Zhou & Gu, 2005; Moon et al., 2007; Komlos et al., 2008a), and the microbial communities associated with uranium biostimulation (Holmes et al., 2002; Chang et al., 2005; Cardenas et al., 2008; Hwang et al., 2009). However, little is known about the changes in the microbial community dynamics and geochemistry during poststimulation (the period after acetate amendment has been discontinued), which could control the stability of bioreduced uranium when the electron donor addition is discontinued.
It has been suggested that a potential drawback of biostimulation to immobilize uranium in groundwater is the dependence of uranium-sequestering biological processes on the availability of an external source of electron donor. This is because the postbiostimulation stability of biogenic U(IV) may rely on the maintenance of anoxic conditions that are generated during biostimulation (Komlos et al., 2008a).
It is well known that biogenic U(IV) can be oxidized to U(VI) by oxidants common in groundwater systems such as oxygen (Gu et al., 2005; Zhou & Gu, 2005; Komlos et al., 2008a, c) and nitrate (Finneran et al., 2002; Senko et al., 2002; Moon et al., 2007, 2009). Although nitrate does not directly oxidize U(IV) abiotically, denitrification intermediates (nitrite, nitric oxide, and nitrous oxide) can oxidize U(IV) directly (Senko et al., 2002). Bacteria such as Geobacter sp. (Finneran et al., 2002), Desulfovibrio sp. (Senko et al., 2005), and Thiobacillus sp. (Beller, 2005) have been shown to oxidize U(IV) in the presence of nitrate. The concentration of nitrate at the Rifle IFRC site is very low (<3 μM) such that it has minimal to no effect on the biogeochemical processes affecting uranium reduction and reoxidation. Although Mn oxides (Fredrickson et al., 2002) and Fe(III) minerals have been shown to oxidize biogenic U(IV) under limited geochemical conditions (Sani et al., 2005; Ginder-Vogel et al., 2006), Mn oxides were not detected in these sediments (Komlos et al., 2008c), indicating that U(IV) oxidation by Mn oxides should not be a factor in these experiments.
In contrast, a recent field study at a uranium-contaminated site in Rifle, CO (N'Guessan et al., 2008), has shown that uranium immobilization may continue long (months to years) after biostimulation via acetate injection has ceased. Biosorption was proposed as one of the processes contributing to the long-term sequestration of uranium (N'Guessan et al., 2008). Other researchers (Kelly et al., 2008) reported that after biostimulation, uranium was no longer bound to carbon ligands, but was adsorbed to Fe/Mn minerals, and that reduction of U(VI) to U(IV) continued in sediment samples stored under anaerobic conditions. In addition, Wan et al. (2005) reported that microbial reduction of uranium can be transient, even under sustained reducing conditions, as a result of the increase in the bicarbonate concentration due to microbial respiration. Using sediments from the Rifle site and synthetic groundwater, Moon et al. (2009) have shown that in the absence of nitrates and in the presence of low dissolved oxygen (DO) levels, precipitated uranium remained stable for extended time periods. Oxygen, as opposed to nitrate, was characterized by a very delayed breakthrough, indicating that oxygen was consumed in the flow-through sediment columns before it could react with the U(IV) phases.
Although the oxygen consumption described above could be mediated biologically, little research on the microbial community changes during postbiostimulation has been performed and little is known of how it might affect geochemical conditions and U(IV) stability. Because the oxidants mentioned above (DO and nitrate) that influence the U(IV) stability are all affected by microbial activity, strong feedbacks are expected between the poststimulation microbial dynamics and uranium stability. Therefore, the objectives of this study were to investigate the postbiostimulation microbial community dynamics in sediments and groundwater, under the conditions observed at the Rifle site, after acetate addition is stopped, and note how this microbial change is linked to major biogeochemical processes and uranium stability. For this purpose, sediment flow-through columns were operated under acetate biostimulation in the presence of <2 mg L−1 DO in the influent, to simulate the low ambient oxygen in the groundwater. After the biostimulation period, acetate injection was discontinued and only groundwater entered the columns at typical groundwater flow rates. Columns were sacrificed periodically during the postbiostimulation period, allowing for the characterization of the microbial community and the geochemistry over time. To our knowledge, this is the first investigation of the poststimulation microbial dynamics of carbon turnover under conditions that closely simulate the field and linking these dynamics to the geochemical changes and U(IV) stability.
Materials and methods
Sediment and groundwater
The sediment and groundwater used in the study were collected from the US Department of Energy's Integrated Field Research Challenge site located in Rifle, CO. Detailed descriptions of the geology and hydrogeology of the study site have been presented elsewhere (US Department of Energy, 1999; Anderson et al., 2003; Vrionis et al., 2005; Yabusaki et al., 2007; Komlos et al., 2008c). Both sediment and groundwater were taken from locations upgradient of field experimental plots. The sediment was collected with a backhoe, placed in mason jars, and stored at 4 °C without any further treatment until use. Before loading the columns, the sediment was sieved though a 2-mm sieve to homogenize the sample and remove pebbles. Groundwater was pumped to the surface with a peristaltic pump, directly into 5 gallon plastic carboys, and stored at 4 °C until use.
Column setup and operation
Seven glass columns (15 cm long, 2.6 cm in diameter, Kimble Kontes) were wet packed with 150(±10) g of the sediment described above. Groundwater from the Rifle site, which contains c. 9 mM sulfate, amended with 20 μM U(VI), was pumped in an up-flow mode through the columns at a flow rate of 0.04 mL min−1, resulting in a linear flow velocity of 30 cm day−1. The influent media were continuously purged with a gas mixture of nitrogen, containing 0.1% O2, to maintain the low ambient DO concentration (Moon et al., 2009), and 2% CO2, to maintain circumneutral pH of influent water. Because oxygen diffuses through the influent and pump tubing, influent DO was measured to range between 1 and 2 mg L−1, which is within the range of what is observed in the groundwater at the Rifle site. The influent groundwater was pumped into the columns until complete uranium breakthrough was observed. Biostimulation was initiated by pumping acetate via syringe pumps (KD Scientific) into the main influent lines just before the column influent, resulting in a concentration of 3 mM after mixing with the influent media. This acetate concentration was the same as that used in previous column experiments (Komlos et al., 2008c; Moon et al., 2009) as well as at the UMTRA field site during biostimulation (Anderson et al., 2003). The columns were biostimulated for 100 days at 17 °C, after which the acetate addition was discontinued. After the biostimulation period, and without a flow interruption, the same influent media (without acetate) were continuously pumped through the column for an additional 60 days. Effluent samples were collected to analyze the microbial community and effluent chemistry during the postbiostimulation phase. Individual columns were destructively sampled at 10–20-day intervals. Sediment samples were collected in two equal parts (sediments closer to the inflow, or ‘influent sediment’, and those closer to the outflow of the columns, or ‘effluent sediment’) in an anaerobic glove box (3% H2 in N2) as described (Moon et al., 2009). Each of these sediment samples was then homogenized, to minimize variability, and was analyzed for solid-phase U and Fe, as well as biomass and microbial community structure.
Groundwater and sediment analysis
Column effluent concentrations were monitored for acetate, Fe(II), U(VI), and sulfate during the biostimulation and postbiostimulation periods. Effluent Fe(II) concentrations were measured by adding 0.5 mL of effluent solution to 0.5 mL of 1 N HCl, and after a 1-h extraction, were analyzed using ferrozine (Lovley & Phillips, 1987). Acetate and sulfate were analyzed using a Dionex DX500 ion chromatograph equipped with a CD25 conductivity detector and a Dionex IonPac AS14 4 mm column. Influent and effluent U(VI) concentrations were analyzed using reverse-phase chromatography coupled to post-column derivatization with the dye Arsenazo III (Sigma-Aldrich) as described by Lack et al. (2002). The U(VI) detection limit using this procedure is 0.5 μM. All anion and uranium samples were filtered (0.2 μm) and stored at 4 °C until analyzed.
DO was measured using a Corning 317 DO meter fitted to an inline sampling device attached to the effluent of the column. DO was measured right at the influent to the columns as well as at the outflow.
Uranium was extracted from the sediments by adding 2–3 g of sediment to 5 mL of 1 M NaHCO3 and allowing the extraction to proceed under aerobic conditions for 4 days, after which the supernatant was analyzed as described above.
Fe(II) in sediments was measured in an anaerobic glove box (3% H2 in N2) by adding 0.2–0.3 g of sediment to 5 mL 0.5 N HCl, extracting for 24 h (Kukkadapu et al., 2006; Komlos et al., 2007), and analyzing as described above. The HCl-extractable Fe concentration in sediments was determined in the same manner as the sediment-associated Fe(II) concentration, except that 0.2 mL of 6.25 N hydroxylamine hydrochloride was added to the 0.5 N HCl solution at a final concentration of 0.25 N before the sediment addition (Komlos et al., 2007).
The SDs of the measurements for acetate and sulfate concentrations were 0.04 and 0.05 mM (n=4 samples). The SD of the uranium analyses was 0.33 μM (n=3 samples).
Molecular analysis of groundwater and sediment communities
Culture-independent molecular microbial analyses were performed on sediments and on groundwater samples from the flow-through columns. Sediment samples were collected from sacrificed columns at different postbiostimulation time points. Groundwater samples were collected by filtering 50 mL of effluent with a 0.2-μm inline Sterivex filter. DNA was extracted from sediment samples, and the 16S region of the DNA was amplified and sequenced as described previously (Anderson et al., 2003). Phospholipid lipid fatty acid (PLFA) and quantitative PCR (qPCR) analyses were performed as described previously (Komlos et al., 2008c). DNA was extracted from sediment columns using the Power Soil DNA extraction kit (MO BIO Laboratories) as per the manufacturer's protocol. Bacteria were enumerated by qPCR using the PCR primers BACT1369F-PROK1492R with the TaqMan probe 1389F as described previously (Suzuki et al., 2000). The PCR primer set 361F-685R specific for the 16S rRNA gene of Deltaproteobacteria (Stults et al., 2001) and the TaqMan probe 1839F were used as an index of potential sulfate-reducing and iron-reducing bacteria. PCR primer set 561F-825R and TaqMan probe Gbc2 specific for Geobacter sp. (Stults et al., 2001) were used to enumerate potential iron-reducing bacteria. The dissimilatory sulfite reductase gene (1F/5R) (Karr et al., 2005) was used to enumerate sulfate-reducing bacteria. All real-time PCR was performed on an ABI Prism 7000 Sequence Detector or an ABI 7300 Real-Time PCR System (Applied Biosystems). All experiments included control reaction mixtures without added DNA and calibration curves with appropriate positive control DNA.
PLFA analysis was performed using the previously reported precautions (White & Ringelberg, 1998). Column sediment samples (5 g) were extracted with a single-phase chloroform–methanol–buffer system of Bligh & Dyer (1954), as modified by White et al. (1979). The total lipid extract was fractionated into neutral, glyco, and polar lipids by silicic acid column chromatography (Guckert et al., 1985). The polar lipids were then transesterified to fatty acid methyl esters (FAMEs) by a mild alkaline methanolysis (Guckert et al., 1985). The resulting FAMEs were analyzed by capillary GC with flame ionization detection on a Hewlett-Packard 5890 Series 2 chromatograph with a 50 m nonpolar column (0.2 mm I.D., 0.11 μm film thickness). Preliminary peak identification was performed by a comparison of retention times with known standards. Definitive identification of peaks was accomplished by GC/MS of selected samples using a Hewlett-Packard 6890 series gas chromatograph interfaced to a Hewlett-Packard 5973 mass-selective detector using a 50 m nonpolar column (0.2 mm I.D., 0.11 μm film thickness).
Results
Geochemical changes associated with biostimulation
Biostimulation was initiated in the flow-through columns by amending the groundwater with acetate (3 mM final influent concentration) (Fig. 1a). Although uranium reduction was somewhat less than that in previous column experiments, the sediment flow-through columns responded to biostimulation as observed previously (Moon et al., 2007, 2009; Komlos et al., 2008b, c; N'Guessan et al., 2008). The addition of acetate to the columns resulted in the immediate removal of a fraction of the uranium from the groundwater along with the simultaneous release of Fe(II) (Fig. 1b and c). Approximately 5 μM U(VI) was continuously removed from the influent groundwater for the duration of the acetate amendment period (i.e. 100 days). A total of 23.8 μmol of uranium precipitated during this biostimulation phase. Sulfate reduction became prevalent after 30 days of biostimulation, and equimolar amounts (i.e. ∼3 mM) of sulfate and acetate were removed from the groundwater (Fig. 1d). During this sulfate reduction phase, Fe(II) was removed from the groundwater, presumably by reduced sulfur species (Fig. 1c). This same trend was also observed in previous studies (Moon et al., 2007; Komlos et al., 2008c). No DO was detected in the effluent during biostimulation or during the postbiostimulation period (data not shown).
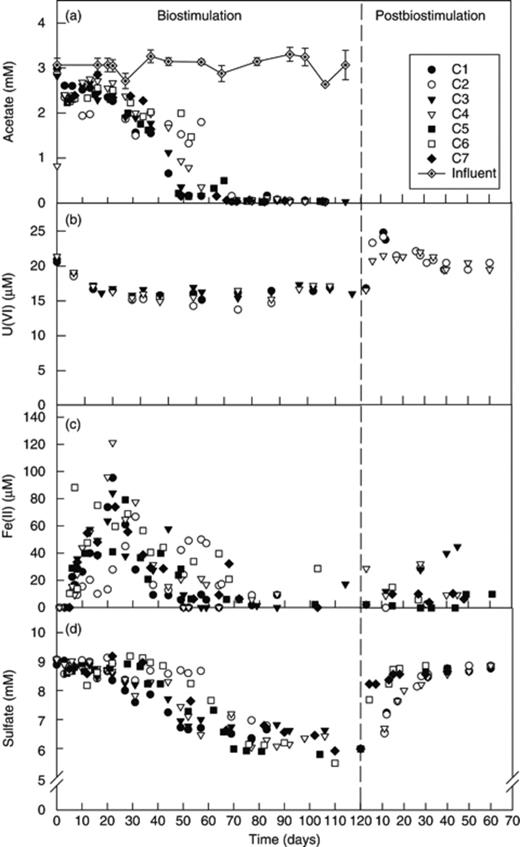
Geochemical changes in flow-through columns' effluent groundwater. Acetate (a), uranium (b), iron (c), and sulfate (d).
Geochemical changes associated with the postbiostimulation reoxidation
The removal of sulfate and uranium from groundwater stopped once acetate addition was terminated (Fig. 1b and d), although some sulfate was consumed for an additional 30 days after acetate amendment was discontinued. No sulfate rebound over the influent levels was observed. During the first month of the postbiostimulation period, about 17% of the total immobilized uranium (4 μmol) was released from the columns (with higher spikes during the first 2 weeks), after which the uranium effluent concentrations became equal to the influent levels until the end of the experimental period, meaning that no detectable loss of immobilized uranium occurred during that period (Fig. 1b). Low levels of Fe(II) continued to be released from the columns during the 60-day postbiostimulation period (Fig. 1c). Analysis of the HCl-extractable iron in the sediment showed that the Fe(II) to total Fe ratios remained the same in all columns for the entire duration of the postbiostimulation period (Supporting Information, Fig. S1). Furthermore, Fe(II) in the sediments at the influent half of the column decreased during the first 2 weeks of the postbiostimulation period and remained stable thereafter. No changes in Fe(II) in the sediments with time were observed in the effluent half of the columns (Fig. S1).
Based on the extractions and analyses for Fe(II) at the beginning and at the end of the postbiostimulation period, 482 μmol of Fe(II) was reoxidized during the 60-day postbiostimulation. During this period, 162 μmol of O2 entered the column (flow=0.4 mL min−1, DO=1.5 mg L−1). Based on a stoichiometry of 1/4 mol O2 mol−1 Fe(II) oxidized, 121 μmol of O2 would have reacted with the Fe(II), leaving about 40 μmol of O2 to react with other reduced species.
PLFA and bacterial abundance changes in groundwater and sediment during the postbiostimulation period
During the 60 days following the end of biostimulation, the microbial cell abundance decreased by two orders of magnitude in the groundwater effluent as well as in the sediment (Fig. 2a andb). Iron-reducing bacteria (GEO and IRB) and sulfate-reducing bacteria (SRB and DSR) were below detection limits in the groundwater, but they represented a more significant fraction of the total bacteria in the sediment (Fig. 2a andb). While there were distinct changes in the bacterial population in the sediment throughout the experiment, the cell abundance for sulfate-reducing bacteria (DSR) remained the same (Fig. 2b). PLFA analysis of the sediment collected from the influent and effluent of the columns showed that there was significantly more biomass at the influent of the columns (i.e. close to the injection point) than at the effluent (Fig. 2c). Additionally, the PLFA profiles, which were dominated by monounsaturated fatty acids, suggested that Gram-negative bacteria remained prevalent throughout the postbiostimulation monitoring period (Fig. 2d). Furthermore, terminally branched fatty acids, indicative of Gram-positive bacteria, were low at the start of the postbiostimulation monitoring period and increased slightly within 60 days postbiostimulation (Fig. 2d). However, these represented only a small fraction of the PLFA profile.
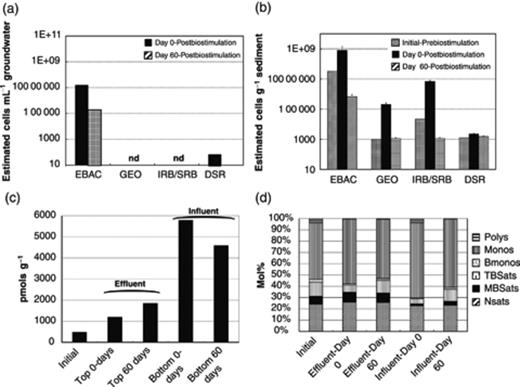
Postbiostimulation biomass changes in flow-through columns. (a) Groundwater and (b) sediment qPCR with primers specific for bacteria (EBAC), Geobacteraceae (GEO), iron- and sulfate-reducing bacteria (IRB/SRB), and dissimilatory sulfite reductase gene (DSR), (c) PLFA biomass changes, and (d) community composition PLFA in sediment, Polys, polyunsaturated PLFA; Monos, monounsaturated PLFA; BMonos, branched-chain monounsaturated PLFA; TBSats, terminally branched saturated PLFA; MBSats, mid-chain branched saturated PLFA; NSats, normal saturated PLFA.
Fitting first-order decay rates to the bacterial numbers during the poststimulation period, shown in Table S1, results in k=0.08 day−1 for Eubacteria (r2=0.39, n=12); k=0.10 day−1 for Geobacter (r2=0.76, n=12); and k=0.15 day−1 for iron- and sulfate-reducing bacteria (r2=0.70, n=12). These are averaged over the influent and the effluent sediments.
Postbiostimulation phylogenetic microbial community dynamics
Proteobacteria were predominant in the sediments and in the groundwaters for at least 50 days postbiostimulation (Table 1). These correlated well with the results from the PLFA analysis described earlier (Fig. 2c and d). Proteobacteria represented >50% of the total bacterial community in the sediment both at the influent and at the effluent of the columns. In the groundwater, Proteobacteria accounted for no <96% of the total microbial community postbiostimulation (Table 1). Verrucomicrobia were present in the sediment, but not in the groundwater (Table 1). Firmicutes were not prevalent in any of the samples from this experiment. Again, this correlated well with the low percentage of terminally branched fatty acids from the community composition PLFA analysis (Fig. 2d).
16S rRNA gene frequencies in clone libraries from genomic DNA extracted from effluent groundwater as well as effluent and influent sediment from flow-through columns
| Groundwater Phylum | % in samples collected on the following days postbiostimulation | Effluent sediment Phylum | % in samples collected on the following days postbiostimulation | Influent sediment Phylum | % in samples collected on the following days postbiostimulation | ||||||||||||||
| −50* | 16 | 32 | 42 | 50 | 0 | 14 | 32 | 42 | 50 | 60 | 0 | 14 | 32 | 42 | 50 | 60 | |||
| Acidobacteria | 0 | 0 | 0 | 0 | 0 | Acidobacteria | 2 (1) | 4 (2) | 0 | 0 | 0 | 3 (1) | Acidobacteria | 3 (1) | 0 | 0 | 3 (1) | 0 | 8 (3) |
| Actinobacteria | 5 (2) | 0 | 0 | 0 | 0 | Actinobacteria | 0 | 2 (1) | 5 (2) | 0 | 3 (1) | 5 (2) | Actinobacteria | 3 (1) | 0 | 2 (1) | 0 | 0 | 0 |
| Bacteroidetes | 30 (13) | 2 (1) | 2 (1) | 4 (2) | 2 (1) | Bacteroidetes | 2 (1) | 13 (6) | 5 (2) | 5 (2) | 13 (4) | 8 (3) | Bacteroidetes | 13 (5) | 8 (3) | 10 (4) | 6 (2) | 3 (1) | 3 (1) |
| Chlorobi | 0 | 0 | 0 | 0 | 0 | Chlorobi | 0 | 0 | 0 | 0 | 0 | 0 | Chlorobi | 0 | 0 | 0 | 3 (1) | 0 | 0 |
| Chloroflexi | 2 (1) | 0 | 0 | 0 | 0 | Chloroflexi | 14 (6) | 6 (3) | 11 (5) | 14 (6) | 9 (3) | 5 (2) | Chloroflexi | 0 | 3 (1) | 2 (1) | 3 (1) | 8 (3) | 6 (2) |
| Firmicutes | 9 (4) | 0 | 0 | 0 | 0 | Firmicutes | 5 (2) | 4 (2) | 2 (1) | 5 (2) | 0 | 0 | Firmicutes | 10 (4) | 5 (2) | 0 | 0 | 5 (2) | 6 (2) |
| Gemmatimonadetes | 0 | 0 | 0 | 0 | 0 | Gemmatimonadetes | 0 | 0 | 9 (4) | 0 | 0 | 8 (3) | Gemmatimonadetes | 0 | 0 | 0 | 0 | 0 | 0 |
| Planctomycetes | 0 | 0 | 0 | 0 | 0 | Planctomycetes | 0 | 0 | 0 | 2 (1) | 0 | 3 (1) | Planctomycetes | 0 | 0 | 2 (1) | 0 | 3 (1) | 0 |
| Proteobacteria | 55 (24) | 98 (44) | 98 (43) | 96 (45) | 98 (42) | Proteobacteria | 62 (26) | 70 (33) | 68 (30) | 50 (22) | 53 (17) | 51 (20) | Proteobacteria | 69 (27) | 76 (28) | 76 (32) | 69 (25) | 74 (29) | 64 (23) |
| Verrucomicrobia | 0.0 | 0 | 0 | 0 | 0 | Verrucomicrobia | 0 | 0 | 0 | 5 (2) | 0 | 0 | Verrucomicrobia | 0 | 5 (2) | 7 (3) | 0 | 0 | 3 (1) |
| Unknown | 0.0 | 0 | 0 | 0 | 0 | Unknown | 14 (6) | 0 | 0 | 21 (9) | 22 (7) | 18 (7) | Unknown | 3 (1) | 3 (1) | 0 | 17(6) | 8 (3) | 11 (4) |
| Total | 100 (44) | 100 (45) | 100 (44) | 100 (47) | 100 (43) | Total | 100 (42) | 100 (47) | 100 (44) | 100 (44) | 100 (32) | 100 (39) | Total | 100 (39) | 100 (37) | 100 (42) | 100 (36) | 100 (39) | 100 (36) |
Numbers in parentheses represent the number of sequences in a library. *−50 represents the community structure at 50 days of biostimulation with acetate.
Groundwater postbiostimulation community dynamics within the phylum Proteobacteria
Organisms that belong to the class Betaproteobacteria were most prevalent in the groundwater and accounted for 56–98% of the postbiostimulation microbial community (Fig. 3a), including Hydrogenophaga sp. (91–99% similarity), representing 98% of the total microbial community in the groundwater early during the postbiostimulation (Fig. 3b). By day 32, organisms closely related to the betaproteobacterium Sterolibacterium sp. (90–94% similarity) represented 47.8% of the total microbial community, while the proportion of Hydrogenophaga-like bacteria decreased to 43% (Fig. 3b). After day 32 of postbiostimulation monitoring, Gammaproteobacteria became increasingly important in the groundwater (Fig. 3a), with bacteria closely related to Lysobacter sp. (89–98% similarity) representing 33% of the total groundwater microbial community by day 50 (Fig. 3a).
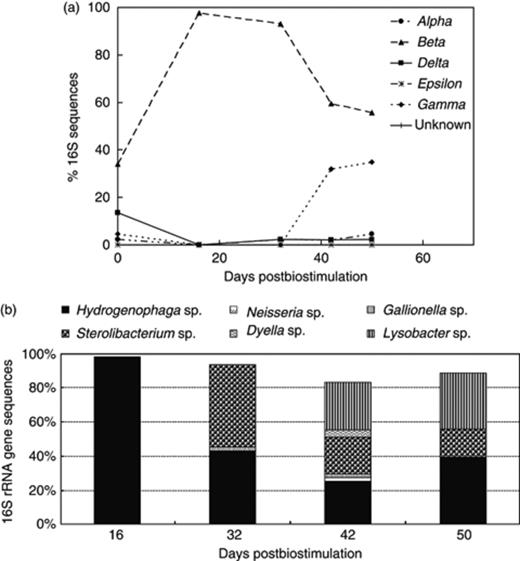
(a) 16S rRNA gene-based groundwater microbial community dynamics within the phylum Proteobacteria and (b) distribution of Betaproteobacteria and Gammaproteobacteria in the effluent groundwater throughout the postbiostimulation monitoring.
Sediment postbiostimulation community dynamics within the phylum Proteobacteria
In contrast to the groundwater, where Betaproteobacteria were predominant, the postbiostimulation bacteria community in the sediment was dominated by Deltaproteobacteria (Fig. 4). Dissimilatory metal-reducing bacteria (DMRB), belonging to the family Geobacteraceae, as well as sulfate-reducing bacteria (SRB) within the Desulfobacteraceae, Desulfobulbaceae, and Desulfuromonadaceae were the most prevalent Deltaproteobacteria in sediments (Fig. 5). Yet, there were distinct differences between the distribution of Deltaproteobacteria at the columns influents and effluents. At the effluent, DMRB were the predominant organisms, while SRB thrived at the influent (Fig. 5). Additionally, after 16 days postbiostimulation, bacteria within the class Betaproteobacteria increased from 8% to 31% of the total 16S sequences from the sediment at the influent of the columns (Figs 4 and 6). On the other hand, Betaproteobacteria represented <14% of the microbial community at the effluent of the columns (Figs 4 and 6). The Betaproteobacteria at the influent were composed of Hydrogenophilaceae, such as Thiobacillus sp. (92–98% similarity), as well as other bacteria most closely related to Gallionella sp. (92% similarity) and Hydrogenophaga sp. (94–99% similarity) (Fig. 6).
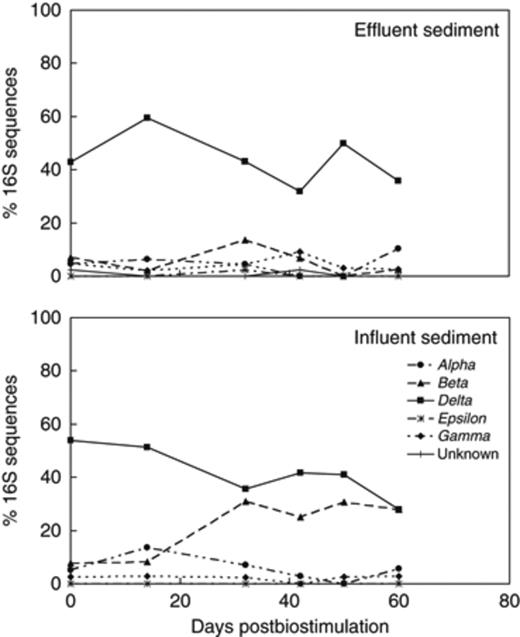
16S rRNA gene-based sediment microbial community dynamics within the phylum Proteobacteria at the effluents and influents of flow-through columns.
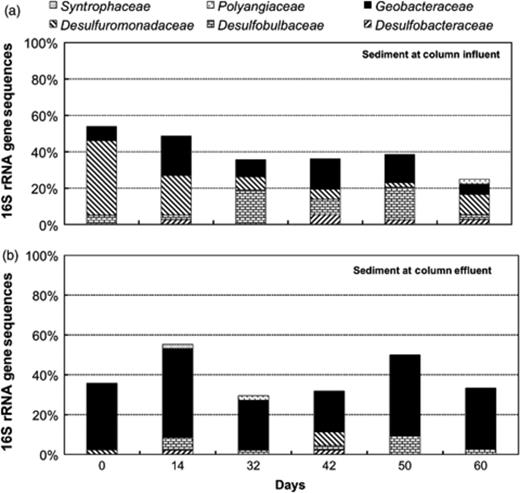
Distribution of Deltaproteobacteria in sediment at the influents and effluents of flow-through columns throughout the postbiostimulation monitoring.

Distribution of Betaproteobacteria in sediment at the influents and effluents of flow-through columns throughout the postbiostimulation monitoring.
Discussion
The geochemical changes and microbial dynamics observed in this study suggested that there were two important processes that followed the end of biostimulation in the presence of 1–2 mg O2 L−1. The first process, ‘bio-oxidation’, is described in this manuscript as the oxidation of reduced minerals by microorganisms [e.g. Fe(II) by Gallionella sp., and reduced sulfur by Thiobacillus sp. and Hydrogenophaga sp.], and is a process that requires oxygen. The second process, biomass turnover, refers to the oxidation of complex organics from decaying biomass by bacteria. This biomass turnover can take place under aerobic and anaerobic conditions; however, organisms such as Lysobacter sp., and Sterolibacterium sp. detected in this experiment, can oxidize complex organic materials under aerobic conditions (Christensen & Cook, 1978; Tarlera & Denner, 2003). These two processes, which require oxic or suboxic conditions, may have been mediated by specialized bacteria that became predominant during the postbiostimulation period. Bio-oxidation and biomass turnover could have contributed to the consumption of incoming low-level oxygen, therefore minimizing any reoxidation of Fe(II) or biogenic U(IV) in the sediment. In addition, biomass turnover may have resulted in the production of low levels of simple organic carbon compounds as byproducts that could have been used by the surviving population of Deltaproteobacteria (i.e. DMRB and SRB), therefore explaining the persistence of these organisms throughout the 2-month postbiostimulation monitoring period (Fig. 6).
The bio-oxidation stage was characterized by the presence of organisms with the potential to oxidize reduced species. These bacteria, which include Hydrogenophaga sp. and Thiobacillus sp., are able to use H2, Fe(II), sulfide, or thiosulfate as their electron donor in the presence of O2. Organisms from the genus Hydrogenophaga are generally motile (Willems et al., 1989; Kampfer et al., 2005), while those from the genus Thiobacillus are generally nonmotile (Willems et al., 1989; Wood et al., 2001; Kampfer et al., 2005; Kellermann & Griebler, 2009). This could potentially explain the prevalence of Hydrogenophaga-like organisms in the groundwater and the predominance of Thiobacillus-like organisms in the sediment.
Hydrogenophaga sp. are chemoorganotrophic or chemolithoautotrophic bacteria that typically utilize H2 as an energy source and CO2 as a carbon source (Willems et al., 1989; Kampfer et al., 2005). Some Hydrogenophaga sp. have also been shown to oxidize thiosulfate to sulfate (Cytryn et al., 2005). Some 16S Hydrogenophaga-like sequences were also recovered from the sediment (Fig. 3). Phylogenetic comparison of these sequences showed that most Hydrogenophaga-like organisms in the groundwater were most closely related to Hydrogenophaga atypica (95–98% similarity) and Hydrogenophaga defluvii (91–98% similarity), while bacteria most closely related to Hydrogenophaga taeniospiralis (94–99% similarity) were only found in the sediment (Fig. S2).
In contrast to Hydrogenophaga sp. dominating the groundwater, Thiobacillus-like bacteria were only found in the sediment at the influent of the column (Fig. 6). This suggested that the conditions in this location were most favorable for their growth. The presence of Thiobacillus sp. in the sediment at the influent of the columns correlated well with the pronounced presence of SRB at this location and therefore the potential for the largest deposit of reduced sulfur species (Fig. 5). In general, bacteria of the genus Thiobacillus are able to oxidize reduced sulfur species (Schedel & Truper, 1980; Beller et al., 2006). Thiobacillus thiophilus (92–98% similarity), Thiobacillus thioparus (93–96% similarity), and Thiobacillus denitrificans (95–96% similarity) were the closest relatives of the Thiobacillus-like organisms found in these sediments (Fig. S3). Thiobacillus sp. are chemolithoautotrophic bacteria that use thiosulfate or hydrogen sulfide as an electron donor, with oxygen and nitrate acting as electron acceptors (Starkey, 1935; Parker & Prisk, 1953; Sublette & Sylvester, 1987; Kellermann & Griebler, 2009). Other Thiobacillus sp. are capable of catalyzing the oxidation of Fe(II) to Fe(III) (Nicolle et al., 2009).
Gallionella sp., which was also detected during the poststimulation period, is a microaerophilic iron oxidizer, commonly found in groundwater at the anaerobic/aerobic interface (Hallbeck & Karsten, 2005).
Unlike the bio-oxidation process where mineral-oxidizing bacteria were found both in the sediment and in the groundwater, biomass turnover seemed to be most pronounced in the groundwater. The biomass turnover process was characterized by the presence of organisms closely related to Sterolibacterium sp. (90–94% similarity) and Lysobacter sp. (89–98% similarity). These organisms are bacteria with the potential to use complex organic matter, such as decaying biomass. Sterolibacterium denitrificans was the closest match for the 16S sequences from the effluent groundwater samples (Fig. S4). It is therefore possible that following the end of biostimulation, soluble fractions of decaying biomass could have served as a source of carbon for these Sterolibacterium-like organisms. Additionally, Lysobacter sp., which produce proteases and chitinases, may have contributed to the carbon turnover from decaying biomass. Lysobacter daecheongensis (91–98% similarity) was the closest relative to the Lysobacter-like organisms found in the sediment and groundwater (Fig. S5).
The low abundance of Firmicutes was atypical, as previous experiments have suggested that the Firmicutes play an important role during and after biostimulation (Vrionis et al., 2005; N'Guessan et al., 2008). Field conditions are much more heterogeneous than the column sediments, which could have led to the lower initial numbers of Firmicutes in the column sediments than that of the average field sediments. A previous study has suggested that Firmicutes play an important role in uranium retention postbiostimulation (N'Guessan et al., 2008). Therefore, the absence of organisms from this phylum may explain the lower U(VI) reduction efficiency observed in this experiment.
Because iron or sulfur oxidizers scavenge the low DO levels (1–2 mg O2 L−1), as evidenced by the nondetectable DO levels in the effluent during the postbiostimulation phase, their activity may have protected the reduced uranium from remobilization (Moon et al., 2009). Uranium was detected in the column effluents during the first month, with the highest levels during the first 2 weeks of biostimulation. During this time, about 17% of the uranium that was immobilized during the biostimulation period was remobilized. As shown in Fig. 6, the Hydrogenophilaceae family, which includes Thiobacillus sp., was only detected for times longer than 2 weeks of postbiostimulation, when uranium loss from the columns was stabilizing. Therefore, although we cannot rule out that some oxygen reacted abiotically, the results from this study suggest that the activity of oxidizing bacteria contributes towards maintaining the low oxygen levels in the subsurface, hence preventing the reoxidation of U(IV) while these bacteria are actively consuming the DO.
Because uranium remobilization had taken place before the detection of these oxygen-consuming organisms, the results show that abiotic oxygen utilization (for the oxidation of reduced sulfur, iron, and organic carbon) seems to be too slow to prevent oxygen from reaching much of the reduced uranium. Hence, biological reoxidation processes will have to be included in models that are being developed to assess the fate and transport of uranium during biostimulation.
Acknowledgements
This research was funded by the Environmental Remediation Sciences Program (ERSP), Office of Biological and Environmental Research (OBER), US Department of Energy (DOE), Pacific Northwest National Laboratory Project 51882 ‘The Rifle, Colorado Integrated Field Research Challenge Site (IFRC)’. Financial support for this research was also provided by Brain Korea 21 Project (through the School of Earth and Environmental Sciences, Seoul National University) in 2009.
References
Supporting Information
Additional Supporting Information may be found in the online version of this article:
Fig. S1. Extractable iron (0.5 N HCl, 24 h) in column sediments during the poststimulation period.
Fig. S2. Phylogenetic tree comparing 16S rRNA gene sequences for organisms extracted from groundwater and sediment from the flow-through columns.
Table S1. Bacterial numbers in the column sediments as a function of time during the postbiostimulation period.
Please note: Wiley-Blackwell is not responsible for the content or functionality of any supporting materials supplied by the authors. Any queries (other than missing material) should be directed to the corresponding author for the article.
Author notes
Editor: Alfons Stams
Present address: Hee Sun Moon, School of Earth and Environmental Sciences, Seoul National University, Seoul 151-742, Korea.
