


Abstract
We studied the effect of ectomycorrhizas and fertilization on soil microbial communities associated with roots of 10-year-old loblolly pine. Ectomycorrhizas were identified using a combination of community terminal restriction fragment profiling and matching of individual terminal restriction fragments to those produced from ectomycorrhizal clones and sequences recovered from roots and sporocarps. Differences between bacterial communities were initially determined using cluster analysis on community terminal restriction fragment profiles and through subsequent recovery of 16S rDNA clones. Analysis of bacterial clones revealed that terminal restriction fragment length was often shared between taxonomically dissimilar bacterial types. Consequently, we could not reliably infer the identity of peaks in the bacterial community profile with some exceptions, notably chloroplast rDNA that generated an approximate peak size of 80.2 bp. Fertilization increased the frequency of a Piloderma-like ectomycorrhiza. However, we did not detect clear effects of fertilization or the presence of viable ectomycorrhizas on bacterial communities. Bacterial communities seemed to be determined largely by the carbon and nitrogen content of soil. These results suggest that important soil microbial groups respond differently to soil conditions and management practices, with ectomycorrhizal communities reflecting past nutrient conditions and bacterial communities reflecting current environmental conditions of soil microsites.
Introduction
The functional and taxonomic diversity of soil microbes is influenced by plant growth processes, including the growth of plant roots that can locally affect the chemistry of the rhizosphere through the exudation of carbon and the excretion and absorption of chemical ions (Grayston et al., 1996; Paul & Clark, 1996; Westover et al., 1997; Semenov et al., 1999; Marschner et al., 2001). The effect of plants on associative (free-living) soil microbes can be altered by the presence of symbiotic organisms that colonize plant roots, such as ectomycorrhizal fungi. Ectomycorrhizal fungi can influence microbial communities by altering root physiology and morphology, which can affect patterns of rhizosphere modification and alter the quantity and quality of carbon in the rhizosphere (Ling-Lee et al., 1977; Reid et al., 1983; Reid, 1984; Linderman, 1988; Rygiewicz & Andersson, 1994; Sun et al., 1999; Khetmalas et al., 2002; Johnson et al., 2002). Mycorrhizal tips and the vegetative mycelium represent a niche that is ideally suited for the enrichment of associative bacteria. Mycorrhizal colonization can alter soil oxygen tensions, soil moisture, soil pH and nutrient availability (Reid, 1984; Rygiewicz et al., 1984; Li et al., 1992; Rózycki et al., 1999; Sen, 2000; Hawkes, 2003). The importance of bacterial association with mycorrhizal roots has been highlighted in the identification of mycorrhizal helper bacteria that improve both mycorrhizal and plant growth (Garbaye, 1994; Enebak et al., 1998; Poole et al., 2001), and in the identification of specific groups of soil bacteria, such as Betaproteobacteria and Gammaproteobacteria, that may associate with mycorrhizas (Burke et al., 2002, 2003; Khetmalas et al., 2002). Recent studies (Li et al., 1992; Perez-Moreno & Read, 2000; Sen, 2000) have suggested that N2 fixers may be associated with mycorrhizas, more specifically, in the mycorrhizosphere of forest trees, and that a close association between mycorrhizas and N2-fixing bacteria could contribute significantly to soil, fungal and plant nitrogen in nutrient-poor soils (Li & Hung, 1987; Li et al., 1992; Rózycki et al., 1999; Perez-Moreno & Read, 2000; Sen, 2000; Hawkes, 2003). However, many studies that have examined mycorrhizal effects on bacterial communities have used culturing techniques (Li & Hung, 1987; Li et al., 1992; Timonen et al., 1998) that may not adequately capture bacterial diversity, as most bacterial species do not culture readily (Amann, 2000; Prosser, 2002).
On a larger scale, mycorrhizal fungi and the soil bacteria associated with them can be affected by fertilization. Fertilization typically leads to reduced species richness of ectomycorrhizal communities and a shift towards nitrophilic ectomycorrhizas that may be a function of differing sensitivities of various fungal species to nitrogen (Treseder & Allen, 2000; Lilleskov et al., 2002; Edwards et al., 2004). Fertilization may improve the mycelial growth of ectomycorrhizal species able to exploit nutrient-rich conditions (Edwards et al., 2004); however, evidence suggests that fertilization can reduce the amount of vegetative mycelium present in soil (Nilsson & Wallander, 2003). Although soil disturbance resulting from logging or organic matter removal in forests can affect bacterial communities (Khetmalas et al., 2002; Ponder & Tadros, 2002), including N2-fixing bacteria (Shaffer et al., 2000), the effect of nutrient enrichment from fertilization on bacterial communities may be less pronounced (Bååth et al., 1995; Sessitsch et al., 2001; Leckie et al., 2004). As carbon is considered to be the main factor limiting microbial growth in soil (Lynch, 1988), the greatest effect of fertilization on bacterial communities may be to alter the growth of ectomycorrhizas that affect the quantity and quality of carbon that enters rhizosphere soil.
Despite the fact that fertilization and symbiotic microorganisms, such as ectomycorrhizal fungi, can influence soil microbes, few field studies have characterized the microbial diversity and community structure in nutrient-poor forest soils using molecular techniques. In this study, we examine how viable ectomycorrhizal tips and 10 years of fertilization have affected the community structure of soil bacteria associated with the roots of loblolly pine (Pinus taeda L.), an important tree species in the southeastern United States. The aim of our study was to examine the interaction between fertilization and the presence of ectomycorrhizas on soil bacterial diversity, including the N2-fixing functional group that may be especially important in nutrient-poor soils. In a previous study, we generated a database of fungal terminal restriction fragments (TRFs) of ectomycorrhizal fungi from our field site (Burke et al., 2005). Here, we match fungal TRFs to this database to identify and compare ectomycorrhizas occurring in fertilized and nonfertilized treatments. In addition, we use bacterial community TRF profiles to assess the impact of both ectomycorrhizas and fertilization on bacterial community composition. Bacterial community TRF profiles were generated from both the 16S rRNA gene representing the general bacterial community and from the nifH gene representing the N2-fixing community. Finally, we also cloned and sequenced 16S rRNA and nifH gene sequences from soil samples, and were able to match TRFs from recovered sequences to certain peaks occurring in our community profiles.
Materials and methods
Site description and soil sampling
The study site is a 10-year-old loblolly pine plantation located in Scotland County, NC, adjacent to the United States Department of Agriculture Forest Service/North Carolina State University Southeastern Tree Research and Education Site (SETRES). Soils at the site are excessively drained, nitrogen- and phosphorus-deficient sandy loams (>90%) with a total water holding capacity of 12–14 cm in a 2 m soil profile. The site receives annual precipitation of c. 120 cm, with temperatures that average 26 and 9°C in the summer and winter, respectively. Between November 1993 and January 1994, 20 000 seedlings of five open pollinated loblolly pine families from North and South Carolina [Atlantic Coastal Plain (ACP) ecotype] and five families representing a drought-hardy Texas (TX) ecotype were field planted on the site with an additional 20 000 buffer seedlings. The site had previously been occupied by an existing 10-year-old loblolly pine stand that was removed prior to planting. The pine plantation is regularly mown to discourage the growth of other plant species. Because plant species may have an important effect on soil bacterial communities, the plantation allows us to minimize confounding effects that might be introduced by other co-occurring plants (Bardgett et al., 1999; Rösch et al., 2002). Every spring since planting, one-half of the plots have received annual soil fertilizer additions to maintain optimum foliar nutrient ratios (Hockman & Allen, 1990), whereas nonfertilized plots have received no nutrient additions. Fertilizer is applied in late spring and the trees in the fertilized treatment received the following total nutrient additions (kg ha−1) during the first 10 years: N, 729; P, 74; K, 78; Ca, 8.2; Mg, 46; S, 160; B, 0.5; Cu, 2; Fe, 5; Mn, 5; Zn, 2. Fertilizer has been applied either in inorganic form, such as ammonium sulfate, or as urea. For the 3 years prior to our sampling, fertilizer was applied as urea (S.E. McKeand, pers. commun.). Trees in fertilized plots have responded to increased nutrient availability and are 68% taller (S.E. McKeand, pers. commun.) and produce 88% more fine roots (D.J. Burke, unpublished data) than do comparable trees in nonfertilized plots.
Soil cores were collected from a fast-growing ACP family in March 2004 (before annual fertilizer application) to a depth of 20 cm with a metal coring device measuring 15 cm in diameter (3.5 dm3). Cores were collected from family plots located within one block that is split into a nonfertilized and fertilized treatment. Replicate plots were not sampled because of large microclimatic variability between block locations. Each family plot consists of 10 rows of 10 trees planted at 1.5 m (within row) × 2.0 m (aisle) spacing. Six soil cores were collected from six randomly chosen trees in the nonfertilized plot and an additional six cores were collected from six randomly chosen trees in the fertilized plot. Cores were generally more than 4 m away from the nearest adjacent core and were taken 50 cm from the bole of the selected tree within the planted row. As microbial communities are generally patchy at very fine scale (Boone et al., 1999), we consider these samples to be independent for the purpose of microbial community analyses. Collected samples were sieved at the site with a 0.5 cm mesh screen to separate pine roots from soil. Sieved roots and soil adhering to roots from each core were stored at 4°C until processed in the laboratory.
In these dry sandy soils, ectomycorrhizal root tips of loblolly pine are typically surrounded by a ‘ped’ of organic soil that may be held together by fungal hyphae. Results from previous work at this site have indicated that the percentage of carbon in the peds is three times higher than that in bulk soil (organic peds, 2.5% C; bulk soil, 0.8% C; M.A. Topa, unpublished data). As the characteristics of bulk soil are very different from those of organic soil peds found around root tips, comparing microbial communities in organic soil peds containing ectomycorrhizal root tips with communities in bulk soil can be confounded by differences in soil texture, and carbon and nutrient contents. Consequently, we limited our analysis to organic soil peds, sorting them by whether they contained viable or decaying ectomycorrhizal tips. In the laboratory, each soil ped was examined under a dissecting microscope (at 40 × magnification) to determine the presence of viable or decaying mycorrhizal tips. All apparently viable ectomycorrhizal root tips and adhering soil within each core were collected in 15 mL centrifuge tubes, kept on ice and subsequently frozen at −70°C. Similarly, soil peds in each core found to contain visibly decaying ectomycorrhizal tips were also pooled and handled as described above. In this fashion, we could compare soil of similar textural quality within each core and determine the extent to which viable ectomycorrhizal roots affect bacterial communities.
Analysis of soil quality
A subset of soil peds was used for the analysis of total carbon and nitrogen, and the determination of soil pH. Prior to analysis of soil carbon and nitrogen, soil was dried at 70°C for 4 days. Root tissue present within the samples was removed under a dissecting microscope and soil samples were ground for analyses. The percentages of soil carbon and nitrogen (percentage dry weight) were determined by the Cornell University Stable Isotope Laboratory (COIL) using a Europa Scientific ANCA-SL stable isotope analysis system (Europa Scientific, Crewe, UK). Soil pH was determined using a modification of the glass electrode method (Robertson et al., 1999) with a soil to deionized water ratio of 1 : 4 (weight in volume, w/v).
DNA extraction and purification
DNA was extracted from soil containing viable and decaying ectomycorrhizal tips using a bead beating/freeze-thaw extraction protocol. Soil samples with a fresh weight of 0.5 g were suspended in 2% CTAB and bead beaten for 3 min on a Harbil 5G-HD mixer (Fluid Management, Wheeling, IL). Samples were immediately placed in a 65°C water bath for 5 min, and then incubated at −70°C for 5 min before returning them to the 65°C water bath. Three freeze–thaw cycles were completed to further assist in cell lysis. Nucleic acids were then purified by phenol–chloroform extraction, and precipitated with polyethylene glycol 8000 in 2.5 M NaCl (Ogram, 1998). DNA was resuspended in 100 μL of Tris–EDTA buffer and used as template for PCR.
Analysis of ectomycorrhizal fungi by polymerase chain reaction-terminal restriction fragment length polymorphism (PCR-TRFLP)
For ectomycorrhizal analyses, primer sets were used that amplified the first internal transcribed spacer (ITS1) between the 18S (small subunit) and 5.8S rRNA genes (Burke et al., 2005; Martin & Rygiewicz, 2005). The forward primer NSI1 (small subunit) was labeled with the fluorochrome 6-carboxyfluorescein and the reverse primer 58A2R (5.8S rRNA) was labeled with 5-hexachloro-fluorescein (Burke et al., 2005). PCR was carried out in 50 μL reaction volumes, as described previously (Burke et al., 2005). PCR on soil with decaying tips generally did not provide detectable amplicon, which required a second round of amplification. First-round amplicon was made with unlabeled NSI1 and 58A2R primers, and c. 1 μL of first-round amplicon was then used for reamplification with labeled primers. Labeled amplicon was used to generate TRFLP with the endonuclease AluI. In previous work, AluI was found to provide the greatest number of diagnostic restriction fragments at our field site (Burke et al., 2005). TRFLPs were generated on an ABI 3100 Genetic Analyzer (Applied Biosystems, Foster City, CA) using size standard GS500 ROX and Genescan software. For the last 2 years, this ITS1 primer set has been used for the analysis of ectomycorrhizal fungi colonizing loblolly pine at the Scotland County field site (Burke et al., 2005). We have compiled a site-specific database of fungal TRFs and sequences of ectomycorrhizas colonizing loblolly pine or occurring as sporocarps (Burke et al., 2005). TRFs within each sample were compared with our database, and both forward and reverse primers were used to identify ectomycorrhizal fungi present on root tips and in adhering soil. If generated TRFs did not match any listed in our database, the fungal phylotype was recorded as unknown. For our purposes, a phylotype consists of an ectomycorrhizal sequence type with a unique set of TRFs.
Analysis of soil bacteria by PCR-TRFLP and sequence recovery
For analyses of bacterial communities, PCR was used to target the 16S (small subunit) rRNA gene using Bacteria domain primers 338f and 926r (Muyzer et al., 1993, 1995). These primers were chosen because they, or slight variations thereof, are commonly used in soil bacterial community analyses, and have been shown to amplify a wide range of bacteria (Liu et al., 1997). PCR was performed in 50 μL reaction volumes using 0.2 μM of unlabeled forward primer 338f and 6FAM-labeled reverse primer 926r, 2.0 mM MgCl2, 0.2 mM dNTP, 0.5 mg L−1 bovine serum albumin (BSA), 0.5 U Taq DNA polymerase (Promega, Madison, WI) and 0.1 μL of template DNA on a PTC 100 Thermal Cycler (MJ Research, Boston, MA). An initial denaturation and enzyme activation step of 5 min at 94°C was followed by amplification for 35 cycles with the following conditions: 30 s at 94°C, 45 s at 56°C, 60 s at 72°C. A final 5 min extension at 72°C completed the protocol. PCR typically yielded 10 ng μL−1 of labeled amplicon. Endonucleases MspI and TaqI were used to generate TRFLPs that served as separate measures of bacterial diversity. TRFLPs were analyzed on an ABI 3100 Genetic Analyzer (Applied Biosystems) using the GS500 LIZ size standard and Genescan software.
Replicate TRFLPs generated through separate PCRs from the same sample typically yielded the same major TRFs. For our analysis, only peaks with greater than 50 fluorescence units (scale of 3000) were included (i.e. major TRFs). Peaks not included accounted for less than 3% of the total TRFLP integrated peak area. This may provide a more conservative estimate of bacterial diversity, but reduces the chance that nonspecific TRFs will be included (Dunbar et al., 2001). The relative percentage peak area (integrated fluorescence) for each sample was calculated by dividing the peak area of each identified TRF by the total area of all peaks within the TRFLP, and then used for cluster and statistical analysis between samples (Liu et al., 1997; Suzuki et al., 1998).
338f/926r amplicons from selected soil samples were cloned as follows. Unlabeled amplicon of the correct size [c. 588 base pairs (bp)] was isolated on low-melting agarose, excised and purified using a QIAquick Gel Extraction Kit (QIAGEN Inc., Valencia, CA), according to the manufacturer's instructions. Purified amplicon was cloned using a QIAGEN Cloningplus Kit (QIAGEN Inc.) following the manufacturer's instructions. Individual colonies were grown overnight at 37°C in Luria–Bertani medium, and the cultures were used for the screening of inserts by PCR with plasmid-specific primers SP6 and T7 and gel electrophoresis. Plasmids with correctly sized inserts were harvested from cell cultures using a QIAprep Miniprep Plasmid Purification Kit (QIAGEN Inc.). Plasmid inserts were amplified with primers 338f and 926r (6FAM) using the PCR conditions described above. Labeled PCR product was used to generate TRFLP for each clone using the restriction enzyme TaqI. A minimum of 100 clones was screened for each of two soil samples representing the major bacterial community groups (clusters 1 and 5, Fig. 1) identified through cluster analysis. Clones representing major TRF types were sequenced through the Cornell Bioresource Center using an Applied Biosystems 3730 × l DNA Analyzer. Generated sequences were compared with EMBL/GenBank/DDBJ database entries using the fasta program (European Bioinformatics Institute, Hinxton, UK) to determine the putative identity of bacterial phylotypes.
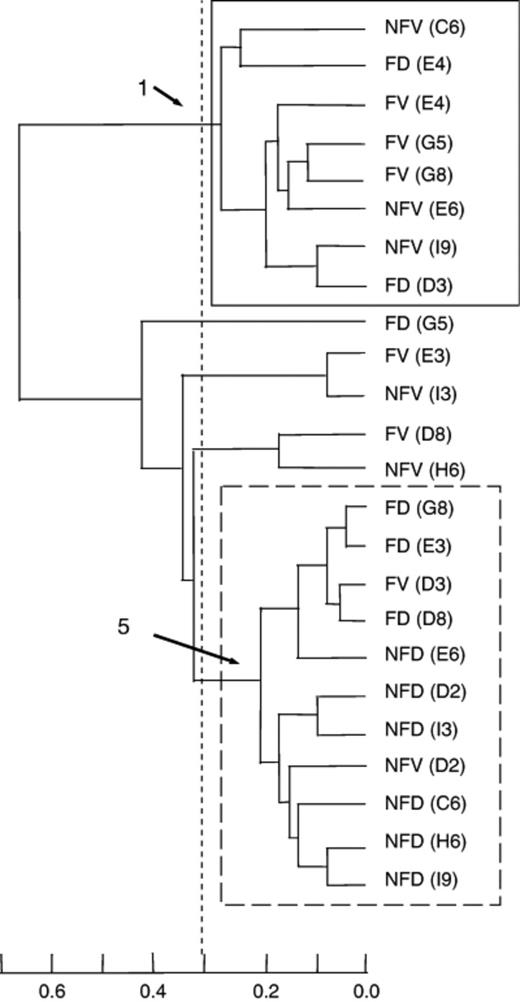
Cluster analysis of TaqI terminal restriction fragments (TRFs) resulting from the amplification of soil bacterial communities. The analysis excludes TRFs of 80–80.3 bp that most likely result from the amplification of chloroplast 16S rRNA gene. The scale on the bottom indicates the level of dissimilarity between soil bacterial communities. Samples with dissimilarities of less than 0.3 are considered to form a cluster. NFV, nonfertilized viable ectomycorrhizal tip; NFD, nonfertilized decaying ectomycorrhizal tip; FV, fertilized viable ectomycorrhizal tip; FD, fertilized decaying ectomycorrhizal tip. Letter and number in parentheses indicate the row and number of the tree near which the sample was collected. Samples that comprise clusters 1 and 5 are noted.
Analysis of N2-fixing bacteria by PCR-TRFLP and sequence recovery
For analyses of N2-fixing communities, a nested PCR targeting nifH was employed using primer sets and conditions following Widmer et al., (1999). Unlabeled first-round amplicon was amplified using 6FAM-labeled primer nifH (for B) and unlabeled primer nifH (for Rev), and TRFLP was generated from this second-round amplicon using endonucleases AluI and HaeIII, as described for the analysis of soil bacteria. As nifH patterns did not vary substantially between the samples, only one soil sample was chosen for cloning and TRFLP screening. Purified amplicon was cloned using a pGEM-T Easy Vector System (Promega), following the manufacturer's instructions. Plasmid inserts were amplified with labeled primer nifH (for B) and unlabeled primer nifH (for Rev), and used to generate TRFLP for each clone using the restriction enzyme HaeIII. Sequences were generated at the Boyce Thompson Institute sequencing facility (Ithaca, NY) using an Applied BioSystems Prism 3100 Genetic Analyzer/DNA Sequencer. Sequences were compared with database entries, as described above, to determine their putative identity.
Sample and statistical analysis
The diversity of the bacterial communities was estimated using identified TRFs within each sample TRFLP profile. Bacterial richness was considered as the total number of TRFs detected within a TRFLP profile. Bacterial evenness was determined by calculating Hurlbert's probability of an interspecific encounter (PIE) for each soil sample. The relative peak area of each identified TRF within a sample was used for these calculations, and the calculations were performed using EcoSim (Gotelli & Entsminger, 2001). t-tests were used to determine whether statistically significant differences existed between soils with viable or decaying ectomycorrhizal tips or between nonfertilized and fertilized samples for soil physicochemical conditions, bacterial richness and evenness (PIE). Logistic regression was used to determine whether the presence of ectomycorrhizal phylotypes was affected by soil physicochemical conditions. Cluster analysis (Ward's method) was used to determine whether the presence of viable or decaying ectomycorrhizal tips or fertilization affected bacterial community composition (Blackwood et al., 2003). For cluster analysis, the relative percentage peak area was used for each identified TRF from a sample. The peak area in this analysis was substituted for and is analogous to the ‘band intensity’, which is used for the analysis of traditional RFLP patterns (Liu et al., 1997). All statistical analyses were completed using procedures available through Jump Statistical Software (SAS Institute, Cary, NC).
Results
Analysis of soil quality
There were no significant differences in pH, percentage of carbon or percentage of nitrogen between soil samples containing viable vs. decaying ectomycorrhizal tips or between nonfertilized vs. fertilized treatments as determined by Student's t-test (Table 1). Samples subsequently identified as belonging to bacterial cluster 1 had a significantly greater percentage of carbon (tstat=2.4, P=0.03) than samples from bacterial cluster 5, and significantly greater soil percentage of nitrogen (tstat=2.5, P=0.02). The pH was not significantly different between the samples and ranged between pH 4.6 and pH 5.0.
Analysis of percentages of carbon and nitrogen (percentage dry weight) in soil containing viable and decaying ectomycorrhizal (ECM) tips from both nonfertilized and fertilized samples
| Sample description | Carbon (%) | Nitrogen (%) | C : N ratio |
| Nonfertilized soil | |||
| Viable ECM tips | 4.2 (0.7) NS1 | 0.12 (0.03) | 35.4 (3.0) |
| Decaying ECM tips | 3.0 (0.7) | 0.08 (0.02) | 36.6 (2.4) |
| Fertilized soil | |||
| Viable ECM tips | 4.4 (0.9) NS2 | 0.15 (0.02) | 31.6 (1.3) |
| Decaying ECM tips | 3.6 (1.1) | 0.11 (0.03) | 30.8 (2.2) |
| Grouped by cluster | |||
| Soil cluster 1 | 5.2 (0.9) | 0.16 (0.03) | 31.7 (1.3) |
| Soil cluster 5 | 2.9 (0.4) | 0.08 (0.02) | 33.6 (1.8) |
The mean ± SEM is shown (n=6).
NS1 tstat=1.2, P=0.27.
NS2 tstat=0.6, P=0.58.
Analysis of ectomycorrhizal fungi by PCR-TRFLP
By matching TRFs to ectomycorrhizal fungi from the site that had previously been identified and sequenced, we were able to detect 15 phylotypes (Table 2). TRFs that matched those of a Tomentella-like phylotype were the most frequently encountered, occurring in 58% and 67% of nonfertilized and fertilized samples, respectively. In fertilized soils, TRFs matching a Piloderma-like phylotype were found in 92% of samples, whereas this phylotype was encountered in only 8% of nonfertilized samples (Table 2). Nonfertilized soil with decaying ectomycorrhizal tips often contained TRFs that matched a Cenococcum-like phylotype previously encountered at the field site (Table 2). Some phylotypes were only observed in soil with decaying ectomycorrhizal tips, such as the basidiomycete phylotype and an Amanita-like phylotype; however, these phylotypes were infrequently encountered. Despite the patchy nature of the distribution of ectomycorrhizas, the occurrence of the four most common ectomycorrhizas was significantly affected by fertilization, as indicated by correspondence analysis (likelihood ratio χ2=18.3, P<0.001), with the Piloderma-like phylotype more likely to occur in fertilized soil. Logistic regression analysis suggested that the probability of encountering the Tomentella-like phylotype decreased with increasing soil percentage of carbon and nitrogen (χ2=6.5, P=0.01 and χ2=6.4, P=0.01, respectively), whereas the probability of encountering the Piloderma-like phylotype decreased with increasing C : N ratio (χ2=3.5, P=0.06).
Detection of fungal phylotypes in soil samples
| Sequence accession number | Fungal type | Identity (%) | ITS1-TRF | Frequency | ||||
| NSI1 | 58A2R | NFV | NFD | FV | FD | |||
| AY394919 | Cenococcum sp. | 99 | 264 | 62 | 17 | 83 | 17 | 50 |
| AJ534899 | Laccaria sp. | 96 | 66 | 260 | 17 | 17 | 17 | 17 |
| AJ534912 | Tomentella sp. | 92 | – | 390 | 50 | 67 | 83 | 50 |
| AJ534912 | Tomentella sp. | 90 | 66 | 133 | ND | ND | 17 | 17 |
| AY456372 | Tylopilus sp. | 98 | 66 | 236 | ND | ND | 17 | ND |
| AY097053 | Piloderma sp. | 98 | 66 | 217 | ND | 17 | 83 | 100 |
| AF430292 | Basidiomycete | 77 | – | 362 | ND | ND | ND | 17 |
| AB015676 | Amanita sp. | 92 | 66 | 333 | ND | 33 | ND | 17 |
| AY456371 | Tylopilus sp. | 99 | 65 | 370 | ND | 17 | ND | ND |
| AJ534936 | Lactarius sp. | 92 | – | 427 | ND | 17 | ND | ND |
| NA | Unknown | NA | 64 | 361 | ND | 17 | ND | ND |
| AJ515395 | Rhizopogon sp. | 96 | 62 | 306 | 67 | 33 | ND | ND |
| NA | Unknown | NA | 66 | 289 | 17 | 17 | ND | ND |
| AJ53490 | Lactarius sp. | 90 | – | 409 | 17 | 17 | ND | ND |
| AY061726 | Russula sp. | 93 | – | 406 | 17 | 17 | ND | ND |
Fungal type identification is based on terminal restriction fragment (TRF) matching to a previously compiled sequence and TRF database for our loblolly pine field site (Burke et al., 2005). Sequences of the rDNA ITS region were generated in an earlier study and compared with EMBL database entries using the fasta program (European Bioinformatics Institute, Hinxton, UK) (Burke et al., 2005). The percentage identity and accession number of the best database match to our sequence is noted.
TRF size generated with labeled primers NSI1 and 58A2R that amplify the ITS region of rRNA. – indicates that the amplicon is unrestricted and a similar size peak appears with both labeled primers.
The percentage of samples (out of six) in which the indicated phylotype was detected.
NFV, nonfertilized viable ectomycorrhizal tip; NFD, nonfertilized decaying ectomycorrhizal tip; FV, fertilized viable ectomycorrhizal tip; FD, fertilized decaying ectomycorrhizal tip. ND indicates that the phylotype was not detected in that soil core.
Analysis of soil bacterial communities by PCR-TRFLP
Sequencing indicated that as many as 28% of cloned 16S rRNA gene sequences had high sequence identity to 16S rRNA gene from Pinus spp. chloroplasts. This was to be expected, because extracted soil samples contained ectomycorrhizas, which are known to contain abundant plastid DNA (Brunner et al., 2001), and because most commonly used 16S rRNA gene primers also amplify plastid sequences (Weidner et al., 2000; Sakai et al., 2004). Clones with sequence affinities to Pinus chloroplast DNA produced TRFs of c. 243.9 bp (MspI) and 80.2 bp (TaqI), respectively, and peaks of that size were excluded from all subsequent analyses.
Bacterial communities varied between soil samples and also with the restriction enzyme used. With TaqI, bacterial richness was greater in soil with decaying ectomycorrhizal tips (F=4.3, P=0.05) than in soil with viable ectomycorrhizal tips. However, bacterial evenness (PIE) was significantly reduced by fertilization (F=4.6, P=0.04) (Table 3). These relationships were not observed with the endonuclease MspI. Cluster analysis using TaqI TRFLPs indicated the presence of five distinct clusters (Fig. 1). Cluster 1 consisted of eight samples from both fertilized and nonfertilized plots; six of these samples contained viable ectomycorrhizal tips. Another major group was cluster 5, which consisted of 11 of 24 analyzed soil samples, and contained mostly samples with decaying ectomycorrhizal tips. These patterns were substantially repeated using MspI TRFLPs for cluster analysis (data not shown). Thus, although cluster analysis did not reveal any clear distinction between fertilized and nonfertilized treatments or between soils containing viable and decaying ectomycorrhizal tips, there was a trend towards clustering of communities from viable vs. decaying ectomycorrhizal tips.
Comparison of bacterial diversity in soil associated with loblolly pine roots using primers 338f and 926r
The mean ± SEM is shown (n=6).
Richness is the number of terminal restriction fragments (TRFs) generated with the 6-carboxyfluorescein-labeled reverse primer 926r.
Evenness was calculated using Hurlbert's probability of an interspecific encounter (PIE).
The clone sequences represented a wide range of bacterial taxa (Table 4). Sequences resembling the Proteobacteria were the most frequently encountered, comprising 43% and 29% of sequences recovered from cluster 1 and 5 soils, respectively (Table 4). Sequences resembling the Alphaproteobacteria accounted for 28% of the recovered clones from clusters 1 and 5, whereas sequences resembling the Betaproteobacteria and Gammaproteobacteria represented 14% and 3%, respectively. Sequences with affinity for the Acidobacteria represented c. 19% and 16% of the clones sequenced from cluster 1 and 5 soils, respectively, whereas Actinomycete-like sequences constituted 14% and 27% of sequences recovered from cluster 1 and 5 soils, respectively. However, we often found it difficult to infer confidently the taxonomic identity of TRFs observed in the bacterial community profile. In many instances, clones representing a sequence type displayed TRFs of very similar size. This was the case for Pinus chloroplast DNA as noted above, as well as for clones with affinity for the genus Pelotomaculum that produced TaqI TRFs between 81.04 and 81.67 bp. However, clones representing different bacterial sequence types often shared TRF lengths, and clones with similar taxonomic affinity often displayed very different TRF lengths (data not shown). Consequently, TRFLP community profiles were most useful for assessing overall community and diversity differences between soil types and treatments. Sequences recovered in this study are listed under EMBL/GenBank/DDBJ accession numbers AM039551–AM039623.
The sequence affinity of selected clones representing major bacterial groups obtained in this study
| Recovered sequence | Bacterial type | Identity (%) | Division |
| 16S (AMO39560) | Bradyrhizobium sp. (AB121773) | 91 | Alphaproteobacteria |
| 23S (AMO39565) | Blastochloris sp. (AJ401203) | 91 | |
| 25S (AMO39566) | Stella sp. (AJ535710) | 92 | |
| 42S (AMO39570) | Rhodoplanes sp. (AF487437) | 96 | |
| 47A (AM039573) | Rhizobiales sp. (AB174822) | 93 | |
| 76S (AMO39578) | Phenylobacterium sp. (AB166881) | 97 | |
| 94S (AMO39584) | Acetobacter sp. (AJ419842) | 95 | |
| 96S (AMO39585) | Rhodopila sp. (D86513) | 96 | |
| 8A (AMO39587) | Burkholderia sp. (AY154379) | 98 | Betaproteobacteria |
| 30S (AMO39568) | Nitrosococcus sp. (AF287298) | 88 | Gammaproteobacteria |
| 66A (AMO39602) | Flexibacter sp. (AF181568) | 92 | Bacteroidetes |
| 2S (AMO39552) | Acidobacterium sp. (D26171) | 95 | Acidobacteria |
| 8S (AMO39556) | Unknown actinomycete (X68468) | 96 | Actinobacteria |
| 9S (AMO39557) | Mycobacterium sp. (AJ748837) | 99 | |
| 43S (AMO39571) | Pelotomaculum sp. (AB091323) | 84 | Firmicutes |
| 44A (AMO39613) | Pinus chloroplast (D17510) | 99 | Chloroplast 16S |
Identification is based on sequencing of the 16S rRNA gene (588 bp in length) and comparison with EMBL database entries using the fasta program (European Bioinformatics Institute, Hinxton, UK). The accession number of the best database match to the recovered sequence is noted. The percentage identity is also shown.
The clone numbers and accession numbers of representative sequences recovered in this study are shown. The letters indicate whether the clone was recovered from soil containing viable ectomycorrhizal tips (A) or decaying ectomycorrhizal tips (S).
Where possible, the best match to a named sequence type is presented here for purposes of determining taxonomic affinity. In some cases, our recovered sequence is a better match to an unnamed bacterial type.
Analysis of N2-fixing bacteria by PCR-TRFLP
The nifH TRFLPs were very similar amongst the 24 soil samples, and tended to be dominated by one or two TRFs regardless of the restriction enzyme used. TRFLPs generated with endonuclease HaeIII were dominated by TRFs of c. 184–186 bp in size. Two TRFs of c. 158 and 361 bp were also detected in all soil types. TRFLPs produced with AluI were dominated by an c. 101 bp TRF, and additional minor peaks were also infrequently encountered with this restriction enzyme (data not shown). Although the dominant peaks occurred consistently within each soil sample, minor peaks were highly variable. Through sequence analysis we found that most of the recovered clones possessed TRFs that matched the dominant TRFLP peaks within 1–2 bp. These clones were closely related to the Alphaproteobacteria and appeared most similar to uncultured N2-fixing bacteria isolated from Douglas fir forest soil (AF099798), or to uncultured N2-fixing bacteria isolated from oak–hornbeam forest soil (AF315428). Sequences recovered in this study are listed under EMBL/GenBank/DDBJ accession numbers AJ871098–AJ871114.
Discussion
Occurrence of ectomycorrhizal fungi
We found that the distribution of ectomycorrhizal phylotypes varied between soils, with some effect of fertilization. A Piloderma-like phylotype appeared to be more frequent in fertilized soil cores, whereas our Tomentella-like phylotype was found equally in nonfertilized and fertilized samples. The preference for the Piloderma-like phylotype in fertilized plots was also revealed by logistic regression, which showed that the Piloderma-like phylotype was unlikely to be present in soil with high C : N ratios. Differences in the response of the fungal phylotypes to fertilization may reflect differences in the individual environmental preferences of the ectomycorrhizal fungi. Edwards et al., (2004) observed similar effects of fertilization on ectomycorrhizal fungal species, and a shift towards dominance by ectomycorrhizal phylotypes in the Thelephoraceae (Tomentella-like phylotypes) in a 16-year-old loblolly pine plantation near our Scotland County site. Differences between our study and the study by Edwards et al. may reflect seasonal differences in ectomycorrhizal root colonization, or differences between sites related to stand age and changes in soil environment. Fertilization typically reduces ectomycorrhizal root colonization and alters ectomycorrhizal fungal community composition towards nitrophilic types (Treseder & Allen, 2000; Lilleskov et al., 2002; Edwards et al., 2004). Increases in soil nitrate and the nitrification potential of soil have been linked to changes in ectomycorrhizal fungal communities with fertilization (Lilleskov et al., 2002; Edwards et al., 2004). However, other investigators have observed that decreases in ectomycorrhizal hyphal growth may not be caused by soil nitrogen levels, but by changes in the nitrogen status of trees subject to fertilization (Nilsson & Wallander, 2003). Fertilization at the field site is intended to optimize foliar nutrient levels. Although clear differences for soil nitrogen were not detected, differences in the nutrient status of the tree could be responsible for qualitative differences in the identity of ectomycorrhizas between nonfertilized and fertilized cores.
Effect of fertilization and ectomycorrhizas on bacterial diversity in the rhizosphere
Although bacterial evenness (PIE) was significantly reduced by fertilization, TRFLP profiles did not cluster according to fertilizer treatment. Post hoc analysis of soil chemical conditions revealed a significant difference between soil that formed bacterial cluster 1 and soil that formed bacterial cluster 5. Soil that formed bacterial cluster 1 had significantly greater percentages of carbon and nitrogen than soil that formed bacterial cluster 5. As soil carbon and nitrogen content may be one of the most important factors affecting bacterial distribution in soil, variation in soil chemical conditions may partly explain the different bacterial communities detected in our study (Lynch, 1988; Poly et al., 2001). Our results suggest that previous large-scale fertilization of the pine plots may be less important to bacterial communities than the current nutrient conditions of soil microsites. However, as this pattern was observed with only one of the restriction enzymes used, factors not measured in this study may also contribute to the differences in bacterial diversity. Bacterial communities have been found to respond more strongly to organic fertilizer amendments, such as compost, that may also increase soil carbon contents, than inorganic amendments (Sessitsch et al., 2001). As fertilization at the field site is performed once annually, usually in late spring, the effect of fertilization on key soil conditions may have diminished by the time we took our samples in the following year. Additional work immediately after the application of fertilizer is necessary to determine the short-term effects of fertilization on the bacterial diversity in these soils.
There is some evidence to suggest that viable ectomycorrhizal roots affected the diversity or community structure of soil bacterial populations relative to decaying ectomycorrhizal roots. Bacterial richness (the number of TRFs) was lower in soil associated with viable vs. decaying ectomycorrhizal tips; however, the pattern was only observed with one of the two restriction enzymes used. Furthermore, there seemed to be a weak trend for bacterial TRFLP profiles to cluster according to whether they were associated with viable or decaying ectomycorrhizal tips. Whereas previous work examining the effect of ectomycorrhizal roots on soil bacteria has used either culture-dependent techniques or serially washed root tips (Timonen et al., 1998; Khetmalas et al., 2002), we examined bacteria in all the soil physically adhering to ectomycorrhizal tips. The effects of ectomycorrhizal fungi may be spatially dependent and most pronounced on rhizoplane bacteria (Timonen et al., 1998) that adhere to the surface of the root or ectomycorrhizal mantle. Because our samples also contained rhizosphere soil, bacteria not attached to the root or ectomycorrhizal mantle, but present within the soil surrounding the root tips, were included in our analyses. This may have diluted out the effect of ectomycorrhizal root tips on bacteria by including populations not immediately influenced by the ectomycorrhizas. However, as soil with both viable and decaying ectomycorrhizal tips contained fungal hyphae, it is difficult to determine from the current study whether bacterial communities would have been different in soil not colonized by ectomycorrhizal hyphae.
Molecular characterization of bacteria from loblolly pine root zones
To our knowledge, this is the first study to examine bacterial communities in the root zone of loblolly pine using molecular techniques. Nonetheless, the bacterial communities resembled those observed by other researchers in the root zone of pine in the southwestern United States (Kuske et al., 1997; Dunbar et al., 1999). Many of the recovered sequences resembled Gram-positive bacteria, including the Actinomycetes and Acidobacteria; together these accounted for about 40% of the recovered clones. The Gram-negative Proteobacteria accounted for only 37% of the sequences recovered. The perceived importance of Gram-positive bacteria may increase with the application of molecular techniques. Dunbar (1999) found that, by directly amplifying environmental DNA, a higher proportion of Acidobacteria clones was recovered relative to culture-dependent methods that seemed to favor the recovery of Gram-negative Proteobacteria. The reduced importance of Gram-negative Proteobacteria in our study may reflect our use of molecular techniques for the examination of bacterial soil communities and the environmental importance of bacterial types that do not culture readily.
Community structure of N2-fixing bacteria associated with pine roots
To our knowledge, this is also the first study to identify N2-fixing bacteria associated with the roots or rhizosphere soil of loblolly pine. The diversity of N2-fixing bacteria was relatively consistent in our samples, and our results are in agreement with other studies that found low levels of diversity amongst N2-fixing bacteria in forest soils (Widmer et al., 1999; Rösch et al., 2002). The diversity of N2-fixing bacteria can be affected by total soil carbon and nitrogen (Poly et al., 2001), but differences in the percentages of soil carbon and nitrogen in our study may not have been sufficient to affect this functional group. Although the percentages of carbon and nitrogen of soil collected from our pine plantation were most similar to those of shallow forest soil, where the highest numbers of N2-fixing bacteria were observed (Mergel et al., 2001), the soils at our study site were also phosphorus-limited. It is possible that phosphorus limitation exerts some control over N2-fixing communities, but this question requires additional study.
Conclusion
In this study, we analyzed the qualitative effects of fertilization and the presence of ectomycorrhizal roots on different soil microbial communities. Fertilization was found to have a significant effect on ectomycorrhizal fungi, but not on soil bacteria in general or N2-fixing bacteria specifically. In contrast, soil bacteria appeared to be somewhat affected by the presence of viable or decaying ectomycorrhizal tips and, to a greater extent, by current microsite carbon and nitrogen percentages. These results indicate that important soil microbial groups respond differently to soil conditions and management practices, with ectomycorrhizal communities more likely to reflect past nutrient conditions and bacterial communities more likely to reflect current soil nutrient conditions.
Acknowledgements
This work was funded by NSF grants IBN-0212892 Ecology and Evolutionary Physiology Program (to M.A.T.) and DEB-0137531 (to A.M.K.). The authors thank Dr Steve McKeand for technical assistance in field sampling. The manuscript was subjected to the peer and administrative reviews of the United States Environmental Protection Agency at the National Health and Environmental Effects Research Laboratory, Western Ecology Division, and was approved for publication. Mention of trade names or commercial products in this paper does not constitute endorsement or recommendation of use.
References
