


Abstract
For the first time, the cyanobacterial diversity from microbial mats in lakes of Eastern Antarctica was investigated using microscopic and molecular approaches. The present study assessed the biogeographical distribution of cyanobacteria in Antarctica. Five samples were taken from four lakes spanning a range of different ecological environments in Larsemann Hills, Vestfold Hills and Rauer Islands to evaluate the influence of lake characteristics on the cyanobacterial diversity. Seventeen morphospecies and 28 16S rRNA gene-based operational taxonomic units belonging to the Oscillatoriales, Nostocales and Chroococcales were identified. The internal transcribed spacer was evaluated to complement the 16S rRNA gene data and showed similar but more clear-cut tendencies. The molecular approach suggested that potential Antarctic endemic species, including a previously undiscovered diversity, are more abundant than has been estimated by morphological methods. Moreover, operational taxonomic units, also found outside Antarctica, were more widespread over the continent than potential endemics. The cyanobacterial diversity of the most saline lakes was found to differ from the others, and correlations between the sampling depth and the cyanobacterial communities can also be drawn. Comparison with database sequences illustrated the ubiquity of several cyanobacterial operational taxonomic units and their remarkable range of tolerance to harsh environmental conditions.
Introduction
Previous studies have started producing an inventory of the molecular diversity of cyanobacteria in several biotopes (lake ice, lake water, cryoconite holes, cryptoendolithic biotopes, quartz stones and microbial mats) and hinted at the existence of genotypes found only in Antarctica (Priscu et al.,1998; Bowman et al.,2000; Smith et al.,2000; Vincent et al.,2000; Nadeau et al.,2001; Christner et al.,2003; De la Torre et al.,2003; Taton et al.,2003; Casamatta et al.,2005; Jungblut et al.,2005), the influence of salinity on the cyanobacterial community composition (Jungblut et al.,2005) and the psychrotolerance rather than psychrophily of most Antarctic cyanobacteria (Nadeau et al.,2001; Taton et al.,2003).
The dominance and success of cyanobacteria in Polar regions is well known. They are particularly abundant in lakes and ponds where they form benthic microbial mats (Vincent, 2000). However, the species diversity and geographical distribution of many polar cyanobacterial communities has yet to be thoroughly examined.
The Larsemann Hills and Vestfold Hills are located in the Prydz Bay (PB) region, and constitute two major ice-free areas in continental Eastern Antarctica of around 50 and 400 km2, respectively (Hodgson et al.,2001a).
The Larsemann Hills region consists of two main peninsulas, the western named Stornes and the eastern Broknes/Mirror, together with a number of scattered offshore islands. More than 150 freshwater lakes are found in the hills, ranging from small ephemeral ponds to large water bodies (Gillieson et al.,1990). In contrast to the rest of the PB region, parts of the Broknes Peninsula have remained ice-free during the last glacial maximum. Lakes originated from the exposure of basins after the retreat of the continental ice cap or after isolation due to isostatic uplift following deglaciation (Hodgson et al.,2001a). Lake systems are connected to the coast by large, steep-sided V-shaped valleys that dissect the area, and streams flow continuously during the summer months (Hodgson et al.,2001a; Sabbe et al.,2004).
The Vestfold Hills consists of three large peninsulas and contains numerous aquatic environments, including fjords and hundreds of freshwater and saline lakes, ranging from brackish to hypersaline. During the last glacial maximum, the Antarctic ice sheet covered the Vestfold Hills. When the ice sheet retreated at the end of the last ice age, lakes originated from sea water isolated in basins due to isostatic uplift following deglaciation, or were formed in basins exposed during glacial retreat and filled by meltwater (Roberts & McMinn, 1996).
The Rauer Islands are coastal archipelago of ice-free islands situated in southeastern PB. The group includes 10 major islands, covers a total area of around 300 km2 and is separated from the Vestfold Hills by the Sørsdal Glacier. The Rauer Islands contain more than 50 lakes and small ephemeral ponds. The lakes have probably originated in a similar manner to those in the nearby Vestfold Hills (Hodgson et al.,2001b).
There is a wide range of lake salinities in these three regions. Most of the Larsemann Hills lakes are oligosaline and there are no hypersaline lakes (Sabbe et al.,2004). However, one exception is Lake Reid, characterised by a long evaporation history related to the fact that Broknes Peninsula remained ice-free during the last glacial maximum (Hodgson et al.,2001a). In contrast, amongst the hundreds of Vestfold Hills lakes, many are saline or hypersaline (less than 3‰ to more than 200‰ salinity) and some lakes are meromictic (Roberts & McMinn, 1996). Chemical and biological data indicate that the Rauer Islands form a distinct limnological province amongst the lakes of PB oases. Salinities range from hypo- to hyper-saline with a ionic order close to that of seawater (Hodgson et al.,2001b).
In the present paper, we aim to answer a number of questions. How complete is our knowledge of the cyanobacterial diversity from the Antarctic lakes? What is the geographic distribution of newly obtained sequences? Is the existence of Antarctic endemic species confirmed by the study of additional mat samples from different lakes? Does the integration of our sequences with available uncultured Antarctic sequences from GenBank allow us to distinguish a geographic trend in the distribution of cyanobacteria? How do the ecological features of the lakes influence the composition of cyanobacterial populations in microbial mats, and can we draw relationships between the cyanobacterial composition and the ecological characteristics of the lakes?
To answer these questions, we describe and compare the morphological and genotypic diversity of cyanobacteria of five microbial mat samples from four lakes. These lakes were selected to encompass some of the range of limnological diversity in different regions of Eastern Antarctica (Larsemann Hills, Vestfold Hills and Rauer Islands), from which very few cyanobacterial sequences are available, and none from lake mats. Furthermore, the studied regions are very distant (c. 2600 km) from the better investigated Southern Victoria Land and the McMurdo Ice Shelf. This study is the first report of the molecular diversity of cyanobacteria in microbial mats from these relatively inaccessible regions.
Material and methods
Sampling
During the Antarctic summers 1997/1998 and 1998/1999, benthic microbial mat samples were collected from four seasonally ice-covered lakes, Lake Reid, Heart Lake, Lake Rauer8 and Ace Lake, located in three different regions of the Eastern Antarctica. Lakes Reid, Heart and Rauer8 are mixed during the summer when the lake ice melts and the lakes are exposed to the strong easterly katabatic winds (Kaup & Burgess, 2003). Ace lake is a meromictic lake, permanently stratified, but the sample was collected from a depth within the upper oxygenated mixolimnion.
Lake Reid (76°23′E 69°23′S), in the Larsemann Hills, is a 5.5 ha, 3.8 m deep, and hyposaline (9.16 mS cm−1) lake of around 120 000 years old (Hodgson et al.,2006). Two benthic mat samples were collected. The first sample was collected from the middle of the lake (ReidJ) in 1998/1999, using a Jenkin coring device through a hole cut in the ice, which give a 50 cm long undisturbed core. The surface mat was removed for examination. The second sample was taken from the shallow littoral moat (ReidD) in 1997/1998 and consisted of the uppermost layer of the mat (c. 1 cm). Heart Lake (76°23′E 69°23′S), also located in the Larsemann Hills region, is a 5 ha, 4.5 m deep and oligosaline (1.62 mS cm−1) lake of around 10 300 14C years old (Verleyen et al.,2004). A sediment core was collected through a hole cut in the ice from the deepest part of the lake in 1997/1998 in a clear Perspex liner and the top 0.5 cm was extruded and retained for analysis. Ace Lake (78°11′E 68°25′S) in the Vestfold Hills is a 13.2 ha, 25 m deep and hyposaline lake with a mixolimnion conductivity between 25.4 and 26.4 mS cm−1 and that is around 13 000 14C years old. The mat sample was collected in 1998/1999 using a scraping device through a hole drilled in the ice at a depth of 2 m. Lake Rauer8 (68°55′S and 77°55′E) is located on an Shcherbinina Island. It is a c. 1 ha, shallow (1 m deep), hyposaline (6.26 mS cm−1) lake, which probably originated in a similar manner to lakes in the nearby Vestfold Hills (Hodgson et al.,2001b) but its age is not known. The mat sample was collected from the littoral part of the lake in 1997/1998 and consisted of the uppermost layer of the mat (c. 1 cm).
Mat samples ReidD, Heart and Rauer8 were frozen in the field and sent frozen (−25°C) to the University of Liège via the British Antarctic Survey. The samples ReidJ and Ace were kept and sent refrigerated (2–3°C) to the University of Liège via the University of Nottingham.
Morphological characterization
A few cm3 of mat sample were fixed in formaldehyde 4% for microscopic observations. At least 10 preparations of 25 mm2 were observed.
The major cyanobacterial taxa were observed with a Wild MS-20 microscope equipped with a screw micrometer (Wilmotte, 1988). The diacritical morphological traits used for botanical species identification included cell shape for both intercalary and end cells, width and length of intercalary cells, presence or absence of constriction at the cross-wall, of necridic cells, of sheath, color of the sheath, number of trichomes per filament, presence or absence of heterocysts, and width and length of heterocysts. The taxonomic works of Geitler (1932), Anagnostidis & Komárek (1985, 1988), Komárek and Anagnostidis (1989, 1998), as well as descriptions from the Antarctic literature (e.g. Broady, 1982; Broady & Kibblewhite, 1991; McKnight et al.,1998), were used as reference texts. The detailled morphological descriptions of the species observed will be available elsewhere (A. Taton et al., manuscript in prep.).
DNA extraction and purification
For the five studied mats, 0.5 g of sample were used for the DNA extractions. For the Ace Lake sample, the methods used for the nucleic acid extraction and purification have previously been described (Taton et al.,2003). The DNA extractions of samples from Lake Reid, ReidD and ReidJ, followed the same method except that the glass beads had a diameter of 0.1 mm (BioSpec, Bartleville, OK) and the shaking for 60 s in a bead-beater was replaced by vigorous vortexing for 10 min. Furthermore, the crude DNA preparations were purified using the Wizard DNA Clean-up system (Promega, Madison, WI), following the manufacturer's instructions. The nucleic acid extraction of the Heart Lake sample was carried out with the Nucleospin Plant kit (Macherey Nagel, Düren, Germany) using the protocol optimized for soil samples given by the manufacturer. The nucleic acid extraction of Lake Rauer8 was performed with the UltraClean™ Soil DNA Isolation Kit (MoBio Laboratories, Inc., Carlsbad, CA), following the manufacturer's instructions. These two last methods also involved vigorous vortexing of the sample with beads. In addition, the crude DNA was purified using the Quiaex II agarose gel extraction protocol (Quiagen, Hilden, Germany).
Cloning and screening of the clone libraries
The PCR amplification of a cyanobacterial 16S rRNA gene plus the internal transcribed spacer (ITS), the cloning of the PCR products, the extraction of plasmid DNAs, the reamplification of the inserted 16S rRNA gene plus ITS and the screening by amplified ribosomal DNA restriction analysis (ARDRA) to analyse the clone libraries of the samples Ace, Rauer8, ReidD and ReidJ have been reported elsewhere (Taton et al.,2003). For each ARDRA type, partial 16S rRNA gene sequences (at least 400 bp long) were determined for at least one clone using the sequencing primers 16S378F and/or 16S784R (Nübel et al.,1997; Taton et al.,2003). For the Heart Lake clone library, a partial 16S rRNA gene sequence (c. 700 bp) using the sequencing primers 16S1092R (5′-GCG CTC GTT GCG GGA CTT-3′) was determined for all clones without preselection by ARDRA. Complete 16S rRNA gene sequences (Escherichia coli positions 27–1542) were determined on one DNA strand for at least one representative clone selected at random from each group of clones with partial 16S rRNA gene sequences that were more than 97.5% similar (Stackebrandt & Goebel, 1994; Taton et al.,2003). In addition, the complete ITS sequences were determined for the clones with complete 16S rRNA gene sequences, as well as for closely related clones. The sequencing was carried out with the primers used by Taton. (2003) as well as with the sequencing primers 16S533F (5′-CCG TGC CAG CAG CCG CGG TAA-3′) (Wilmotte et al.,2002), 16S1092R, 16S1114F (5′-GTC CCG CAA CGA GCG CAA CCC-3′), 16S1514F (5′-GTC GTA ACA AGG TAG CCG TAC-3′) (derived from Wilmotte et al.,2002) and/or Ile23F (5′-ATT AGC TCA GGT GGT TAG-3′) (Wilmotte et al.,1993). Sequencing was carried out by GenomeExpress (Paris, France) with an ABI PRISM system 377 (PE Applied Biosystems, Foster City, CA).
Analysis of sequence data
The 16S rRNA gene sequences were initially analyzed by similarity search using the BLAST software widely available on the Internet (29th June 2005). Chimera detection was performed using ‘Check Chimera’ (Maidak et al.,2001) and ‘Bellerophon’ (Huber et al.,2004). The new sequences were included in the database of the ARB software package (Ludwig et al.,2004) and aligned with the cyanobacterial sequences available from GenBank. To confirm the results obtained with ‘Check Chimera’ and ‘Bellerophon’, the putative fragments of chimeras were then integrated separately into a tree composed of almost complete sequences according to the maximum parsimony criterion while maintaining its original topology.
The sequences were grouped in operational taxonomic units (OTUs; groups of sequences that exhibit more than 97.5% similarity with each other, using the E. coli positions 405–780, not taking into account indels and ambiguous bases) with the software DOTUR using the average neighbor method (Schloss & Handelsman, 2005). The clones that exhibited the highest median percentage of similarity with the other clones of their OTUs and within the sample, from which they originated, were selected as representatives.
Phylogenic trees were constructed using the maximum likelihood of fastDNAml (Felsenstein, 1981; Olsen et al.,1994) implemented in ARB (Ludwig et al.,2004), the Wagner parsimony and the neighbor-joining (Saitou & Nei, 1987) on the Jukes and Cantor distances matrix (Jukes & Cantor, 1969) of PHYLIP 3.63 (Felsenstein, 1989). Bootstrap analyses involving the construction of 500 resampled trees were performed for the parsimony and neighbor-joining methods. Aligned partial 16S rRNA gene sequences corresponding to E. coli sequence positions 405–780 were used, but the indels and ambiguous bases were not taken into account. The tree comprises one representative sequence per OTU for each clone library and the nearest neighbor indicated by BLAST. If the hit was from uncultured clones, the closest cultured strain indicated by BLAST was added. Furthermore, we included at least one sequence for each cluster defined by Wilmotte & Herdman (2001). Antarctic sequences available in the databases that exhibited more than 97.5% similarity with the new sequences were included in the tree. If they were strain sequences, all of them were included, whereas if they were sequences of uncultured organisms only one per OTU and per sample was included.
The ITS sequences were analyzed by similarity search using the BLAST software and then aligned on the basis of conserved domains (Iteman et al.,2000) and tRNAs. The ITS alignments are available as supplementary material. The related sequences found in GenBank for which a meaningful alignment could be performed were included.
Nucleotide sequence accession numbers
Complete, partial 16S rRNA gene and ITS sequences were deposited to GenBank under the following accession numbers: DQ181668–DQ181693, DQ181694–DQ181746 and DQ181747–DQ181790,respectively.
Results
Microscopic diversity
Seventeen morphospecies belonging to 12 genera were distinguished (Table 1, Figs 1a and b). Nine morphospecies belonged to the Oscillatoriales, three to the Nostocales and five to the Chroococcales. Most of them were assigned to species previously observed in various Antarctic biotopes (e.g. Prescott, 1979; Broady & Kibblewhite, 1991; Komárek, 1999). However, Aphanocapsa cf. holastica, Aphanocapsa cf. hyalina and Arthronema sp. were recorded for the first time in Antarctica. Six species (Table 1) were considered as endemic to Antarctica by Komárek (1999) whereas the others have also been recorded outside Antarctica. Comparison of the cyanobacterial communities of the five samples (Table 1) showed that six species, were retrieved in all the studied samples, whereas Geitlerinema deflexum, Phormidium murrayi and Nodularia cf. harveyana were only found in Ace, Cyanosarcina sp. and Arthronema sp. in ReidJ and Chlorogloea sp., Aphanothece sp. and Pseudophormidium/Schizothrix sp. in Heart. Only three taxa, Oscillatoria subproboscidea, Phormidium pseudopriesteyi and Calothrix sp., were present in at least two samples, but not in all of them.
Morphospecies distinguished in the studied samples
| Classical designation | Heart | ReidD | ReidJ | Rauer8 | Ace | All samples | One sample | Endemic |
| Arthronema sp. | + | + | ||||||
| Geitlerinemadeflexum (West & West) Anagnostidis | + | + | + | |||||
| Leptolyngbyaantarctica (West & West) Anagnostidis & Komárek. | + | + | + | + | + | + | + | |
| Leptolyngbyafrigida (Fritsch) Anagnostidis & Komárek | + | + | + | + | + | + | + | |
| Phormidiummurrayi (West & West) Anagnostidis & Komárek. | + | + | ||||||
| Phormidiumpriestleyi Fritsch | + | + | + | + | + | + | + | |
| Phormidiumpseudopriestleyi (West & West) Anagnostidis & Komárek. | + | + | + | |||||
| Oscillatoria subproboscidea West & West | + | + | + | |||||
| Schizothrix sp./Pseudophormidium sp. | + | + | ||||||
| Calothrix sp. | + | + | ||||||
| Nodulariaharveyana Thuret | + | + | ||||||
| Nostoc sp. | + | + | + | + | + | + | ||
| Aphanocapsa cf. holastica (Lemmermann) Cronberg & Komárek | + | + | + | + | + | + | ||
| Aphanocapsa cf. hyalina (Lyngbye) Hansgirg | + | + | + | + | + | + | ||
| Aphanothece sp. | + | + | ||||||
| Chlorogloea sp. | + | + | ||||||
| Cyanosarcina sp. | + | + | ||||||
| Number of morphospecies | 10 | 7 | 9 | 7 | 11 | 6 | 8 | 6 |


Diversity of cyanobacterial morphospecies identified in the studied mat samples. (a) A, Geitlerinema deflexum; B, Leptolyngbya antarctica; C, Leptolyngbya frigida; D, Phormidium priestleyi; E, Arthronema sp.; F, Schizothrix sp./Pseudophormidium sp.; G, Phormidium murrayi; H, Oscillatoria subproboscidea; I, Phormidium pseudopriestleyi. Bar, 10 μm. (b) A, Nostoc sp.; B, Nodularia harveyana; C, Calothrix sp.; D, Aphanocapsa cf. holastica; E, Aphanocapsa cf. hyalina; F, Chlorogoea sp.; G, Cyanosarcina sp.; H, Aphanothece sp. Bar, 10 μm.
Molecular diversity – 16S rRNA gene analysis
In total, 285 clones with an insert of the correct size were obtained, 62 clones belonging to 28 different ARDRA patterns for the ReidD sample, 61 clones belonging to 36 patterns for the ReidJ sample, 57 clones belonging to 15 patterns for the Ace sample, 48 clones belonging to 20 patterns for the Rauer8 sample and 57 clones for the Heart sample.
To assign clones to taxonomic clusters, 156 partial 16S rRNA gene sequences were determined for at least one representative of each ARDRA pattern and for all the clones of the Heart sample. After the exclusion of chimeras, bacterial sequences and sequences of bad quality, 128 partial cyanobacterial sequences were obtained and grouped in OTUs. One or two complete 16S rRNA gene sequences were determined for each OTU. Eight complete sequences were detected as chimeras with a breakpoint after the E. coli position 780. Only the fragments that comprised the sequence between the E. coli positions 405–780 were subsequently used. In total, 27 complete 16S rRNA gene sequences were obtained for 24 OTUs.
The level of discrimination of the ARDRA with the restriction enzymes MboI and HpaII has been previously shown to be adequate (Taton et al.,2003) and this was confirmed in this study. Indeed, for 20 clones from nine ARDRA patterns, the 16S rRNA gene sequences (E. coli positions 405–780) of clones with identical ARDRA patterns showed 99.9% similarity, on average. Hence, in the rest of our analysis we considered that clones with identical ARDRA patterns had virtually identical DNA partial sequences.
The 128 sequences obtained for the five clone libraries corresponded to 28 OTUs (Tables 2 and 3), using a threshold of 97.5% similarity (E. coli positions 405–780). Eight OTUs were retrieved in Heart, eight in ReidD, 12 in ReidJ, four in Rauer8 and five in Ace samples. The accumulation curves based on the number of clones per OTU showed hyperbolic tendencies towards saturation curves. In addition, the coverage index indicated that 91.5% of the total diversity in ReidJ clone library and at least 95% in the Ace, Heart, Rauer8 and ReidD clone libraries was detected (Table 3). The Shannon–Wiener and the Berger–Parker indexes (Table 3) showed that the genotypic diversity was from one and a half to twice as high in the ReidD, ReidJ and Heart clone libraries compared to the Ace and Rauer8 clone libraries that were dominated by a smaller subset of OTUs. Indeed, 16ST19 contributed 71.4% of the cyanobacterial clones in the Ace clone library while 16ST23 and 16ST25 contributed 37.5 and 57.5%, respectively, in the Rauer8 clone library. Out of the 28 OTUs retrieved, 20 OTUs were unique to the library from which they originated (five in ReidD, five in ReidJ, four in Ace, three in Heart and three in Rauer8). Eight OTUs were found in at least two samples, 16ST05Ant was found in three libraries and none were found in more than three libraries (Table 2). Both samples of Lake Reid shared three OTUs out of 17 in total. When both samples of Lake Reid were combined, Lake Reid and Heart Lake shared five OTUs out of 20 in total. The Heart, ReidD and ReidJ libraries did not share any OTUs with those of Ace and Rauer8. On the other hand, Ace Lake and Lake Rauer8 shared the OTU 16ST23.
Operational taxonomic units (OTUs) and corresponding internal transcribed spacer (ITS) types distinguished in the clone libraries
The clones for which the ITS sequence was determined are in boldface type.
†The number of clones also included the clones assigned to the corresponding OTU on the basis of their ARDRA pattern.
Levels of similarity were determined by the computation of similarity matrixes, the E. coli positions 405–780 were used, indels and ambiguous bases were not taken into account.
Summary of the 16S rRNA gene data obtained from the clone libraries
The coverage index (C) (Good, 1953) was calculated as follows: C=(1−n/N) × 100, where n is the number of OTUs composed of a single clone and N is the total number of clones.
The Shannon–Wiener index (H) (Margalef, 1958) was calculated as follows: H=−Σpi× log2pi, where pi is the proportion of clones within the sample belonging to the ith OTU.
The Berger–Parker index (d) (May, 1975) was calculated as follows: d=N/Nmax, where N is the total number of clones and Nmax is the number of clones belonging to the dominant OTU.
The new sequences exhibited levels of 16S rRNA gene similarities (E. coli positions 405–780) with their closest relatives currently deposited in GenBank, ranging from 89.5% to 100% (Table 2). Sixteen OTUs were exclusively composed of Antarctic sequences, of which 11 OTUs did not comprise GenBank sequences and were therefore considered as novel. The remaining 12 OTUs also included non-Antarctic sequences, of which 16ST08 was retrieved for the first time in Antarctica.
A phylogenetic analysis including representative sequences determined in this study and other reference sequences (cf. Material and methods) is presented in Fig. 2. We have distinguished the Antarctic OTUs, including the novel ones, from the others.
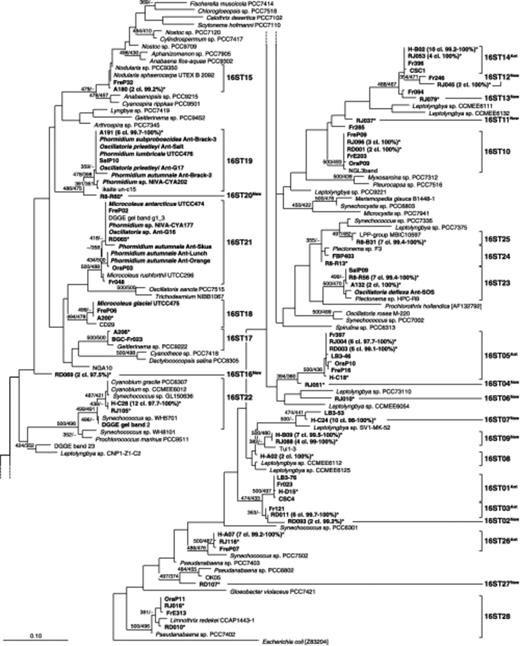
Phylogenetic tree inferred from 16S rRNA gene sequences (Escherichia coli positions 405–780) by maximum likelihood (likelihood=−8693.4402). Bootstrap values obtained using the neighbor-joining and the parsimony methods for the tree construction are indicated at the nodes when equal to or greater than 70%. The tree includes the 37 representative clone sequences out of 128 determined in the present study (boldface type, marked with an ‘*’), 111 previously published sequences (Antarctic sequences are in boldface type), and the E. coli sequence used as an out-group. The number of clone sequences belonging to the concerned operational taxonomic unit/lake, as well as the percentage of similarity between them, were indicated close to the representative sequence and between brackets. The evolutionary distance between two sequences is obtained by adding the lengths of the horizontal branches connecting them and using the scale bar (0.1 mutation per position).
The 16 Antarctic OTUs were exclusively composed of environmental sequences. Five of them were previously found in Antarctica and, interestingly, in the Southern Victoria Land/McMurdo Ice Shelf (SVL/MIS) region, which is very distant from the studied area. Furthermore, three OTUs were previously found in different biotopes such as cryoconite holes or liquid occlusion with trapped sediments in lake ice. 16ST05Ant comprised six ReidJ, six ReidD and one Heart sequences, sequences from the ice cover of Lake Boney (SVL) and from microbial mats of Lake Fryxell (SVL), as well as of Fresh and Orange Ponds (MIS) (Priscu et al.,1998; Taton et al.,2003; Jungblut et al.,2005). The sequences within this OTU shared at least 97.7% similarity. This OTU included 39 and 28% of the clones obtained from the ReidD and ReidJ samples, respectively. 16ST14Ant with four ReidJ and 10 Heart sequences was previously found in mats from Lake Fryxell and cryoconite holes (SVL; Christner et al.,2003; Taton et al.,2003). The minimal binary similarity was 99.5%. Furthermore, it included 17% and 20% of the clones obtained from the ReidJ sample and Heart Lake, respectively. 16ST01Ant comprised one sequence from Heart Lake closely related (98.9–99.7% similarity) to environmental sequences isolated from diverse habitats: cryoconite holes, the ice cover of Lake Boney and mats in Lake Fryxell (Priscu et al.,1998; Christner et al.,2003; Taton et al.,2003). 16ST03Ant comprised six ReidD sequences 99.4-99.7% similar to Fr121 from mats in Lake Fryxell (Taton et al.,2003). This OTU corresponded to 39% of the clones obtained from the ReidD sample. 16ST26Ant comprised seven sequences from Heart Lake and one ReidJ sequence which were 99.2–99.7% similar to FreP07 isolated from mats from Fresh Pond (Jungblut et al.,2005).
The other 11 Antarctic OTUs were considered as novel (16ST02New, 16ST04New and 16ST06New, 16ST07New, 16ST09New, 16ST11New, 16ST12New, 16ST13New, 16ST16New, 16ST20New, 16ST27New) and were only present in one lake, except for 16ST09New, which comprised ReidJ and Heart sequences.
The 12 remaining OTUs were previously found outside Antarctica. In Antarctica, most of them (10 OTUs) were obtained from the SVL/MIS region. Mostly affiliated to the Oscillatoriales order (nine OTUs), they comprised sequences from very diverse and often extreme biotopes (desert crusts, cryptoendolithic communities, hot springs). 16ST15 comprised two sequences from Ace Lake closely related (99.4–99.7%) to FreP32 isolated from Fresh Pond (Jungblut et al.,2005) and other sequences of the genus Nodularia. 16ST21 comprised one ReidD sequence, 98–100% similar to Phormidium sp. NIVA-CYA177 isolated from Dronning Maud Land (Antarctica) (Rudi et al.,1997) as well as to other Antarctic sequences from different ponds and lakes of MIS and SVL including P. autumnale, Microcoleus antarcticus and Oscillatoria sp. (Nadeau et al.,2001; Taton et al.,2003; Casamatta et al.,2005; Jungblut et al.,2005). 16ST18 was composed of one sequence of Ace Lake, which was identical to M. glaciei UTCC475 and FreP06 isolated from a pond on MIS (Casamatta et al.,2005; Jungblut et al.,2005) and more than 97.5% similar to Arctic sequences (not shown in the tree) and nonpolar sequences [e.g. CD29 from soil crusts from the Colorado Plateau (Canyonlands) (Yeager et al.,2004)]. 16ST17 included one sequence of Ace Lake, which exhibited 99.7% similarity with the clone BGC-Fr023 isolated from one cultured mat of Lake Fryxell (Taton et al.,2003) and more than 97.5% with nonpolar sequences of the genus Geitlerinema. 16ST22 contained four ReidJ and 12 Heart sequences as well as sequences of the genera Synechococcus and Cyanobium from very diverse habitats (e.g. plankton, cryptoendolithic communities, etc). Furthermore, most sequences of this OTU exhibited more than 97.5% (96.6–100%) similarity with the uncultured Antarctic cyanobacterium denaturing gradient gel electrophoresis (DGGE) gel band 2, isolated from Holocene sediments of Ace Lake (Vestfold Hills, Antarctica) (M.J.L. Coolen, F. Gassner, R. Damen, G. Muyzer, S. Schouten and J.S. Sinninghe Damste, unpublished data). This OTU included 24% of the clones obtained from Heart Lake. 16ST10 comprised five identical sequences from the ReidD and ReidJ samples that were at least 99.4% similar to sequences from mats of Lake Fryxell as well as of Fresh Pond and Orange Pond (Taton et al.,2003; Jungblut et al.,2005). In addition, these sequences were 99.7% similar to the NGL3band isolated from a cryptoendolithic community within travertine in Yellowstone National Park (U.S.A.) (T.B. Norris and R.W. Castenholz, unpublished data). 16ST08, with two sequences from Heart Lake related (98.3% similarity) to Leptolyngbya sp. CCMME6112 isolated from a cryptoendolithic community within travertine in Yellowstone National Park (T.B. Norris and R.W. Castenholz, unpublished data). 16ST28, that comprised one sequence of both samples of Lake Reid, exhibited 98–100% similarity with sequences from mats of Lake Fryxell and Orange Pond (Taton et al.,2003; Jungblut et al.,2005).
Interestingly, inside four OTUs, the sequences from the saline lakes Ace and/or Rauer8 mainly clustered with sequences from saline environments. 16ST19 contained six sequences of Ace Lake closely related (98.3–100% similarity) to O. subproboscidea, O. priestleyi, P. autumnale, P. lumbricale and uncultured clones from saline ponds (Brack: 11.60 mS cm−1; Salt: 67.2 mS cm−1; G17: 31 mS cm−1) on MIS (Nadeau et al.,2001; Casamatta et al.,2005; Jungblut et al.,2005). Furthermore, the sequences of this OTU were more than 97.5% similar to Arctic (Rudi et al.,1997; Stougaard et al.,2002) and nonpolar sequences [e.g. Phormidium cf. terebriformis KR2003/25 isolated from an alkaline and saline hot spring close to Lake Bogoria (Ballot et al.,2004) – not shown in the tree]. 16ST25 was composed of seven sequences of Lake Rauer8, 99.1–99.4% similar to LPP-group MBIC10597 (S. Suda, M. Atsumi, H. Miyashita, M. Kawachi, D. Honda, K. Watanabe, N. Kurano, S. Miyachi and S. Harayama, unpublished data) from marine sediments and 98.8–99.2% similar to sequences from sublithic communities of quartz stones from the Vestfold Hills (Antarctica) (Smith et al.,2000) (not shown in the tree – only 262 positions). This OTU included 57.5% of the clones obtained from Lake Rauer8. 16ST24 was composed of one sequence from Lake Rauer8, which exhibited 98.9% with the Antarctic clone FBP403, isolated from a cryptoendolithic community (SVL) (De la Torre et al.,2003). Furthermore, the nonpolar sequences belonging to this OTU were isolated from marine environments [e.g. Plectonema sp. F3 (Turner, 1997)]. 16ST23 comprised seven sequences isolated from Lake Rauer8 and two from Ace Lake, which were 98.3–100% similar to Antarctic sequences (Oscillatoria deflexa Ant-SOS and SalP09) isolated from saline ponds (SOS: 113.5 mS cm−1, Salt: 67.2 mS cm−1) on MIS (Nadeau et al.,2001; Jungblut et al.,2005) and 98.3–98.6% similar to Plectonema sp. HPC-49 from stromatolites in the hypersaline marine environment of Shark Bay, Australia (Burns et al.,2004). Furthermore, this OTU was also found in soil crusts from the Colorado Plateau, and cryptoendolithic communities within travertine in Yellowstone National Park (not shown in the tree). This OTU included 37.5% of the clones obtained from the Rauer8 sample.
Molecular diversity – ITS analysis
Fifty ITS sequences have been determined as a more variable marker to complement the information obtained from the 16S rRNA gene. ITS are so variable that only sequences from closely related organisms can be meaningfully aligned (Wilmotte, 1994). Twenty-five groups of ITS sequences were aligned on the basis of conserved domains (Iteman et al.,2000) and tRNAs and were defined as ITS-type (Tables 2, 4 and supplementary material).
Internal transcribed spacer (ITS) types distinguished in the clone libraries
| Number of clones | ||||||||
| ITS-type | Sequenced Clone | Heart | ReidD | ReidJ | Rauer8 | Ace | Tot | |
| ITS01 | RD093, RD009, RD106, RJ037, RJ105 | 3 | 2 | 5 | Uncultured cyanobacterium clone Fr397 (96.0–98.1%) | |||
| ITS02 | RJ051, RJ102, RJ045, RD065 | 1 | 3 | 4 | ||||
| ITS03 | H-C18, H-A07 | 2 | 2 | |||||
| ITS04 | RJ116 | 1 | 1 | |||||
| ITS05 | RD001, RJ003, RJ077, RJ096, RJ019, RJ016 | 1 | 5 | 6 | Uncultured cyanobacterium clone Fr132 (99.4–100%) | |||
| ITS06 | A042, A110, A188, A191 | 4 | 4 | |||||
| ITS07 | A180 | 1 | 1 | |||||
| ITS08 | RD069 | 1 | 1 | Uncultured cyanobacterium clone Fr147 (98.1%) | ||||
| ITS09 | RJ053, RJ094, RJ070 | 3 | 3 | Uncultured cyanobacterium clone Fr048 (99.3–99.6%) | ||||
| ITS10 | RD008, RD003, RD046 | 3 | 3 | Uncultured cyanobacterium clone Fr121 (99.3–99.6%) | ||||
| ITS11 | RD017 | 1 | 1 | |||||
| ITS12 | RJ034, RJ050, RJ088 | 3 | 3 | |||||
| ITS13 | H-A02 | 1 | 1 | |||||
| ITS14 | H-B02 | 1 | 1 | |||||
| ITS15 | H-B07 | 1 | 1 | |||||
| ITS16 | RJ010 | 1 | 1 | |||||
| ITS17 | R8-R60, R8-R56, R8-B31, A132 | 3 | 1 | 4 | ||||
| ITS18 | R8-R79 | 1 | 1 | |||||
| ITS19 | H-D15 | 1 | 1 | |||||
| ITS20 | RD011 | 1 | 1 | |||||
| ITS21 | RD010 | 1 | 1 | |||||
| ITS22 | RD107 | 1 | 1 | |||||
| ITS23 | A206 | 1 | 1 | Uncultured cyanobacterium clone BGC-Fr067 (100.0%) | ||||
| ITS24 | H-C02 | 1 | 1 | |||||
| ITS25 | R8-R13 | 1 | 1 | |||||
Levels of similarity were determined by BLAST, only the sequences that could be meaningfully aligned with the query were listed.
ITS sequences belonging to same ITS-types shared between 96.3 and 100% similarity (99.5% in average). Both tRNA genes were found in the ITS-types ITS01–ITS04 and ITS09–ITS24, whereas ITS08 and ITS25 had only the tRNAIle and the tRNAAla gene, respectively. The ITS-types ITS05–ITS07 did not have any tRNA gene.
For 12 OTUs, the ITS sequences of several clones were determined to assess the ITS homogeneity within an OTU. Nine of these OTUs comprised a number of clones with different ITS types, while only a single ITS type was found for the others (Table 2).
Unexpectedly, eight ITS-types corresponded to clones that belonged to different OTUs. This should be the consequence of chimeras within or at the 3′ end of the 16S rRNA gene. Such chimera were observed for eight out of the 22 concerned clones, for which the complete 16S rRNA gene sequence was determined.
Out of the 25 ITS-types retrieved, 21 ITS-types were unique to the sample from which the clones were isolated. The other four ITS-types were found in two clone libraries. Three ITS-types (ITS01, ITS02 and ITS05) out of 13 were common to both Lake Reid samples. However, no ITS-types were common to Heart and Reid samples. Furthermore, Ace and Rauer8 samples shared one ITS-type (ITS17) out of six for both libraries (Table 4).
Interestingly, the comparison of the ITS sequences determined in this study with those available in GenBank showed that six ITS-types were previously found in microbial mats of Lake Fryxell (Taton et al.,2003).
Discussion
In this study, morphological and molecular characterizations of the cyanobacterial diversity in one sample from the microbial mats of four Antarctic lakes (five samples) were compared.
How complete is our knowledge of the cyanobacterial diversity from the Antarctic lakes?
Based on microscopic features, 17 morphospecies were distinguished. Most of them have previously been found in several Antarctic biotopes and regions (Prescott, 1979; Broady & Kibblewhite, 1991; Komárek, 1999), and 35% (6/17) would be endemic to Antarctica according to Komárek (1999). Using the molecular tools, a higher number of OTUs (28) than morphospecies (17) was detected. Each OTU might correspond to more than one species, following the bacteriological standards, but is surely distinct from other 16S rRNA gene types at the specific level (Stackebrandt & Goebel, 1994). In addition, some microdiversity, commonly found in molecular ecology studies (Furhman & Campbell, 1998), was observed. If such microheterogeneities were a real feature of the 16S rRNA gene that could be explained, for example, by the presence of different ecotypes (Moore et al.,1998), these divergences would increase the genotypic diversity. Indeed, the 28 OTUs included a total of 69 nonidentical sequences for the five cyanobacterial mat samples.
What is the geographic distribution of newly obtained sequences? Is the existence of Antarctic endemic species confirmed by the study of additional mat samples from different lakes?
If we considered the biogeographical distribution of the cyanobacteria found in the frame of this study, morphological results suggest that many cyanobacteria are widespread over the Antarctic continent. Indeed, on the basis of classical identifications, most cyanobacteria were previously recorded in distant regions (e.g. Prescott, 1979; Broady & Kibblewhite, 1991; Komárek, 1999).
The molecular approach also brought a different response, concerning the potentially novel or endemic taxa. Indeed, it suggests that potential Antarctic endemic species (57.1%) including a previously undiscovered diversity (39.3%) are more abundant than has been estimated on the basis of morphological features (35%). This has already been pointed out, but must be considered with care because of the incompleteness of the 16S rRNA gene sequence databases (Taton et al.,2003). On the basis of molecular results, 50% of the OTUs determined in this study were retrieved in the SVL/MIS and/or the Dronning Maud Land (Rudi et al.,1997; Priscu et al.,1998; Nadeau et al.,2001; Christner et al.,2003; De la Torre et al.,2003; Taton et al.,2003; Casamatta et al.,2005), which are very distant from the studied area.
Does the integration of our sequences with available uncultured Antarctic sequences from Genbank allow to distinguish a geographic trend in the distribution of cyanobacteria?
To complete our analysis, all the sequences of uncultured Antarctic cyanobacteria available in the databases and the sequences determined in this study were collected and grouped in OTUs. Fifty-three OTUs were obtained, of which 67.9% (36/53) have not been recorded for non-Antarctic sites (or at least were not present amongst the c. 4300 cyanobacterial sequences now present in the databases). This suggests a high degree of endemism. Of the potential endemic Antarctic OTUs, only five OTUs (13.9%) were recorded in both SVL/MIS region and PB region, whereas nine (52.9%) OTUs also found outside Antarctica were retrieved in both regions. This would fit with the idea that the OTUs found inside and outside Antarctica should be well adapted to transportation and dissemination, and thus were quite successful in spreading to new Antarctic habitats in different regions following Holocene deglaciation and isostatic uplift.
Noteworthy is that in each sample studied, in the frame of this study as well as in other Antarctic studies, several OTUs recorded were found for the first time in Antarctica (3.7 new OTUs on average, based on the five samples in this study and five other samples studied in a comparable manner (Taton et al.,2003; Jungblut et al.,2005). Furthermore, all the genotypic data (uncultured cyanobacteria) came from samples from the SVL/MIS and PB regions, and therefore, other regions should be studied to have a more complete view of the biogeographical distribution of OTUs. These results show that the bulk of the cyanobacterial genomic diversity in Antarctic lakes still remains to be discovered, and that it would be very interesting to test the hypothesis of endemism by studying similar mats along geographical gradients (maritime Antarctica, sub-Antarctic islands, South Hemisphere continents), as well as at high altitude and in Arctic lakes.
How do the ecological features of the lakes influence the composition of cyanobacterial populations in microbial mats, and can we draw relationships between the cyanobacterial composition and the ecological characteristics of the lakes?
On the basis of the morphological approach, comparison of the communities observed in this study with these of other biotopes (e.g. Prescott, 1979; Broady & Kibblewhite, 1991; Komárek, 1999) suggests the ubiquity of most cyanobacteria recorded in the present study.
However, 47% of the morphospecies were found in only one sample and suggests that the cyanobacterial communities of these lakes are quite distinct. Furthermore, among the 47% of species found in only one sample, three species were observed in the Heart Lake sample only and three other species in the Ace Lake sample only, those lakes being, respectively, the least and the most saline of the lakes studied. In addition, Nodularia cf. harveyana, considered as a halophilic species (Komárek, 1999), was only observed in the saline and meromictic Ace Lake.
Similarly, the molecular approach showed quite distinct communities for the four lakes, with 71.4% (20/28) of the OTUs found in only one sample and none in more than three samples. However, the molecular approach can introduce bias in the diversity obtained and certain OTUs could be not detected though present in the original environment. Speksnijder. (2001) and von Wintzingerode. (1997) have listed the possible artefacts due to DNA extraction, PCR and cloning.
The Ace and Rauer8 samples contained the most distinct communities, with one OTU shared by both samples and none with the others. Rauer8 had a lower salinity than Ace Lake at the time of sampling, but it is surrounded by quite saline lakes and is probably subjected to large variations in salinity, as that should freeze to the bottom in winter. Interestingly, four OTUs present in Rauer8 and Ace lakes contained mostly sequences from saline environments, and this suggests that they could be halotolerant taxa. Nevertheless, other OTUs in these lakes also contained sequences from freshwater and terrestrial biotopes (e.g. Miller & Castenholz, 2001; Taton et al.,2003; Yeager et al.,2004). We also observed a lower molecular diversity of these two lakes compared to the others. This was already observed by Jungblut. (2005), who hypothesized that the lower biodiversity in saline mats of MIS might be due to the lower total area of hypersaline ponds compared to the other aquatic systems of low or medium conductivities, in addition to the additional osmotic stresses that must be handled by the cyanobacteria. Since many of the lakes in the Vestfold Hills and the Rauer Islands are saline (Roberts & McMinn, 1996; Hodgson et al.,2001b), the first explanation should not play an important role in these regions.
Interestingly, the Heart and ReidJ samples shared four OTUs not found in any other studied samples and both samples were collected at a depth of around 4 m. Therefore, depth and consequently the light intensity could be influencing factors in the cyanobacterial community composition, as has been shown in studies of the relationships between cyanobacterial morphotypes and environmental parameters in these lakes (Hodgson et al.,2004; Sabbe et al.,2004). Other factors can be linked to the depth, such as the temperature stability and exposure to freezing. In agreement, only three OTUs were common to both samples of Lake Reid sampled at different depths (littoral part for ReidD and deepest part for ReidJ).
Finally, a comparison with the database sequences showed that 60.7% (17/28) of the OTUs obtained in this study have been previously observed in comparable and/or different biotopes, inside and/or outside Antarctica.
The presence of several OTUs in distinct Antarctic biotopes (microbial mats, lake ice, cryoconite holes, cryptoendolithic communities) hints at the existence of a constant traffic between terrestrial, aquatic and ice biotopes, in agreement with Gordon. (2000). These authors demonstrated, using oligonucleotide probes, that the lake ice microbial community was dominated by organisms that originated elsewhere, from other biotopes in the surrounding region. This also illustrates the incredible ability of these Antarctic cyanobacteria to survive under highly stressful conditions, alternating between dim light environments and high ultraviolet radiation, aquatic systems and desiccation, and to accommodate large variations in temperature and salinity. This is confirmed by the existence of several nonpolar OTUs with sequences from very diverse and often extreme biotopes (desert crusts, cryptoendolithic communities, hot springs).
Nevertheless, although this supports the idea that several cyanobacteria are able to occupy a wide range of ecological niches and to withstand considerable ecological changes, the lack of ecological similarity among nearly identical 16S rRNA gene sequences also raises the questions of whether this molecule is too conserved and whether other loci (such as ITS, see below) could distinguish ecotypes.
Boon of the ITS
The ITS is a variable marker, which has been used successfully in several studies to distinguish cyanobacterial strains at the intra- or interspecic level (Scheldeman et al.,1999; Baurain et al.,2002; Boyer et al.,2002; Ernst et al.,2003), and adapted to DGGE (Janse et al.,2003).
The ARDRA technique using the 16S rRNA gene plus the ITS was adequate to screen our clone libraries as shown in the Material and methods section and Taton. (2003). In addition, ITS sequences revealed finer-scale variations in the genotypic community composition. Indeed, different ITS types were retrieved from clones belonging to the same OTU, even with identical 16S rRNA sequences, within the same and/or different lakes. This could therefore be explained by the existence of different ecotypes closely related at the 16S rRNA gene level. However, it is not clear if these clones corresponded to distinct organisms because of the existence of multiple rRNA operons with ITS which may differ in a single organism (Boyer et al.,2002). Known strains, related to our clones, would be useful to determine the sequences of the different rRNA operons (eventually by cloning) and determine their heterogeneity.
The total number of OTUs and ITS-types were quite similar. In addition, the number of ITS-types and OTUs within the different samples varied in parallel, except for samples ReidD and ReidJ for which the tendencies were inverted. Such results, in combination with inherent ITS properties, encourage the use of the ITS for the analysis of environmental samples. An advantage of the ITS would be that the ITS yields a more clear-cut distinction between clones than the 16S rRNA gene. In this study, a comparison of the results obtained from the 16S rRNA gene with those obtained from the ITS, concerning the distribution of OTUs or ITS-types among the studied samples, is difficult because of the existence of chimeras and the different criteria for the selection of sequences to determine (cf. Material and methods). However, we would find it interesting to invert our methodological approach and first screen the clone libraries by determining the ITS sequences and then sequence the 16S rRNA gene of representative clones for each of the ITS types.
Concluding remarks
Up until now, most studies on the diversity of Antarctic cyanobacteria have been based on a microscopic approach. It is evident that, alone, this is unsatisfactory for elucidating species biogeography and ecology. Indeed, molecular diversity is higher and therefore does not always coincide with the microscopical diversity at ecological and biogeographical levels. We are aware that the morphological and molecular approaches have their own weaknesses and biases. Both methods complement each other and should be combined to obtain the most complete inventory of diversity. Indeed, the molecular method yielded more accurate results concerning Oscillatoriales but failed to detect Nostocales and Chroococcales, which were less abundant but were observed by light microscopy.
Our samples come from a defined place in a probably heterogenous biotope. In view of the difficulty in obtaining replicate samples and of the time and effort needed for the analysis, our data gives a first image of a diversity that can only be larger when more fully studied. In response to the introductory questions, this study has brought new knowledge concerning the diversity, geographical distribution and ecological range of Antarctic cyanobacteria. The microbial mats' samples were quite diverse and the cyanobacterial diversity increased in relation to the number of samples studied. At the biogeographical level, there is an abundance of potential Antarctic endemics, which include an important, yet undiscovered, diversity and possibly a long history of isolation on the continent. Furthermore, we have observed that OTUs also found outside Antarctica, and therefore well adapted to transport and dissemination, were more widespread over the continent than potential endemics. From the ecological point of view, salinity and light intensity seem to play a role in the community composition. Moreover, although the cyanobacterial compositions of the studied samples were quite distinct, it appeared that several cyanobacterial OTUs might be ubiquitous and probably possess a remarkable range of tolerance to environmental conditions (e.g. temperature, desiccation, etc.) as they can be found in desert crusts and hot springs' travertine.
Finally, this study shows the usefulness of the analysis of additional samples and the use of other molecular markers such as the ITS, to better characterize the Antarctic cyanobacterial diversity.
Acknowledgements
This study was funded by the European Union Biotechnology Program through the MICROMAT project (BIO4-CT98-0040) and by the Belgian Science Policy with the project LAQUAN (EV/02/01). Annick Wilmotte is a research associate of the National Fund for Scientific Research (Belgium). Arnaud Taton had a fellowship from the Funds for Research Formation in Industry and Agriculture (Belgium). We thank Stefano Ventura (CNR-ISE, Italy) for providing an additional internal 16S rRNA primer gene sequences (16S1092R) as well as the organizers and participants of the MICROMAT DNA extraction Workshop (11th–14th October 1999) for the DNA extraction of the Ace Lake sample. We thank Kathy Welch (Byrd Polar Research Center, USA), Philippa Noon, Wendy Quayle (British Antarctic Survey, UK), Gareth Murtagh, Paul Dyer, Tracey Henshaw (University of Nottingham, UK) and Ingmar Janse (University of Groningen, NL) who collected the mat material, and the Dry Valleys Long Term Ecosystem Research Program (LTER) and the Australian Antarctic Division (AAD), under whose auspices the material was collected. We thank the anonymous reviewers for their useful comments.
References
