


Abstract
In the last 10 years, accelerated mineralization of Atrazine (2-chloro-ethylamino-6-isopropylamino-s-triazine) has been evidenced in agricultural soils repeatedly treated with this herbicide. Here, we report on the interaction between earthworms, considered as soil engineers, and the Atrazine-degrading community. The impact of earthworm macrofauna on Atrazine mineralization was assessed in representative soil microsites of earthworm activities (gut contents, casts, burrow linings). Soil with or without earthworms, namely the anecic species Lumbricus terrestris and the endogenic species Aporrectodea caliginosa, was either inoculated or not inoculated with Pseudomonas sp. ADP, an Atrazine-degrading strain, and was either treated or not treated with Atrazine. The structure of the bacterial community, the Atrazine-degrading activity and the abundance of atzA, B and C sequences in soil microsites were investigated. Atrazine mineralization was found to be reduced in representative soil microsites of earthworm activities. Earthworms significantly affected the structure of soil bacterial communities. They also reduced the size of the inoculated population of Pseudomonas sp. ADP, thereby contributing to the diminution of the Atrazine-degrading genetic potential in representative soil microsites of earthworm activities. This study illustrates the regulation produced by the earthworms on functional bacterial communities involved in the fate of organic pollutants in soils.
Introduction
Atrazine (2-chloro-ethylamino-6-isopropylamino-s-triazine) is one of the agricultural herbicides most widely used to control broad-leaved weeds infesting corn, sorghum and certain other crops. Atrazine is frequently detected in surface water and groundwater at concentrations exceeding the European Union standard of 0.1 μg L−1. Soils repeatedly treated with Atrazine often showed accelerated mineralization, indicating the adaptation and the development of soil microbial communities specifically able to degrade this herbicide (Barriuso & Houot, 1996; Houot et al.,2000). Phylogenetically diverse Atrazine-degrading bacteria have been isolated from different soils (Yanze-Kontchou & Gschwind, 1994; Struthers et al.,1998; Topp et al.,2000; Piutti et al.,2003). Bacterial strains possessing the atz catabolic pathway first degrade Atrazine by a hydrolytic dechlorination catalyzed by atzA (Souza et al.,1996). Two amidohydrolytic reactions, catalyzed by atzB (Boundy-Mills et al.,1997) and atzC (Sadowsky et al.,1998), then transform Atrazine to cyanuric acid. This metabolite is then completely degraded to CO2 and NH3 by an amidohydrolase coded by the atzD gene and two hydrolases coded by atzE and F (>Martinez et al.,2001). The atz genes have been located on pADP1 a large self-transmissible plasmid isolated and characterized from Pseudomonas sp. ADP (Souza et al.,1998).
Although soil microhabitats such as the rhizosphere have been shown to increase both Atrazine mineralization and the density of Atrazine-degrading communities (Piutti et al.,2002), the impact of inhabiting fauna on the survival and activity of Atrazine-degrading communities in soil is not known. Earthworms are commonly considered as efficient soil engineers (Jones et al.,1994) able to disturb both microbial compartments and soil physico-chemical properties because they: (1) bury and redistribute organic surface litter down the soil profile; (2) enhance the available C and N input from metabolic wastes such as urine, mucus and tissue; (3) ingest and intimately mix soil with organic matter during gut transit; and (4) affect soil structure through burrowing and casting activities (Lee, 1985; Edwards & Bohlen, 1996).
Earthworms affect the soil organic matter content and hence modify Atrazine behavior in soil by increasing its adsorption on earthworm soil microsites such as casts (ejected soil) or burrow linings rather than on bulk soil particles (Farenhorst et al.,2000; Binet et al., 2005). Earthworms also interact with soil bacterial and fungal communities by modifying their size, structure and activity (Binet et al.,1998; Tiunov & Scheu, 2000, 1999; Clapperton et al.,2001; Tiunov & Dobrovolskaya, 2002). A few studies have reported contradictory results concerning the impact produced by earthworms on Atrazine mineralization, which has been shown either to enhance (Meharg, 1996; Gevao et al.,2001) or reduce (Farenhorst et al.,2000; Binet et al., 2005) this process in soil. Soil microflora–macrofauna interactions and their impact on Atrazine biodegradation have received little attention.
The aim of this study was to gain further insight into the interaction existing between earthworms and the Atrazine-degrading bacterial communities and to assess the impact of the former on Atrazine-degrading activity in soil microcosms. Representative soil microsites of earthworm activities were sampled to examine the extent to which earthworm macrofauna affect Atrazine mineralization in a maize-cropped soil. Soil was either inoculated or not inoculated with Pseudomonas sp. ADP and was either treated or not treated with Atrazine, to determine the effects produced by earthworms on Atrazine-degrading activity. A mixture of two ecologically different types of worms, namely the anecic species Lumbricus terrestris and the endogenic species Aporrectodea caliginosa, commonly found in temperate cropped soils, was added to soil to simulate natural earthworm communities more realistically. The impact produced by earthworms on (1) the structure of the soil bacterial community, (2) the Atrazine-mineralizing activity and (3) the distribution and quantification of atzA, B and C sequences in the soil microsites was analyzed. The results showed that earthworms significantly modified the structure of soil bacterial communities, and reduced both Atrazine mineralization and Atrazine-degrading genetic potential in representative soil microsites of earthworm activities.
Materials and methods
Soil microcosm design
The soil was collected from the first 30 cm of a corn agroecosystem treated with Atrazine at the Institut National de la Recherche Agronomique (INRA) experimental site of Vezin-le-Coquet (Brittany, France). It is a silty-clay loam (sand 12%, silt 75%, clay 13%), slightly acid (pH 6.4), with a low content of organic matter (1.8%) and a gravimetric water content of 0.22 g g−1 dry soil. The fresh soil was stored for 4 days at 4°C until use.
Inoculum preparation and soil treatment
Pseudomonas sp. ADP was kept on mineral salt (MS) Atrazine solid media. The starter culture was grown from a single colony in 50 mL Erlenmeyer flasks containing 10 mL of MS medium supplemented with Atrazine (30 mg L−1 final concentration) on a rotary shaker (28°C, 150 r.p.m.) (Rousseaux et al.,2001). After confirming the identity of the 16S rRNA gene and the atz gene composition of the bacterial strain by PCR, 1 mL of starter culture was used to inoculate 400 mL of tryptone-yeast (TY) medium (bactotryptone 5 g L−1, yeast extract 3 g L−1, CaCl2 0.6 mM) in 1 L Erlenmeyer flasks. Microbial cultures were grown for 15 h on a rotary shaker (28°C, 150 r.p.m.). The bacterial cells were harvested by centrifugation at 3800 g for 10 min. The pellets were washed twice with a mineral salt buffer (K2HPO4, 1 g L−1; KH2PO4, 1 g L−1; MgSO4·7H2O, 40 mg L−1; FeCl3, 4 mg L−1; pH 6.6) and finally suspended in 500 mL of MS medium without Atrazine. Soil was inoculated with a bacterial cell suspension, made with the MS media used to culture the bacteria, at the theoretical density of 106 bacterial cells per gram of soil. The control treatment only received an equivalent volume of sterilized MS media.
Earthworm treatments
The two species Lumbricus terrestris (anecic) and Aporrectodea caliginosa (endogenic), commonly found in the corn agrosystem and dominant within the earthworm community, were collected at the site of Vezin-le-Coquet by formalin extraction (Binet & Bayon, 1999). The anecic earthworms (L. terrestris) are large worms feeding on soil surface litter that form deep vertical burrows into which organic fragments are incorporated. In contrast, the endogenic earthworms (A. caliginosa) are small- to medium-sized geophagous worms living and feeding within the soil profile on organic matter. The collected earthworms were transferred to the laboratory and kept in the experimental soil at 12°C before use. Three earthworms, one immature L. terrestris (Linné, 1758) of mean weight 1.44 g (±0.05) and two adult A. caliginosa (Savigny, 1826) each of mean weight 0.38 g (±0.01) were introduced into the soil microcosms. The average earthworm biomass per soil microcosm was 2.20 g (±0.04).
Atrazine treatment
A 25 mL quantity of an aqueous Atrazine solution containing 28 μg mL−1 of commercial pure Atrazine (Atrazine Pestanal, Riedel-de-Haën, Lyon, France) was sprayed uniformly on to the soil surface of each microcosm to simulate a field application rate of 1 kg ha−1. The control soil microcosms were sprayed with an equivalent volume of distilled water.
Microcosm setup
The experimental microcosms used in the experiment were as designed by Binet & Tréhen (1992). A 300 g soil sample was inoculated with Pseudomonas sp. ADP, mixed thoroughly with 1.2 kg of fresh soil and used to fill each column. The soil was then compacted to a bulk density of 1.46 g cm−3, resulting in a compacted soil column of diameter 10 cm and height 15 cm. The earthworms were placed on the soil surface. The faecal material deposited at the soil surface (surface casts) as they buried themselves was removed. Atrazine was applied to the soil surface 1 day after the earthworms had entered the soil. The soil was then moistened to 80% of its water holding capacity.
Experimental design
Four treatments were used in the experiment: control soil (S), soil treated with Atrazine (SA), soil inoculated with Pseudomonas sp. ADP (SP) and soil inoculated with Pseudomonas sp. ADP and treated with Atrazine (SPA). Earthworms were either added or not added to each of the four treatments and there were three replicates. All 24 soil microcosms were incubated at 12°C (the mean air temperature during spring and autumn in temperate regions) under a 12 : 12 photoperiod for 9 days.
At the end of the incubation period, representative soil microsites were collected from the microcosms with added earthworms. Control soil (Co) was taken from the top of the soil column (2–5 cm) in all the microcosms without earthworms. Four soil microsites were sampled in the soil microcosms containing earthworms: the surrounding unburrowed soil (Su) sampled at the top (2–5 cm) of the soil column; the earthworm burrows, i.e. the first 2 mm of burrow linings carefully collected with a spatula from the sides of the entire burrow network (Bu); the casts, i.e. the fecal material deposited at the soil surface which was gathered throughout the incubation period (Ca); and the gut contents, i.e. the soil deposited a Petri dish following a 24 h worm gut purge (Gu). The casts and burrow linings are defined as soil biostructures. After 9 days of incubation, the amount of each soil microsite collected was: 12.3±1.6 g of casts (dry weight), 5.5±0.8 g of burrow linings (dry weight) and 1.8±0.02 g of worm gut purge (dry weight), representing c. 0.8%, 0.3% and 0.1% of the soil in the column. All these soil samples were air-dried, sieved (4 mm mesh size) and used to determine: (1) the structure of the bacterial communities using ribosomal intergenic spacer analysis (RISA); (2) the number of atzA, atzB and atzC sequences (Atrazine-degrading genes) by quantitative PCR; and (3) the Atrazine-degrading bacterial activity by radiorespirometric measurement of 14C-CO2.
Soil DNA extraction
Nucleic acids were extracted from the soil as in Martin-Laurent. (2001). Soil samples (250 mg) were homogenized in 1 mL of extraction buffer (100 mM Tris, pH 8.0; 100 mM EDTA; 100 mM NaCl, 1% (w/v, weight in volume) polyvinylpyrrolidone; 2% (w/v) sodium dodecyl sulfate) for 30 s at 1600 r.p.m. in a mini-bead beater cell disrupter (Mikro-Dismembrator S, B. Braun Biotech International, Germany). Soil and cell debris were removed by centrifugation and the proteins were then precipitated using sodium acetate. After centrifugation, the supernatant was recovered and the nucleic acids were precipitated by adding an equal volume of cold isopropanol. The DNA pellets were carefully washed with 70% ethanol. The soil DNA was purified on a Sepharose 4B spin column (Fluka, Lyon, France). DNA integrity was checked by electrophoresis on 1% agarose gel and quantified at 260 nm using a BioPhotometer (Eppendorf, Hamburg, Germany). DNA was extracted from three different soil samples for each microsite within each treatment. The amount of DNA recovered from the different soil samples ranged from 30 to 90 μg g−1 of soil (dry weight).
Pseudomonas sp. ADP fate in soil microsites
Because Pseudomonas sp. ADP is not resistant to any antibiotics, it cannot be enumerated from soil samples using a selective MS Atrazine medium containing antibiotic. In addition, the inoculated degrading population could not be enumerated by simply plating soil suspensions on agar MS Atrazine medium because the soil used in this study is moderately adapted to Atrazine mineralization; as a result, the growth of indigenous Atrazine-degrading bacteria interferes with the size estimation of the inoculated Pseudomonas sp. ADP population. Two molecular approaches were therefore used to track the inoculated population in the different soil microsites: (1) the terminal restriction fragment length polymorphism (T-RFLP) of the 16S rRNA gene to determine the fate of Pseudomonas sp. ADP in soil from DNA extracts; and (2) the quantification by real-time PCR of the atzC-up sequence providing a specific marker for the pADP1 plasmid harboured by Pseudomonas sp. ADP.
T-RFLP
Terminal restriction fragment length polymorphism (T-RFLP) products of SSU rDNA were generated by PCR from soil DNA extracts using specific primer pairs 27-D4 (5′-AGA GTT TGA TCM TGG CTC AG-3′)–1492r (5′-TAC GGH TAC CTT GTT ACG ACT T-3′), respectively (Gürtler & Stainisich, 1996). Reactions were carried out in a final volume of 50 μL from 50 ng of soil DNA with 1 μM of each specific primer using 2.5 U of Taq DNA polymerase (Appligene Oncor, Qbiogene, Ilkirch, France) in the presence of 0.625 μg of T4 Gene 32 product (Qbiogene). PCR were carried out in a PTC 200 gradient cycler (MJ Research, Waltham, MA) using the following program: 5 min at 94°C, 35 cycles of 1 min at 94°C, 1 min at 55°C and 2 min at 72°C, plus an additional 15-min cycle at 72°C. PCR products were purified using the Microcon purification kit according to the manufacturer's instructions (Millipore, Malsheim, France). The purified PCR products were quantified by comparison with a known amount of the molecular mass marker Smart Ladder (Eurogentec, Angers, France) in 1% native agarose gels. A 50 ng quantity of purified PCR products was digested with 5 U of restriction enzyme MboI in a final volume of 20 μL overnight at 37°C. Digested PCR products were precipitated with 2 μL of 2.5 mg mL−1 glycogen (Q-Biogen), 10 μL of 3 M sodium acetate, 80 μL of MilliQ-water and 250 μL of ice-cold ethanol. Restriction digests were centrifuged for 15 min at 14 000 g at 4°C and washed with 200 μL of ice-cold 70% ethanol. They were then resuspended in 39.5 μL of sample loading solution (Beckman Coulter, Roissy, France) with 0.5 μL of Size Standard-600 (Beckman Coulter) and separated on a capillary electrophoresis sequencer (CEQ2000-XL, Beckman Coulter) run with the following program: denaturation for 2 min at 90°C, injection for 45 s at 2000 V and separation for 60 min at 4800 V. The length and the intensity of the fluorescence signals of the T-RFs were calculated using the CEQ2000-XL fragment analysis system (version 4.3.9).
Quantification of atzC-up sequences
Because pADP1, the plasmid harboured by Pseudomonas sp. ADP, has been fully sequenced, a primer pair overlapping the plasmid backbone and the atzC gene was designed to target the 5′-upstream region of atzC (the atzC-up sequence), thereby providing a marker specific to this plasmid and allowing its quantification from soil DNA extracts. The plasmid pADP1 harboured by Pseudomonas sp. ADP was assessed by quantitative PCR of the atzC-up sequences from DNA samples extracted directly from the soil microsites. The copy number of 16S rRNA gene was determined from each DNA template as an internal standard to check for bias resulting from amplification of nucleic acids extracted directly from the soil. atzC-up quantitative PCR were carried out according to previously described protocols (Martin-Laurent et al.,2004).
Quantitative PCR was carried out in a Smart Cycler (Cypheid, Sunnyvale, CA) using the Smart Kit for Sybr Green I according to the recommendations of the manufacturer (Eurogentec). A 25 ng quantity of soil DNA was used as template in a final volume of 25 μL in the presence of 0.625 μg of T4 Gene 32 product (Qbiogene), which was previously reported to enhance PCR from DNA extracted directly from soil (Vahjen & Tebbe, 1994). The amplification conditions were as follows: 95°C for 10 min; 45 cycles of 15 s at 95°C, 15 s at 60°C and 15 s at 72°C followed by one melting cycle performed from 60 to 95°C by temperature increments of 0.2°C s−1. Gene-specific primers for the amplification of atzC-up (C-UPfor/C-UPrev) were as follows: C-UPfor, 5′-AAT CGA CTT GCT CCC ATG AC-3′; C-UPrev, 5′-TGG TAA AAA GGC CGA TCT TG-3′. Quantitative PCR was calibrated by amplifying a serial dilution of the specific cloned target sequence (from 108 to 101 copies). Calibration curves expressing the log of the copy number of the target gene as a function of the Ct (cycle threshold) were determined: log(atzC-up)=−3.11Ct+39.4 (R2=0.987). Three quantitative PCR reactions were carried out for each soil microsite per treatment.
Bacterial ribosomal intergenic spacer analysis (RISA)
The structure of the microbial communities in the different soil microsites was determined by applying ribosomal intergenic spacer analysis (RISA) to the DNA directly extracted from the soil samples. This technique reveals the 16S–23S rRNA gene intergenic spacer length polymorphism of the bacterial ribosomal operon (Ranjard et al.,2000). The 16S-23S intergenic spacer of the bacterial rDNA was amplified from soil DNA extracts using specific primer pairs 38r (5′-CG GGT TTC CCC ATT CGG-3′)–72f (5′-TGC GGC TGG ATC TCC TT-3′), respectively (Gürtler & Stainisich, 1996). The reactions were carried out in a final volume of 50 μL from 50 ng of soil DNA with 1 μM of each specific primer using 2.5 U of Taq DNA polymerase (Appligene Oncor). PCR was carried out in a PTC 200 gradient cycler (MJ Research) using the following program: 5 min at 94°C, 35 cycles of 1 min at 94°C, 1 min at 55°C and 2 min at 72°C, plus an additional 15 min cycle at 72°C. Aliquots of 8 μL were separated by electrophoresis on a native 6% acrylamide gel run for 17 h at 16 mA. Gels were stained with SYBR green II (Molecular Probes, Leiden, the Netherlands) according to Martin-Laurent. (2001).
Ribosomal intergenic spacer analysis profiles (RISA) were analyzed with the one-dscan 2.03 program (Scanalytics, Billerica, MA). Deduced covariance matrices (presence–absence and relative intensity of each band) were analyzed by principal component analysis (PCA) using the ade-4 software (Thioulouse et al.,1997) to compare any changes in the microbial community between the various treatments. Three RISA profiles were obtained per microsite and per treatment.
Quantification of atzA, atzB and atzC sequences
The Atrazine-degrading genetic potential of the soil microbial communities was determined by quantitative PCR of the atzA, atzB and atzC sequences from DNA samples extracted directly from the soil microsites. As previously described, the copy number of 16S rRNA gene was used as an internal standard to check for nucleic acid amplification bias. Quantitative PCR of atzA, B, and C were obtained according to previously described protocols (Martin-Laurent et al.,2004).
The gene-specific primers used for the amplification of atzA (Afor/Arev), atzB (Bfor/Brev) and atzC (Cfor/Crev) were as follows: Afor, 5′-ACG GGC GTC AAT TCT ATG AC-3′; Arev, 5′-CAC CCA CCT CAC CAT AGA CC-3′; Bfor, 5′-AGG GTG TTA GGT GGT GAA C-3′; Brev, 5′-CAC CAC TGT GCT GTG GTA GA-3′; Cfor, 5′-GCT CAC ATG CAG GTA CTC CA-3′; and Crev, 5′-TCC CCC AAC TAA ATC ACA GC-3′. Calibration curves relating the log of the copy number of the target gene as a function of Ct were determined: log(atzA)=−3.86Ct+41.6 (R2=0.997); log(atzB)=−3.54Ct+40.4 (R2=0.981); log(atzC)=−3.48Ct+38.9 (R2=0.996). The copy numbers of the atzA, B and C sequences in the various soil microsites were analyzed using general linear modelling (GLM) with minitab 13.31 software (Ryan et al.,1985). Three quantitative PCR reactions were carried out per soil microsite and per treatment.
Activity of Atrazine-degrading bacteria
The ability of soil microorganisms to mineralize Atrazine was determined by radiorespirometric analyses (14C-CO2) conducted in experimental miniaturized devices (Soulas, 1993). These consisted of 24-well plates containing the soil covered with Whatman paper wetted with a 3 M barium hydroxide solution. Soil samples (0.5 g equivalent dry weight) collected from the different microcosms were moistened to 80% of the water holding capacity and treated with 0.17 kBq of 14C-uniformly-labeled Atrazine (910 MBq mmol−1, 98% radiochemical purity, 1.5 mg kg−1 soil; Sigma, St. Quentin, France). The plates were incubated in the dark at 20°C for 28 days. The 14CO2 resulting from the mineralization of 14C ring-labeled Atrazine (1.7 kBq at 910 MBq mmol−1, 98% radiochemical purity; Sigma) was precipitated on Whatman paper and, after 2 h drying at 80°C, the membranes were scanned using a phosphor imager (Storm®, Molecular Dynamics, Sunnyvale, CA). The computed data were then analyzed with the imagequant program (Molecular Dynamics). Atrazine-degradation kinetics were modeled using the modified Gompertz growth model ( ) and sigmaplot® 4.0 (SYSTAT Software Inc., Chicago, IL) (Piutti et al.,2002). Three parameters were determined: a, the plateau or maximum percentage of Atrazine mineralized by soil microorganisms; ti, the abscissa of the inflexion point related to the size of the Atrazine-mineralizing communities; and k, the mineralization rate constant of the Atrazine-mineralizing communities. There were three replicates per treatment. The parameters were analyzed using GLM with minitab 13.31 software (Ryan et al.,1985).
Results
Earthworm biological activity
All earthworms in each of the four treatments (control soil, S; soil treated with Atrazine, SA; soil inoculated with Pseudomonas sp. ADP, SP; and soil inoculated with Pseudomonas sp. ADP and treated with Atrazine, SPA) were recovered from the microcosms after 10 days of incubation. The biomass quantification for the anecic earthworm Lumbricus terrestris showed that this declined moderately in all the treatments (Fig. 1). However, the biomass differences between treatments were not statistically significant (Kruskal–Wallis nonparametric test, H=5.82, dl=3, P=0.121). On the other hand, the biomass of the endogeic Aporrectodea caliginosa was not affected by the different treatments except in the soil microcosms inoculated with Pseudomonas sp. ADP and treated with Atrazine. It should be noted that, although the greatest losses in earthworm biomass were obtained for this latter treatment, these did not differ significantly from the control due to the high accompanying variability. Earthworm burrowing and casting activities were high in all the soil microcosms (55.9±8.6 mg of cast per day per mg of earthworm), and sufficient soil biostructures (surface casts and burrow linings) could thus be collected for experimental purposes.
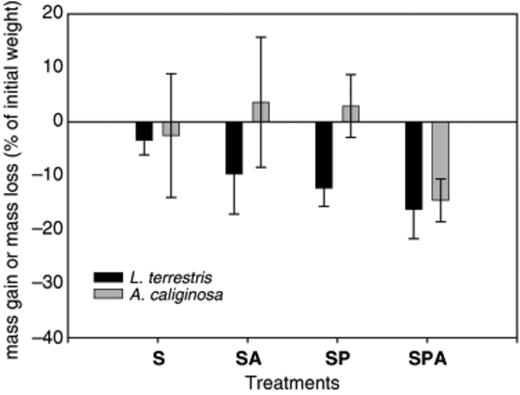
Evolution of the biomass of two earthworm species Lumbricus terrestris and Aporrectodea caliginosa in the soil microcosms treated with Atrazine (SA), inoculated with Pseudomonas sp. ADP, inoculated with Pseudomonas sp. ADP and treated with Atrazine (SPA) and control (S) after 10 days of incubation. Bar indicates standard deviation (n=3).
Fate of Pseudomonas sp. ADP in soil
Digestion of the 16S rRNA gene PCR product of Pseudomonas sp. ADP with MboI in the T-RFLP analysis yielded a x T-RF of 80 bp. This T-RF was observed in all the soil microsites (Fig. 2a), irrespective of the inoculation treatment (Fig. 2b). The T-RF showed gave a similar surface area in each microsite, irrespective of the inoculation status, indicating that the impact of Pseudomonas sp. ADP inoculation could no longer be detected by T-RFLP in soil microsites after 2 weeks (Fig. 2b). However, the surface area of T-RF80 was significantly lower in the biostructures (Fig. 2b, P<0.01, n=3). Similar results were obtained for soil treated with Atrazine (data not shown).
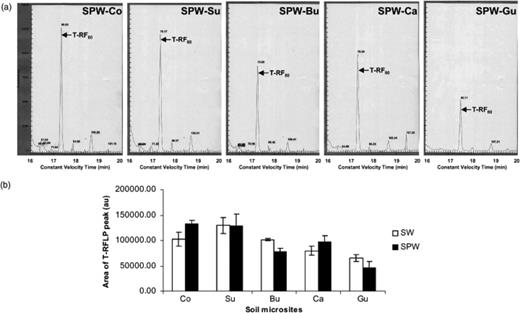
(a) T-RFLP fingerprints of 16S rRNA gene products amplified from soil samples not treated with Atrazine but inoculated with earthworms and with Pseudomonas sp. ADP (SPW). The arrow indicates the terminal restriction fragment (T-RF) of 80 bp observed for Pseudomonas sp. ADP. (b) Analysis of the surface area of the 80 bp T-RF (corresponding to that of Pseudomonas sp. ADP) from soil samples inoculated with earthworms not treated with Atrazine and either inoculated (SPW) or not inoculated with Pseudomonas sp. ADP (SW). The microsites sampled were control soil (Co), surrounding soil (Su), burrow linings (Bu) casts (Ca) and Gut contents (Gu). Bar indicates standard deviation (n=3).
The specific marker of pADP1 (atzC-up sequence) from DNA extracted from soil not inoculated with Pseudomonas sp. ADP was not apparent in any detectable PCR product. atzC-up sequences were successfully amplified from soil samples inoculated with Pseudomonas sp. ADP, as shown in Fig. 3. Interestingly, a significantly higher amount of the atzC-up sequence was amplified from control and surrounding soils than from the biostructures. Whereas atzC-up was detected at relatively low concentrations in cast and burrow linings, it was not detected in DNA samples extracted from the gut. These results further confirmed the T-RFLP data suggesting that Pseudomonas sp. ADP significantly decreased in the biostructures by revealing that pADP1, harboured by this Atrazine-degrading strain, almost disappeared from the biostructures. It is noteworthy that higher amounts of the atzC-up sequence were detected in the control and surrounding soil microsites of soil microcosms treated with Atrazine than in those not treated with this herbicide.
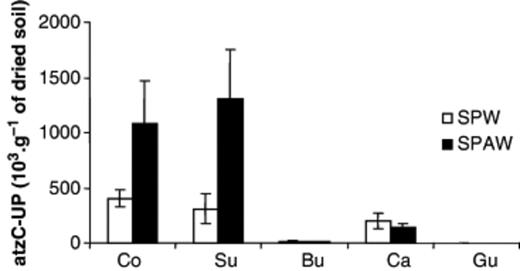
5′-upstream atzC sequence quantities (103 copies per gram of dried soil) determined in soil samples inoculated with earthworms and with Pseudomonas sp. ADP and either treated or not treated with Atrazine (SPW/SPAW). The microsites sampled were control soil (Co), surrounding soil (Su), burrow linings (Bu), casts (Ca) and gut contents. Bars indicate standard deviations.
Structure of soil bacterial communities
Ribosomal intergenic spacer analysis (RISA) conducted on DNA (extracted directly from control and surrounding soils, burrow linings, cast and gut contents fractionated from soil either treated or not treated with Atrazine and either inoculated or not inoculated with Pseudomonas sp. ADP) produced relatively complex fingerprints (30–40 bands per lane), as shown in Fig. 4(a). In general, the RISA fingerprints between replicates of the same treatment were very similar, whereas four different soil microsites could be discriminated between treatments: the control and surrounding soil (Co and Su), the burrow linings (Bu), the casts (Ca) and the gut contents (Gu). The first two axes in the four PCAs explained more than 61% of the variance of the data set. For the control soil, namely those not treated with Atrazine and not inoculated with Pseudomonas sp. ADP (Fig. 4b), ordination on PC1 differentiated the bacterial communities according to their soil microsite origin. The microbial structures of the control and surrounding soils as well as those of the casts were similar, but different from those observed in burrow linings and gut contents, respectively. For the soil treated with Atrazine (Fig. 4c), only the bacterial communities from the gut contents differed from those of all the other microsites. For the soil inoculated with Pseudomonas sp. ADP (Fig. 4d), the PC2 axis discriminated the bacterial communities of control and surrounding soils from those of burrow linings, casts and gut contents. For the soil treated with Atrazine and inoculated with Pseudomonas sp. ADP (Fig. 4e), the PC1 axis discriminated the bacterial communities of gut contents from those of control and surrounding soils, as well as those of burrow linings and casts. PCA underlined the importance of the ingestion effect of earthworms, because the microbial structure of the gut content always differed from that of other soil microsites.
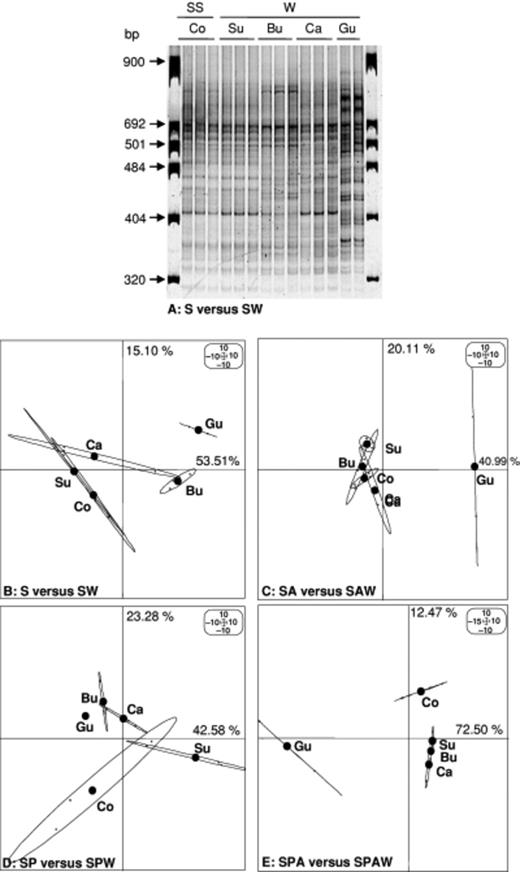
Ribosomal intergenic spacer analysis (RISA) fingerprints of PCR products amplified with 16S–23S rRNA gene universal primers (38r and 72f) from DNA extracted from soil samples not treated with Atrazine and either inoculated or not inoculated with earthworms (a). PCA ordination of RISA fingerprints generated from DNA extracted from soil samples not treated with Atrazine and inoculated or not with earthworms (S vs. SW) (b), treated with Atrazine (SA vs. SAW) (c), inoculated with Pseudomonas sp. ADP (SP vs. SPW) (d), or treated with Atrazine and inoculated with Pseudomonas sp. ADP (SPA vs. SPAW) (e). The microsites sampled were control soil (Co), surrounding soil (Su), burrow linings (Bu) casts (Ca) and Gut contents (Gu). The variance percentages explained by PCA axes 1 and 2 are shown on each panel on the x- and y-axes, respectively.
Atrazine mineralization activity
Atrazine mineralization kinetics were determined by radiorespirometry. The mineralization kinetics of 14C-ring-labeled Atrazine observed for soil samples inoculated or not with Pseudomonas sp. ADP and treated or not with Atrazine are depicted in Fig. 5. They indicate that soil samples not inoculated with Pseudomonas sp. ADP showed slow adaptation to Atrazine mineralization because only 20% of the initially added Atrazine was mineralized after 28 days of incubation. No significant effect of Atrazine treatment or of soil microsite (Co, Su, Bu or Ca) could be detected on the Atrazine-mineralizing activity of soil samples not inoculated with Pseudomonas sp. ADP, as shown by: (1) mineralization kinetics (Fig. 5); (2) modeled kinetic parameters (Table 1); and (3) the parameters of the general linear modeling of Atrazine mineralization (Table 2). The Atrazine mineralization rate did not differ significantly between the biostructures (Bu and Ca) and the soil not visited by earthworms. In contrast, the mineralization kinetics of soil samples inoculated with Pseudomonas sp. ADP were typical of adapted soil, with up to 80% (i.e. five times more) of the initially added Atrazine mineralized over a 28-day incubation period (Fig. 5; Table 2). Again, no impact of Atrazine treatment on the Atrazine-degrading activity of inoculated soil samples was detected (Fig. 5; Table 2). However, in this case the biostructures showed a significantly lower Atrazine-degrading activity than the control and unburrowed soils. This low activity was in fact very similar to the basal activity observed in the noninoculated soil microsites.
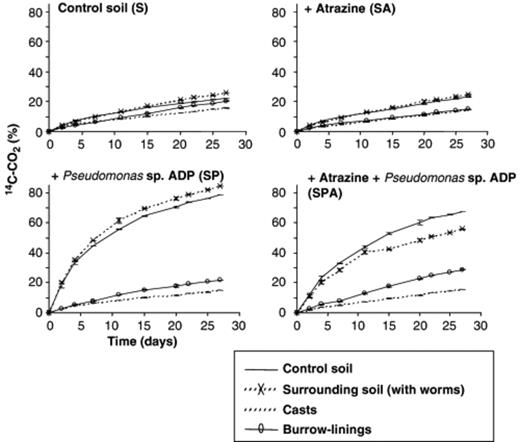
Kinetics of Atrazine mineralization during the 28 days of incubation (expressed as% of initially applied Atrazine) from control soil (panel S), soil treated with Atrazine (panel SA), soil inoculated with Pseudomonas sp. ADP (panel SP) or inoculated with Pseudomonas sp. ADP and treated with Atrazine (panel SPA), The microsites sampled were control soil (Co), surrounding soil (Su), burrow linings (Bu) and casts (Ca). Bar indicates standard deviation (n=3).
Parameters of Atrazine mineralization (±standard deviations) obtained for each soil sample after fitting the modified Gompertz growth model
| Treatment | Microsite | a | k | ti |
| Control | Control | 15.49 ± 2.76 | 10.30 ± 0.89 | 17.75 ± 0.91 |
| Unburrowed | 20.96 ± 2.79 | 10.29 ± 0.88 | 18.13 ± 1.04 | |
| Burrow linings | 13.64 ± 9.79 | 10.01 ± 1.66 | 17.02 ± 1.95 | |
| Cast | 14.58 ± 6.95 | 10.43 ± 0.94 | 18.30 ± 0.75 | |
| Atrazine | Control | 18.79 ± 8.37 | 10.89 ± 2.82 | 18.95 ± 4.97 |
| Unborrowed | 18.26 ± 0.59 | 11.32 ± 2.90 | 19.31 ± 4.85 | |
| Burrow linings | 14.82 ± 2.10 | 6.34 ± 5.75 | 19.73 ± 1.24 | |
| Cast | 18.08 ± 1.02 | 10.71 ± 3.91 | 21.35 ± 3.00 | |
| Pseudomonas | Control | 77.72 ± 1.06 | 5.79 ± 4.95 | 19.13 ± 2.18 |
| Unborrowed | 81.29 ± 8.09 | 6.69 ± 5.32 | 17.16 ± 2.30 | |
| Burrow linings | 4.76 ± 2.52 | 11.58 ± 3.16 | 19.69 ± 5.87 | |
| Cast | 13.30 ± 1.22 | 11.52 ± 3.18 | 19.38 ± 6.05 | |
| Pseudomonas× Atrazine | Control | 74.68 ± 0.84 | 10.94 ± 4.02 | 21.22 ± 4.51 |
| Unborrowed | 74.09 ± 0.68 | 8.86 ± 2.54 | 18.68 ± 1.39 | |
| Burrow linings | 18.52 ± 7.02 | 9.62 ± 3.61 | 16.88 ± 2.59 | |
| Cast | 12.74 ± 4.03 | 9.62 ± 3.61 | 19.18 ± 0.67 |
a, the maxim percentage of mineralization (%14CO2 day−1); k, the rate of mineralization (day−1); ti, the abscissa of the inflexion point (day). Treatments were as follows: control soil (control), soil treated with Atrazine (Atrazine), soil inoculated with Pseudomonas sp. ADP (Pseudomonas) and soil inoculated with Pseudomonas sp. ADP and treated with Atrazine (Pseudomonas× Atrazine). Sampled microsites were as follows: control, unburrowed soil, burrow linings and cast.
General linear modeling of the Atrazine mineralization parameters obtained after fitting the modified Gompertz growth model
| a | k | ti. | ||||
| F | P | F | P | F | P | |
| Atrazine | 0.53 | 0.473 | 0.01 | 0.917 | 0.38 | 0.543 |
| Pseudomonas | 369.99 | 0.000 | 0.15 | 0.704 | 0.73 | 0.401 |
| Microsites | 183.09 | 0.000 | 5.24 | 0.005 | 2.51 | 0.077 |
| Atrazine ×Pseudomonas | 0.04 | 0.852 | 1.70 | 0.203 | 1.65 | 0.208 |
| Atrazine × mcirosites | 3.05 | 0.043 | 1.65 | 0.198 | 0.92 | 0.441 |
| Pseudomonas× microsites | 151.34 | 0.000 | 1.73 | 0.182 | 1.40 | 0.261 |
| Atrazine ×Pseudomonas× microsites | 2.37 | 0.090 | 1.40 | 0.263 | 0.85 | 0.477 |
a, the maximum percentage of mineralization (%14CO2 day−1); k, the rate of mineralization (day−1); ti, the abscissa of the inflexion point (day). Three factors, Atrazine-treatment, inoculation of Pseudomonas sp. ADP and soil microsites, are considered as well as their interactions (P<0.005).
The Atrazine-mineralizing activity, following soil inoculation, was strongly enhanced except in soils ingested and burrowed by earthworms (Table 2). However, the Atrazine-degrading activity in the soil microcosms inoculated with Pseudomonas sp. ADP was not significantly reduced in the soil surrounding earthworm biostructures.
Abundance of atzA, B and C genes
The amounts of atzA, B and C genes recovered from the various soil microsites were roughly the same (Fig. 6). In all the samples studied (control and surrounding soil, burrow linings, casts), the copy numbers of atz sequences determined from soil samples not inoculated with Pseudomonas sp. ADP (i.e. S/SW and SA/SAW) were always less than 1.5 × 10⁵ copies per gram of dried soil. It should be noted that a high atzA copy number was obtained in earthworm gut from the two noninoculated control and Atrazine treatments. Atrazine treatment did not significantly affect the atzA, B and C gene copy numbers in soil samples not inoculated with Pseudomonas sp. ADP (Fig. 6; Table3).
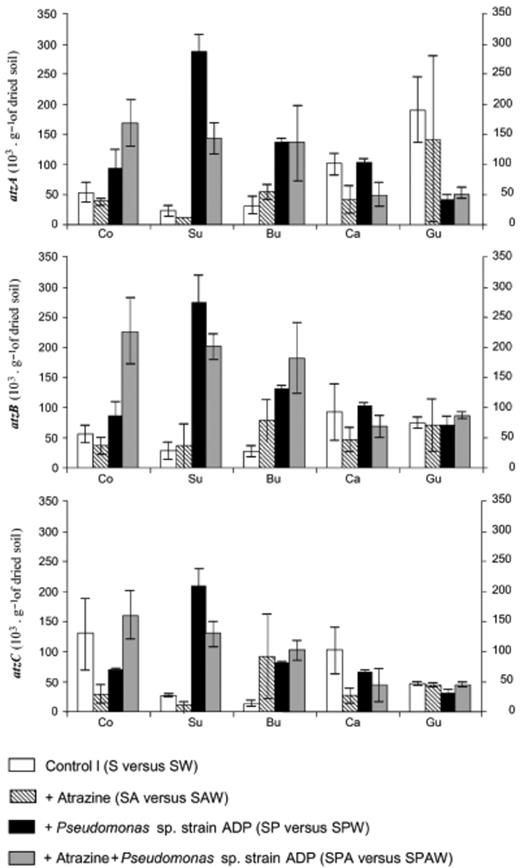
atzA, B and C sequence quantities (103 copies per gram of dried soil) determined in soil samples not treated with Atrazine and inoculated or not with earthworms (S/SW), treated with Atrazine (SA/SAW), inoculated with Pseudomonas sp. ADP (SP/SPW) or treated with Atrazine and inoculated with Pseudomonas sp. ADP (SPA/SPAW). The microsites sampled were control soil (Co), surrounding soil (Su), burrow linings (Bu), casts (Ca) and gut contents. Bars indicate standard deviations.
Additions used in final culturing media for each of the two mixed cultures and for strain TR1 (final concentrations)
| atzA | atzB | atzC | ||||
| F | P | F | P | F | P | |
| Atrazine | 6.59 | 0.015 | 1.19 | 0.284 | 1.34 | 0.254 |
| Pseudomonas | 35.85 | 0.000 | 115.54 | 0.000 | 30.51 | 0.000 |
| Microsites | 2.84 | 0.038 | 6.88 | 0.000 | 6.90 | 0.000 |
| Atrazine ×Pseudomonas | 0.00 | 0.976 | 1.86 | 0.181 | 3.65 | 0.064 |
| Atrazine × microsites | 5.70 | 0.001 | 7.07 | 0.000 | 6.29 | 0.001 |
| Pseudomonas× microsites | 32.01 | 0.000 | 19.77 | 0.000 | 15.21 | 0.000 |
| Atrazine ×Pseudomonas× microsites | 4.97 | 0.003 | 6.14 | 0.001 | 10.22 | 0.000 |
ADP and soil microsites, as well as their interactions (P<0.005).
The copy numbers of Atrazine-degrading sequences determined from control and surrounding microsites of soil inoculated with Pseudomonas sp. ADP ranged from 0.7 to 2.9 × 10⁵ of atz sequences per gram of dried soil. Overall soil inoculation with Pseudomonas sp. ADP produced a significant increase in the amount of atzA, B and C in the soil microsites (GLM, Table 3). As previously shown for soil samples not inoculated with Pseudomonas sp. ADP, Atrazine treatment did not affect atzA, B and C copy numbers (Table 3). The atz sequence copy numbers were highest in control and surrounding soils (c. 2 × 10⁵ copies of atz sequences per gram of dried soil), whereas those determined in the ingested soil, casts and gut contents microsites showed the lowest values (c. 0.5 × 10⁵ copies of atz sequences per gram of dried soil), the atz copy number in the burrow linings being intermediate (c. 1.5 × 10⁵ copies of atz sequences per gram of dried soil). The amounts of atz genes differed significantly (P<0.005) between the soil microsites (Table 3).
Discussion
This study illustrates the biotic interactions between earthworms and the bacterial community involved in degradation of the herbicide Atrazine in a maize-cropped soil. We showed that earthworms significantly affected the structure of the soil bacterial communities in the biostructures. They also regulated Atrazine mineralization by notably reducing the rate of Atrazine mineralization as well as by diminishing the Atrazine-degrading genetic potential, determined by real-time PCR quantification of the copy number of atzA, B and C genes, in the biostructures of soil microcosms inoculated with Pseudomonas sp. ADP. The Atrazine mineralization activity observed in the control soil (S), that is the one not treated with Atrazine and not inoculated with Pseudomonas sp. ADP, was relatively low, and only 20% of the total applied Atrazine was mineralized after 28 days of incubation. Complete mineralization of the Atrazine molecule in this case would probably be brought about by a fraction of the indigenous soil microflora adapted to the biodegradation of this herbicide and occur via catabolic pathways (Assaf & Turco, 1994). The atzA, B and C genes coding the catabolic enzymes involved in Atrazine mineralization (Souza et al.,1996; Boundy-Mills et al.,1997; Sadowsky et al.,1998) were detected in all the microsites of the control soil. In particular, a high atzA copy number was detected in earthworm gut from the two noninoculated control and Atrazine treatments, but not in the inoculated treatments with Pseudomonas sp. ADP. This suggests that the indigenous Atrazine-degrading microflora harbouring atzA genes survived worm ingestion and passage through the gut better than the specific Pseudomonas sp. ADP population. In addition, one could hypothesize that Pseudomonas inoculation affected the abundance of Atrazine-degrading microflora, in particular the one harbouring atzA genes.
In the inoculated soil, Pseudomonas sp. ADP provides the complete Atrazine catabolism pathway (Mandelbaum et al.,1995), adds to the Atrazine-mineralizing community and thereby contributes to the acceleration of Atrazine mineralization (70–80% of the applied Atrazine) in the control and surrounding soils. The atz copy numbers in the control and surrounding soil microsites in the soils inoculated with Pseudomonas sp. ADP (106 CFU g−1 of soil), ranged from 5 × 10⁴ to 20 × 104, suggesting a moderate decline (i.e. less than 2-log) in the number of Pseudomonas sp. ADP 10 days after its inoculation irrespective of the treatment applied to the soil (i.e. presence of earthworms and Atrazine treatment). In addition, T-RFLP analysis revealed that the impact of Pseudomonas sp. ADP inoculation was not detectable on the surface area of the T-RF of 80 bp, reinforcing the possibility of a decline of the inoculated population. This is in agreement with reports in the literature of a 2-log decline observed for Pseudomonas fluorescens (Daane et al.,1996) and Pseudomonas aeruginosa (Glew et al.,1993) 15 days after their inoculation to a soil microcosm. Moreover, we showed that the amount of Atrazine mineralized after Pseudomonas sp. ADP inoculation was strongly increased, indicating that Pseudomonas sp. ADP was efficient at least in this short term.
The earthworms in the inoculated soil counteracted the effect produced by Pseudomonas sp. ADP by ingesting and burrowing the soil. It has recently been shown that earthworms slow down Atrazine mineralization in both artificial miniaturized soil microcosms (Farenhorst et al.,2000) and packed soil columns (Farenhorst et al.,2000; Binet et al., 2005). In this study, we demonstrated that the diminution of Atrazine mineralization in soil disturbed by earthworms could partly be explained by low effective mineralization rates in the biostructures. We also showed that through soil ingestion and, to a lesser extent, through soil burrowing, earthworms reduced the size of the inoculated population of Pseudomonas sp. ADP, as shown by the quantification of pADP1. In addition, earthworms significantly lowered Atrazine mineralization as well as the Atrazine-degrading genetic potential evaluated by real-time PCR targeted on atz genes.
Several possible hypotheses relying on physical, microbiological and chemical mechanisms may explain why Atrazine mineralization activity was decreased in earthworm biostructures. One hypothesis is simply based on the physical process of pesticide sorption. It is well documented that Atrazine sorption is carbon dependent (Khan, 1978; Houot et al.,1998; Farenhorst & Bowman, 2000). Indeed, Atrazine sorption was found to be higher in earthworm biostructures which were enriched in organic carbon (Stehouwer et al.,1994; Bolan & Baskaran, 1996; Farenhorst et al.,2000; Binet et al., 2005). The bioavailability of Atrazine would therefore be expected to decrease a result of its increased sorption on available organic carbon, which would in turn diminish its degradation in earthworm biostructures. However, in our study, the potential Atrazine-degrading activity was determined in the different microsites by incubating Atrazine-treated soil samples in a radiorespirometer (Soulas, 1993). Prior to this measurement, the soil was finely sieved and humidified to 80% of its water holding capacity. This procedure should favour the bioavailability of Atrazine as well as the degrading activity of the soil microflora. Thus, although the sorption of a fraction of the added Atrazine cannot be excluded, its availability to the degrading microflora does not seem to be a major limitation in our experimental conditions.
A second hypothesis which could account for the decrease of Atrazine mineralization in the biostructures (burrows and casts) collected from the soils inoculated with Pseudomonas sp. ADP could be that survival of the inoculum was reduced by the earthworm. In our experiment, the study of the genetic structure of the bacterial communities, determined by RISA fingerprinting, revealed the existence of a microbial genetic structure specific to earthworm gut and, to a lesser extent, to casts and burrow linings. It should be noted that the genetic structure of the microbial communities of the burrow linings in the control soil differed from that of the soil but also from that of the casts. This observation supports the suggestion of Tiunov & Scheu (1999) that the burrow wall of L. terrestris sustains a specific microbial community. Atrazine treatment modifies the genetic structure of the microbial communities, as compared to those observed in control soil, by notably diminishing the differences induced by earthworm activity.
Earthworms have been shown to interact with soil microbial communities by modifying: (1) their size (Atlavinyté & Lugauskas, 1971; Kristufek et al.,1992); (2) their structure in burrow linings (Tiunov & Dobrovolskaya, 2002), in casts and the soil matrix (Binet, 1993; Pedersen & Hendriksen, 1993; Tiunov & Scheu, 2000); and (3) their activity in the soil matrix (Scheu et al.,2002; Tiunov & Dobrovolskaya, 2002), in burrow linings (Tiunov & Scheu, 1999) and casts (Tiunov & Scheu, 2000). Our results based on DNA analysis also endorse the fact that gut contents are isolated portions of soils that are not microbiologically equivalent to soil (Karsten & Drake, 1995), due in part to the selection of certain soil microbial species adapted to this environment (Furlong et al.,2002) and/or to the presence of microbial symbionts located in the guts of L. terrestris by scanning electron microscopy (Joly et al.,1993). We observed that the potential Atrazine-mineralizing activity of both the indigenous Atrazine-mineralizing bacterial communities and the Pseudomonas sp. ADP population was decreased in the biostructures formed by earthworms. T-RFLP analysis suggested that the population size of Pseudomonas sp. ADP and bacteria harbouring a T-RF of 80 bp was reduced in the biostructures. The measurement of pADP1 by quantitative PCR revealed that the abundance of this plasmid was strongly reduced in the biostructures formed by earthworms. In fact, based on the assumption that the copy number of atz genes detected by real-time PCR mainly corresponded to the number of Pseudomonas sp. ADP cells, the survival of Pseudomonas sp. ADP was apparently greatly diminished in the biostructures formed by L. terrestris and A. caliginosa.
A third hypothesis that could explain why Atrazine mineralization was reduced in earthworm biostructures, even in soil microcosms inoculated with Pseudomonas sp. ADP, is that earthworm activity not only changed the abundance but also the activity of the Atrazine-mineralizing communities. The digestive gut of earthworms is a soil hotspot, presenting anoxic conditions (Horn et al.,2003), containing antibiotics (Kristufek et al.,1993) and large amounts of cellulolitic and proteolytic enzymes (Edwards & Lofty, 1972), and passage of the soil through the gut may further affect the viability and growth of soil microorganisms as well as their activity in the biostructures.
We have shown that the genetic structure of soil bacterial communities was modified and the Atrazine-mineralizing activity reduced not only in the casts through ingestion but also in the burrow linings through burrowing. In contrast to casts, burrow linings consist partly of ingested soil but mostly of noningested soil that is pushed aside as the earthworm progresses through the burrow. Irrespective of soil ingestion, Atrazine-degrading activity was also decreased in the burrow linings. Although the global activity of soil microorganisms, determined from the RNA : DNA ratio, was higher in the earthworm biostructures compared with unburrowed soil (data not shown). Atrazine mineralization was also reduced, suggesting that the Atrazine-mineralizing activity was particularly affected in the biostructures. On the one hand, Pseudomonas sp. ADP uses Atrazine as a nitrogen source for growth (Mandelbaum et al.,1995); on the other hand, high contents of NH4+ and NO3− were found in casts (Lunt & Jacobson, 1945; Parle, 1963) and in burrows (Binet, 1993). The nitrogen compounds excreted in mucus and urine are reported to constitute a labile source of nitrogen for soil microorganisms (Parmelee et al.,1998).In addition, mineral nitrogen input has been demonstrated to reduce Atrazine mineralization in soils (Entry et al.,1993; Barriuso & Houot, 1996). Thus the N (urea and NH4+) available in casts and burrow linings might be used preferentially by the Atrazine-degrading bacterial communities instead of the N derived from Atrazine. In addition, Pseudomonas sp. ADP is an alternative denitrifier and able to mineralize Atrazine under anaerobic conditions using NO3− as an alternative electron acceptor (data not shown). The enhanced N bioavailability together with the anaerobic conditions found in these biostructures might affect the expression of the Atrazine-degrading potential of the Atrazine catabolic pathway. Further experiments will investigate the expression of Atrazine-degrading genetic potential in the biostructures formed by earthworms.
Acknowledgements
We would like to thank Laurent Cornet, Stéphanie Hallet, Michel Lefeuvre and Nadine Rouard for technical support. We also thank Diana Warwick for critical reading of the manuscript. This work was funded by CNRS as part of the Programme Environnement, Vie et Sociétés (PEVS) and supported by the Conseil Regional de Bretagne through a PhD funding to A. Kersanté.
References
