


Abstract
We investigated whether bacterial motility and chemotaxis in the ocean enables bacteria to approach and follow microscopic, moving, point sources of nutrients. The turbulent nature of the ocean combined with the imprecision of run and tumble chemotaxis has led to the assumption that marine bacteria cannot cluster around microscopic point sources. Recent work, however, shows that marine bacteria use a run and reverse strategy. We examine the ability of marine bacteria that use run and reverse chemotaxis to respond to and follow a moving point source. The addition of the 6 μm in diameter motile algae Pavlova lutheri to cultures of the marine bacteria Pseudoalteromonas haloplanktis and Shewanella putrefaciens revealed bacterial tracking individual free-swimming algae. The marine bacteria travelled at up to 445 μm s−1 when tracking, up to 237 μm s−1 when not tracking and up to 126 μm s−1 in cultures without the algae. Tracking maintained bacteria within one run length of an alga. The bacteria appeared able to steer, consecutively turning up to 12 times toward the motile algae. They recovered from the occasional incorrect turn to continue moving around the swimming alga, indicating that marine bacteria can track moving point sources and form transient phyto-bacterial associations. Our analysis suggests tracking increases nutrient uptake by bringing cells into regions of high nutrient concentrations and by increased advection from high speeds. This result describes what is, apparently, one of the tightest spatial and temporal links between free-living primary and secondary producers in planktonic ecosystems.
1 Introduction
Bacterial chemotaxis is effective for cell migrations of centimetres [1]. The presence of a concentration gradient causes a chemosensory response that alters the stopping, and thus the turning, frequency of the bacteria to either increase or decrease the run-lengths of the cells. The effect of these behavioural changes is a general slow migration of the bacteria either away from or towards areas of high chemical concentration [2]. The generalised random walk model for bacterial chemotaxis, involves bacteria swimming in a relatively straight line ‘run’ and stopping to complete a tumble before swimming off in a new random direction, therefore migration of a few centimetres may require many hours. However, the limits of efficiency for these migrations are based on statistical arguments and observation of selected species, such as Escherichia coli[2,3]. Recent work shows marine bacterial chemotaxis differs from that of terrestrial and enteric bacteria, with migration producing bands or clusters tens of micrometres in their smallest dimension in a few seconds rather than hours [4–6]. Common to work on both forms of chemotaxis are the use of fixed nutrient sources and gradients that are long lived compared to the typical 1-s swimming paths between turns. In contrast to centimetre-long nutrient gradients, some nutrient sources such as microalgae and detritus are tens of micrometres across and move either by swimming, sinking or advection.
Marine bacteria inhabit a largely oligotrophic environment with ephemeral, nutrient-enriched particles or point-source microenvironments [7,8]. Blackburn et al., [5] used a numerical model to support the hypothesis [9] that pelagic marine bacteria could take advantage of point sources of phytoplankton exudate release. The ability of bacteria to associate with discrete sources of nutrients would be advantageous, enabling bacteria to benefit from transient microenvironments and move on once the nutrient source was depleted. However, the turbulent nature of the ocean means that what is a few centimetres away from a bacterium one minute might be tens of centimetres or a metre away the next minute. Scale is an important consideration in marine bacterial chemotaxis, if it is going to be useful in the ocean then it would need to be better adapted to respond rapidly over short distances. The oligotrophic high flow regime environment experienced by marine bacteria may cause strong selection for rapid signal detection, unlike E. coli taxis which is far from the theoretical limits proposed by Segall et al. [10].
Motile marine bacteria have a modified swimming behaviour from that of Brown and Berg's E. coli random walk model [2]. Typically, marine bacteria swim at much higher speeds, up to 400 μm s−1[11,12], than E. coli with maximum speeds of only 40 μm s−1[13]. Marine bacteria also exhibit a run and reverse strategy, which enables them to form tight (<20 μm wide) swarm bands around air bubbles or chemical attractants [4,6,14,15]. Based on this run and reverse behavior Luchsinger et al. [16] developed a computer model, which showed that bacteria would be able to orient themselves around fixed point sources of nutrients in a shear field. As such, both flow and motility would be required for marine bacteria to cluster around a stationary nutrient source. However, this assumed that marine bacteria relied on flow alone to bring them toward a nutrient patch with motility having purely a control function. Luchsinger et al. [16] did not consider the possibility that bacteria could actively seek out point sources of nutrients.
In previous studies the nutrient source was assumed to be either a stationary point source or a gradient [1,2,5,6]. Here, we examine the ability of bacteria to respond to a moving point source and explore the limits of manoeuvring by investigating the extent to which bacteria can follow a moving point source. We used a marine system, because marine bacteria are highly motile, ocean turbulence places a premium on the ability to remain close to a nutrient source, and background nutrients are low, which ensures a high signal to noise ratio. Using dark-field microscopy, we observed and measured bacterial isolates capable of tracking free-swimming algal cells. Our results show that previous studies based on models which use standard chemotactic parameter values and assumptions [17–19], need to be revised or new models developed to take into account the new motility response described here.
2 Materials and methods
2.1 Phytoplankton and bacterial strains
The free-swimming golden brown alga, Pavlova lutheri, was grown in axenic batch cultures at 20°C in F2 medium without a silicon source, modified from Guillard and Ryther [20] and Guillard [21]. P. lutheri cells have dual flagella and a cell diameter of 4–6 μm [22].
The bacterial isolates’ medium was based on that of Malmcrona-Friberg et al. [23] with the modification, that vibrio artificial seawater (VAS) [12] replaced the salts solution. Cultures of the motile marine bacteria Shewanella putrefaciens and Pseudoalteromonas haloplanktis were taken from VAS slopes and transferred to VAS plates for 3 days, until colonies formed. Individual colonies were selected for those displaying the highest motility. These were inoculated into sterile 1% Tryptic Soy Broth (TSB; Difco Laboratories) in an overnight shaker at room temperature (23°C) for 12 h. TSB was chosen as a nutrient source to increase cell number and stimulate motility [12]. The cultures were then checked for motility and an aliquot of each of the motile cultures was transferred to conical flasks, to a final concentration of 0.01% TSB, sealed and left at room temperature for 36 h to stimulate motility [12].
2.2 Bacterial tracking of phytoplankton cells
Four trials were set up with combinations of the single bacterial and algal species. After the 36 h, 30-μl aliquots from either of the two bacterial cultures, S. putrefaciens or P. haloplanktis were placed into a 1-mm-deep microscope slide chamber [14] with a 10-μl aliquot of the alga P. lutheri (108±23 cells). This gave a ratio of 1000:1 bacterial to algal cells, which is similar to concentration ratios found in the open ocean [24]. The mixed samples of bacteria and alga were then covered with a glass coverslip but not sealed.
Bacterial and algal cell trajectories were recorded for cells tracking and for bacteria greater than 50 μm away from an alga. To determine if there was a general cue for tracking, bacteria were recorded in samples with and without algae. Additionally, in a control to test for bacterial entrainment by algal cells, 0.8-μm-diameter latex beads (Sigma, Australia) were used as a substitute for bacteria with samples of P. lutheri.
Each trial was run at room temperature, 23°C, for 40 min and experiments for each treatment were repeated four times. Bacterial and algal cultures were only mixed during the experiments in the microscope slide chambers, at no other time during their culturing process were they exposed to each other.
2.3 Microscopy
Observation of bacterial and algal swimming was under dark-field, 200× magnification videomicroscopy (JVC TK-1280E video camera and Olympus BHT, trinocular microscope) with the field of view at mid-depth in the microscope slide chamber. The video image was recorded continuously by a video cassette recorder with a frame speed of 24 frames s−1 (Panasonic NV-HS1000). A heat dissipation filter consisting of water in a container 3 cm thick was used to minimise the effect of any temperature changes caused by the microscope lamp [6].
2.4 Swimming trajectory measurement
Cell paths of the algae and bacteria were measured frame by frame, traced off of the video screen and converted into swimming trajectories with x,y coordinates and time in seconds [4]. By plotting the swimming trajectories of the cells with x,y coordinates it was possible to calculate run length and speed, as well as the turn angle and distance of bacterial cells in relation to tracked algae, enabling correct number of turns by bacteria toward alga to be recorded. The concentration of motile bacteria and algal cells within each sample was measured from video images and calculated using the focal depth and direct counts of those cells in the field of view [4,6].
3 Results
The algae, swimming with an average speed of 37 μm s−1 (±26 standard deviation), were tracked by either individual cells or groups of up to five bacteria at a time. Less than 10% of the algal cells were tracked at any one time and not all bacteria in the suspension tracked algal cells at the same time. We measured no difference in the tracked or non-tracked swimming behaviour of the algae.
Bacterial abundance, obtained from dark-field microscopy counts, ranged between 1.6×10⁶ and 2.4×10⁶ cells ml−1, while algal cell concentrations were 2.1×10³ cells ml−1 to 3.3×10³ cells ml−1. Treatments were repeated on four separate occasions with each of the two bacterial strains, P. haloplanktis and S. putrefaciens, and tracking was observed in each of four replicate slide preparations. The results of 200 frames from controls, using 0.8-μm latex beads as a passive substitute for bacteria, showed no ‘tracking’ or entrainment of beads by any algae (data not shown).
The bacterial isolates, P. haloplanktis and S. putrefaciens, tracked algae at mean distances of 4±3 μm and 6±4 μm, respectively (Table 1 and Fig. 1). The bacteria tracked the algae, on average 1.8±0.4 s for P. haloplanktis and 0.7±0.2 s for S. putrefaciens. Individual bacterial speeds were not constant while tracking the alga but ranged from 5 to 401 μm s−1 for P. haloplanktis and from 9 to 445 μm s−1 for S. putrefaciens (Table 1 and Fig. 2). Bacteria increased their speed and shortened their run length nearly reversing direction at the end of each run with a high number of correct turns toward the tracked algal cell (Table 1 and Fig. 1). The mean turn angle was less and the turns per second were greater for a tracking bacterium than for non-tracking bacteria (Table 1).
Maximum and mean speeds, mean angle of turn, distance from alga, run length and turning frequency for all the tracking and non-tracking bacteria and algae
| N | Mean time tracked (s) | Distance from algal cell (μm) | Mean run length (μm) | Maximum*, and average speed (μm s−1) | Mean turn angle (°) | Turns s−1 | Maximum*, and average correct turns | |
| P. lutheri algal cell | 246 | N/A | N/A | 24 | 176*, 37 (±26) | 86 (±44) | 3 (±4) | N/A |
| P. haloplanktis tracking alga | 569 | 1.2 (.±0.4) | 4 (±3) | 5 (±3) | 401*, 197 (±54) | 47 (±9) | 12 (±5) | 12, 7(±3) |
| S. putrefaciens tracking alga | 156 | 0.7 (±0.2) | 6 (±4) | 5 (±2) | 445*, 186 (±69) | 59 (±6) | 16 (±6) | 8, 5 (±3) |
| S. haloplanktis not tracking alga | 100 | N/A | 52 (±9) | 19 (±16) | 237*, 146 (±44) | 90 (±12) | 6 (±2) | N/A |
| S. putrefaciens not tracking alga | 100 | N/A | 57 (±11) | 18 (±9) | 204*, 103 (±48) | 97 (±19) | 6 (±3) | N/A/ |
| P. haloplanktis without alga | 100 | N/A | N/A | 25 (±13) | 126*, 87 (±24) | 93 (±43) | 4 (±3) | N/A |
| S. putrefaciens without alga | 100 | N/A | N/A | 27 (±11) | 103*, 72 (±24) | 89 (±40) | 3 (±2) | N/A |
N= the total number of run lengths measured. To help define bacterial tracking the maximum and average correct consecutive turns has been given for tracking bacteria, where ‘correct’ refers to turns toward the algal cell path. Values in parentheses are standard deviation calculated from the N of each condition.
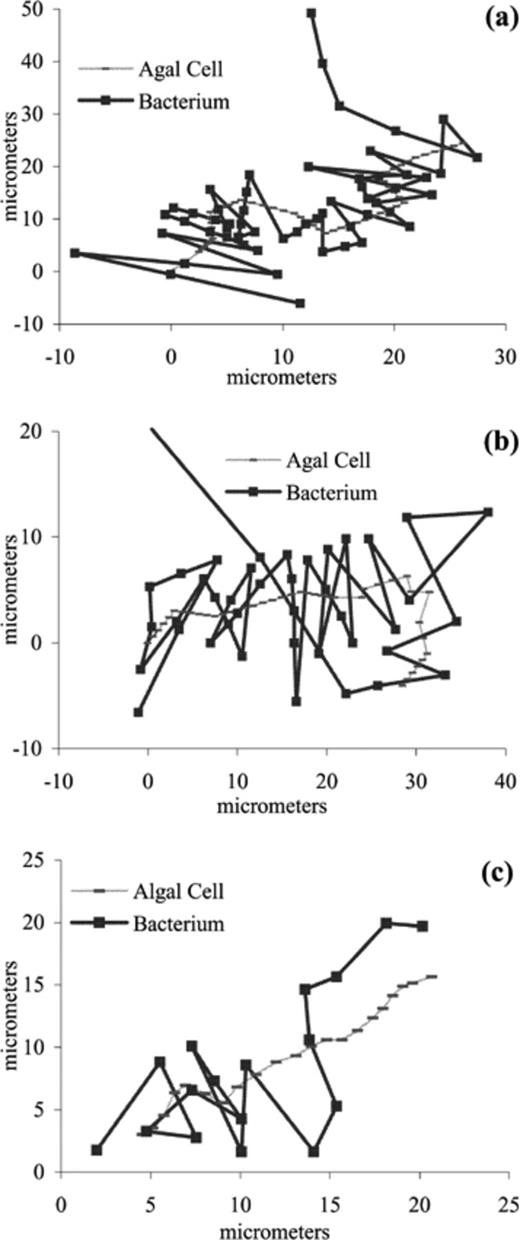
These plots show three of the best bacterial tracking paths of the algae P. lutheri, each track represents the path of individual cells. a,b: Plots of a P. lutheri algal cell tracked by P. haloplanktis bacteria. c: Plot of a P. lutheri algal cell tracked by a S. putrefaciens bacterium. There are no error bars for these plots of algae tracked by bacteria because they are direct tracks of algal and bacterial cell paths. The x,y coordinates are in micrometres. Tracks of the algal cells always start in the bottom left hand corner of each figure, bacterial tracks generally start to the left of the plot but not at the same x,y coordinates as the algal track.

Four bacteria (three P. haloplanktis and one S. putrefaciens) were recorded tracing over old algal swimming paths (ghost paths) (Fig. 3b,c). The bacterial tracings were on average 0.5±0.2 s behind the algal cells, with mean distances of 15±3 μm from algal cells that made the ghost tracks. The speeds of the tracing bacteria were comparable to tracking bacteria, ranging from 29 to 396 μm s−1, with an average speed of 179±84 μm s−1. The cells tracing the ghost paths achieved a maximum of eight consecutive correct turns in a row with an average of 5±2 correct consecutive turns toward the freshest end of the ghost paths. The algal cells that left the ghost tracks had average swimming speeds of 64±30 μm s−1.
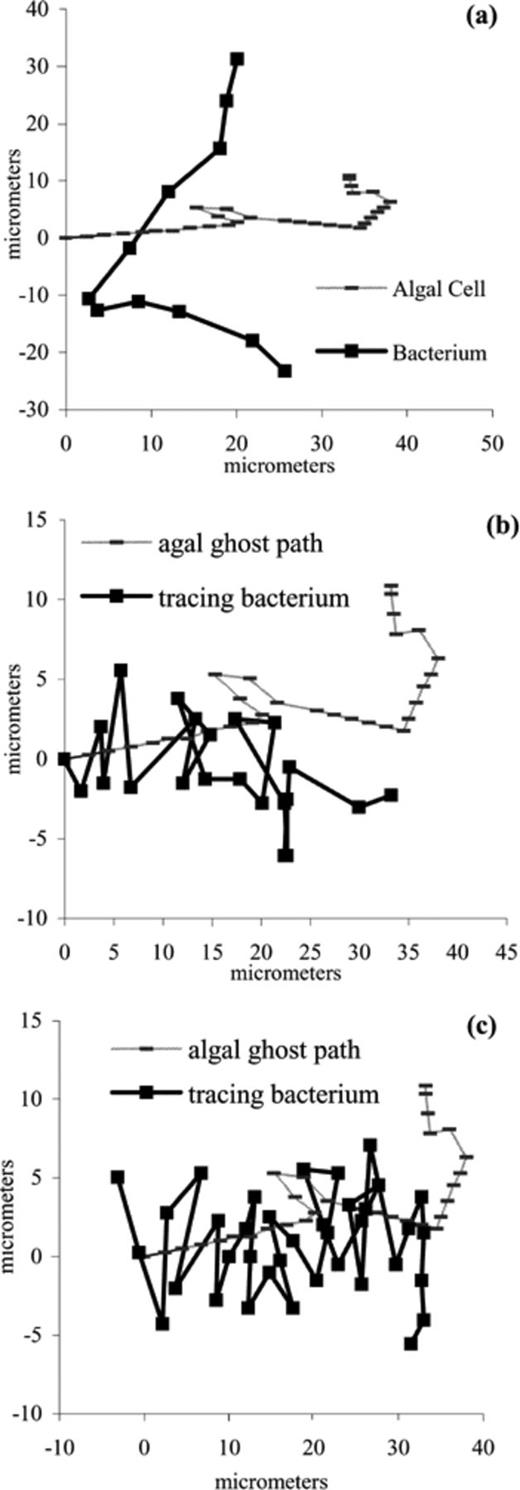
a: A non-tracking bacterium, S. putrefaciens, swimming path that intersects an algal cell path. b,c: P. haloplanktis swimming paths that intersect an old algal cell path (ghost path) after the algal cell has passed.
Bacteria in cell suspensions with algae were also recorded intersecting motile algal swimming paths and not tracking algae (Fig. 3a). Bacteria that were not tracking algae generally had lower average speeds (Table 1), which ranged from 19 to 237 μm s−1. Bacteria that were in suspensions free of algae had even lower speed ranges, 12–126 μm s−1, than bacteria with algae. Two-tailed, unpaired t-tests were performed on the difference in speeds for bacteria with and without algae. The higher speeds of bacteria with algae were found to be significantly different from the speeds of bacteria without algae (P<0.001 for P. haloplanktis and S. putrefaciens). Bacteria not associated with algae also had longer run lengths and lower turning frequencies (Table 1).
4 Discussion
The marine bacterial isolates followed the algae in a non-random manner. The bacterial speeds far exceeded the algal cells’ speeds, with the bacteria over-taking the alga and then reversing to swim back over the algal cell path (Figs. 1 and 2). The motile bacteria are able to track free-swimming individual algal cells (Fig. 1) using high speed, increased turning frequency and high numbers of consecutive turns towards the algae (Table 1 and Fig. 2).
The bacteria actively track the algae, rather than simple entrainment, since tracks of bacteria that crossed algal cell paths were not reoriented toward the swimming algae (Fig. 3a). Additionally, the results from the substitution of 0.8-μm latex beads for bacteria indicated no entrainment of beads by any algae. The presence of the algae caused a significant change in the behaviour of the bacteria, with significantly higher speeds for bacteria regardless of whether they were tracking algae. This suggests that the algae are secreting exudates that act as a general cue to stimulate bacterial motility. These exudates and cues from the algae enabled bacteria, using chemotaxis, to orient and track the algae. In this discussion, we explain how the high speeds and turning frequency allow a bacterium to remain in a specific moving zone in relation to an alga and how the high speed permits a greater sensitivity to chemical gradients. These two features combine to enable tracking of a moving attractant, in this case a motile algal cell, giving the bacteria increased access to algal exudates and thus a possible competitive advantage.
4.1 Tracking control mechanisms. How do they work?
It is generally accepted that bacteria measure chemical changes while moving through spatial gradients of attractants in a biased random walk [25]. Alternating between smooth runs and tumbles that randomly reorient them, the bacteria alter the time between tumbles to extend runs and carry them in a favourable direction [2]. However, traversing gradients of chemoeffectors using a biased random walk, requires multiple runs which would not enable bacteria to precisely position themselves around a point source [3,15]. The standard random walk model does not seem to explain how the marine bacteria tracked the algae at distances approximately 1 run length wide (Table 1 and Fig. 1). The bacteria tracked the motile algae, using the run-reverse strategy which enables them to reverse direction after each stop instead of randomly tumbling, allowing them to react faster to chemical gradients.
Despite the standard chemotactic model appearing to come up short, bacterial tracking can still be explained using some of the same principles described by Purcell [25] since the same two-step measuring mechanism can apply. To show this we estimate the length that a bacterium must travel to make one concentration measurement. The length is L=D/v, where L is the length (or run-length), v is the bacterial velocity and D is molecular diffusivity of water (10−5 cm−2 s−1) [25]. Assuming v=350 μm s−1, within the range measured for the tracking bacteria (see Table 1 and Fig. 2), the length is 3 μm. Turn decisions are assumed to be made from two concentration measurements [15], therefore the calculated tracking distance is 6 μm. This is approximately the same as the average distance maintained between a tracking bacterium and an alga. However, the bacteria do not always travel at the same velocity (Fig. 2), so the required length will change while tracking the algae. The length, however, is short enough to allow the bacteria to make two measurements while tracking to rapidly detect an exudate gradient plume from the algae. Rapid detection, run-reverse strategy and a high turning frequency would enable the bacteria to stay within a small area, however it still does not explain how the bacteria remain with the motile algae. The tracking of the algae was not a standard chemotactic response reliant on the turn frequency of the bacteria, but a more complex response reliant on correctly turning toward the algae.
If bacterial swimming directions were chosen entirely at random one would expect the mean turn angle to be 90° with a standard deviation of 39° allowing for Brownian reorientation [26]. This was the case for the bacteria in the controls and bacteria not tracking algae, suggesting they are capable of tumbling as well as reversing while the bacteria that tracked algae used reversals, producing much smaller angles (Table 1), which helped them to track. However tighter turning angle alone would not result in tracking, bacteria also need to turn toward the algae consecutively in the correct direction.
Turning in the correct direction toward an attractant indicates the bacteria are steering, a behaviour already noted for the sulfur bacterium Thiovulum majus, but in that case steering occurred over distances of millimetres and a turn in either direction was suitable [27]. The bacteria in our study are controlling their direction at the micrometre scale with only one direction being suitable. Since the bacteria are using run and reverse reorientation to target the small (6-μm diameter) moving algae, the directional choice is limited to either toward or away from the algae. Therefore, the probability of a bacterium turning toward an alga consecutively 12 times (Table 1) on chance alone is about 1 in 20 000, showing that, the directional turns of the bacteria are not randomly chosen. Furthermore turning correctly is probably more important than the frequency of turns in enabling bacteria to track the algae. For example the turns s−1 for S. putrefaciens were higher than that of P. haloplanktis, yet S. putrefaciens tracked for less time because it had a lower number of correct consecutive turns toward the algae (Table 1).
4.2 Error sources
While the bacterial tracks were measured directly and plotted as x,y coordinates, the turning frequencies of the bacteria were inferred from the directional change of the bacterial tracks. The variation in turning frequency for the tracking bacteria indicates that some of the bacteria made over 20 turns s−1 (Table 1) which was close to the 24 frames s−1 speed of our VCR. This means that the turning frequency of the tracking bacteria is at least approaching the measurable limits of our experimental set up. Therefore it is likely that some of the positions of the bacterial turns were not recorded accurately due to a phenomena known as aliasing; where the measuring frequency, in this case the frame speed, is similar to the maximum measured frequency, in this case the turning frequency [28]. Therefore the distance travelled by bacteria between frames is underestimated; this impacts on the recorded turn angle and the bacterial speed. Since the x,y coordinates taken of the bacterial paths would not have captured the entire bacterial path, the real speeds must be greater than we measured (see Fig. 5). The real turning angle will have been overestimated since the measured paths were shorter (Fig. 5). Since bacterial speed is greater than measured, this implies that the minimum length a bacterium must travel to make a comparative concentration measure is shorter than our calculated 6 μm. Without higher speed cameras we cannot say precisely how fast the bacteria are tracking the algae.
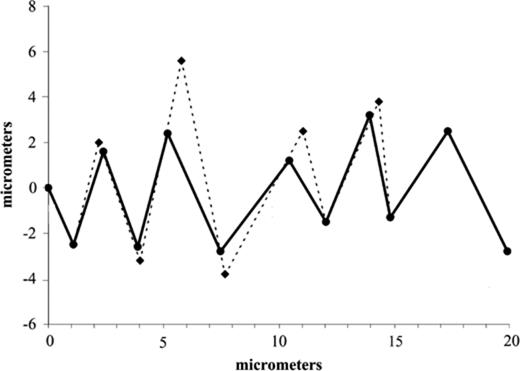
An idealised tracked where the time interval between points is equal, showing how aliasing would overestimate the turning angle and underestimate the speed of a tracking bacterium. The solid line is the measured cell path of the bacteria while the dashed line represents the real bacterial cell path missed due to the measuring frequency (e.g. frames s−1) being too large.
Additional sources of error come from our inability to observe the bacterial swimming three-dimensionally and only recorded the x and y coordinates of the bacterial and algal swim paths. We do not discount the z-axis since cells were moving through all three dimensions, however the run-reverse behaviour of the bacteria involves the bacteria controlling their movement predominantly within a two-dimensional plane, albeit horizontally x–y or vertically z–y or z–x. Therefore we believe that the recorded trajectories of bacteria moving through the x–y plane were relatively accurate. The limited focal depth of the x–y introduced another error source since we measured predominantly at the mid-depth of the chamber yet the microscope chamber we used was ∼100 μm. Therefore it is likely that we were only observing a fraction of the tracking behaviour and recorded tracks would be an underestimate of the real number of tracking bacteria.
4.3 Reasons to track
There are two ways for bacteria to increase nutrient uptake rate, move into a region of high nutrients or by swimming fast enough to increase diffusive flux, here the tracking bacteria do both. Berg and Purcell [3] proposed that increased speed could provide an increase in molecular uptake for the bacterial cell, superior to that of diffusion alone, provided the bacterium could sink or swim fast enough through the water. The nutrient-depleted fluid close to the surface of the swimming bacteria would be replaced faster than if they remained motionless. This quicker renewal of molecules increases the nutrient gradients near the cell, which in turn increases the rate of nutrient diffusion flux toward the cell [29]. The idea that tracking bacteria may be increasing their diffusive flux and thus enhancing molecular uptake by swimming around the motile algal cell is tempting. However this has been thought to be unlikely based on calculations from the low speeds recorded for bacteria such as E. coli[17].
Here we calculated the increase in diffusive flux for the tracking bacteria from the non-dimensional variable av/D where a is the radius of the bacterium, v is velocity and D is molecular diffusivity [3]. From our data of a bacterium tracking an alga, a=0.5 μm, again assuming v=350 μm s−1, (see Table 1 and Fig. 2), and using a standard value of 10−5 cm−2 s−1 for D, av/D=0.2. Taking into account that our speed measurements are underestimates of the bacterial speeds, the percentage increase in diffusive flux would be at least 30%, (fig. 4 in [3]) thus significantly increasing the nutrient or material acquisition of the tracking bacteria. However this estimate of the increase in diffusive flux does not necessarily relate directly to the molecular uptake rate of the bacteria, since Berg and Purcell [3] were assuming a swimming cell moving through an environment with a homogenous nutrient concentration. The bacterial tracking of motile algae is an environment of steep nutrient gradients, where chemotaxis is used to detect changes in concentration at different places or times along the algal trail.
The 30% increase in diffusive flux is only a conservative estimate of the nutrient gain received by tracking bacteria. Studies of bacterial uptake rates have shown that estimations of nutrient transfer from models are often underestimates of real uptake rates [30,31]. This is likely due to physical models oversimplifying the combined effects of physical and biochemical processes involved in nutrient uptake by marine bacteria.
The tracking bacteria show evidence for physical and biochemical coupling to increase their nutrient uptake. By slowing down as they approach the algae and speeding up as they get further away (Fig. 2) the bacteria control their diffusivity toward the algae (Fig. 4). The control in diffusivity allows the bacteria to take advantage of the high nutrient levels close to algae and increase uptake rates at the edges of the gradient plume using the higher speeds to increase diffusive flux. The diffusivity of tracking bacteria fit within a narrow envelope where the diffusivity range (speeds) a bacterium can have, narrows with greater distance from the tracked alga. As the bacteria increase their tracking distance they must use increasing control of their speed and turning or risk losing the motile algae. A small group of bacteria in Fig. 4a show a distinct drop off in their diffusivity, as they exceed 14 μm from the algae, these values directly relate to points in tracks when bacteria stopped tracking algae, indicating that there is a limit to the distance that bacteria can reach before they are no longer able to successfully track motile algae. No such drop off was observed for S. putrefaciens, but this may be due to the small number of tracks recorded for this species.
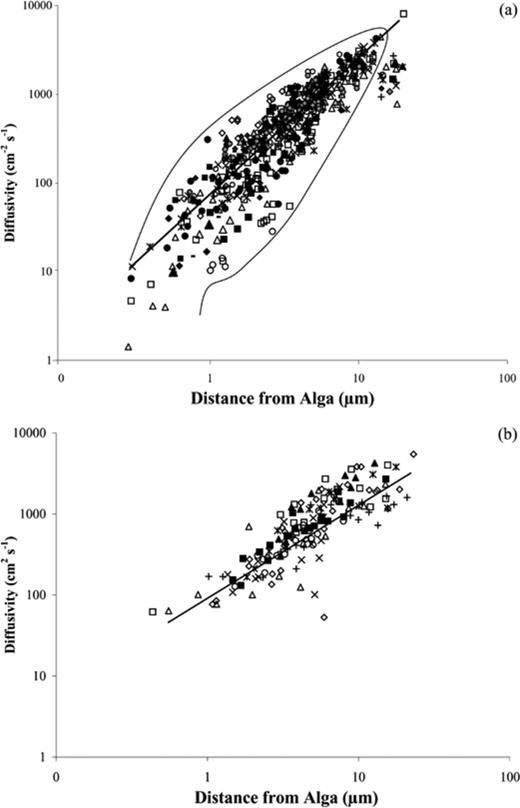
Diffusivity of the bacterial cells toward the tracked algal cells versus distance of the bacteria from the algal cells for a: P. haloplanktis (y=65.6×1.55, R2=0.77, n=569) and b: S. putrefaciens (y=109.6×1.16, R2=0.69, n=156). Note, n is the number of runs recorded and points with the same symbols representing all of the runs of an individual bacterium. This shows that the individual bacteria were altering their Diffusivity during their tracking (diffusivity was calculated by multiplying the speed and distance of a bacterium from a tracked alga).
The tight control of the bacterial diffusivity toward the motile algae could provide tracking bacteria with a competitive advantage over non-tracking bacteria. Since motility is one of the largest genetic loads most bacteria possess [32] there would be strong selection for any energetic gain provided by a competitive motility strategy. Bacteria with superior chemotaxis and motility properties have been shown to out-compete cells with higher growth rates [33,34] with generation growth rate increases as low as 0.04% giving a significant advantage to bacteria in mixed cultures [35]. Therefore the ∼30% diffusive flux gained from the speed increase for bacteria that track algal signals could provide a significant competitive advantage over that of bacteria not associated with algae. This may explain why the bacteria in samples with algae had a general speed increase due to the nutrient gain from the algae.
4.4 How long can bacteria track the signal?
The ability of bacteria to trace an algal signal approximately half a second after an algal cell had past through a region, was recorded for bacterial tracks of ghost paths (Fig. 3b,c), suggesting that the bacteria are responding to a chemical trail or discrete exudate left behind by the algal cells. This phenomena of bacterial tracing was similar to that of the tracking bacteria with comparable speeds, turn angles and correct consecutive turns (Table 1) indicating that the bacteria were responding to the same type of signal. This implies that the algae were leaving discrete exudate signals, stimulating the general speed increase seen for bacteria in samples with algae.
4.5 Tracking in the pelagic environment
It is likely that the bacterial tracking of algae in the pelagic environment is an intermittent phenomenon that is a response to discrete algal cues. Recent findings showed that over 60% of marine bacteria have the potential to be motile but for only a few seconds at a time [36]. It may be that most marine bacteria can track algae under the right conditions, such as lysing phytoplankton blooms or discrete point-source releases of nutrients. Tracking by bacteria of single algae may also help to explain how marine bacteria associate with other free-floating or sinking particles in the open ocean, such as marine snow [37,38].
Increased nutrient uptake rates of bacteria attached to aggregates and marine snow over uptake rates of freely dispersed bacteria has been well documented [37–39]. However there are discrepancies in the current knowledge of known bacterial uptake rates and measured carbon turnover for total pelagic bacteria [38,39]. The nutrient uptake rate of bacteria tracking phytoplankton could be greater than freely dispersed bacteria not associated with nutrient sources. Therefore nutrient turnover by bacteria that track may play a pivotal role in adding to the rapid transfer of consumed dissolved nutrients into the food web. This suggests that while chemotaxis has been important for elucidating complex protein signalling pathways, chemotaxis may also be important in mediating nutrient exchange between phytoplankton and bacteria.
Acknowledgements
This work was supported by ARC (Australian Research Council) and the Flinders University of South Australia. We also thank V. Mirabelli, Dr. Bob Belas and an anonymous reviewer for their constructive criticism on an earlier version of this manuscript.
References
