


Abstract
Quantitative models of bacterial conjugation are useful tools in environmental risk assessment and in studies of the ecology and evolution of bacterial communities. We constructed a mathematical model for gene transfer between bacteria growing on a solid surface. The model considers that donor and recipient cells will form separate colonies, which grow exponentially until nutrient exhaustion. Conjugation occurs when donor and recipient colonies meet, all recipient cells becoming transconjugants instantly, after which they act as donors. The model was tested theoretically by computer simulations that followed the histories of individual bacterial colonies and was validated for initial surface coverage of 60% or less, where confluent growth does not occur. Model predictions of final number of donors, recipients and transconjugants were tested experimentally using a filter mating system with two isogenic strains of Pseudomonas fluorescens MON787 acting as donor and recipient of plasmid RP4. Experimental trends resulting from varying donor and recipient inoculum numbers and donor:recipient ratios were well described by the model, although it often overestimated conjugation by 0.5–2 orders of magnitude. Predictions were greatly improved, generally to within half a log unit of experimental values, by consideration of the time for conjugative transfer. The model demonstrates the relationship between spatial separation of cells and nutrient availability on numbers of transconjugants. By providing a mechanistic approach to the study conjugation on surfaces, the model may contribute to the study of gene transfer in natural environments.
1 Introduction
Interest in gene transfer in natural environments has increased through the need for assessment of risks following environmental release of genetically modified microorganisms (GMM). Gene transfer within natural microbial populations is also of intrinsic importance to our understanding of metabolic and physiological plasticity within microbial communities [1].
Genetic material may be transferred between bacteria by conjugation, transduction or transformation but conjugation has been studied most extensively [2–7]. Most gene transfer studies have provided values for frequencies of gene transfer, under a range of environmental conditions, by dividing the number of transconjugants by either number of recipients or donors. Very few studies have attempted to integrate experimental findings into mathematical models of conjugation. Published models of conjugal gene transfer in terrestrial environments [8,9] are based on the mass action model of Levin et al. [10], which describes plasmid transfer in well-mixed homogeneous suspensions of microbial cells in liquid culture such as in chemostats. Plasmid transfer is assumed to depend on random encounters between donor cells (including transconjugants) and recipients, and the production of new transconjugants during a particular time interval is related directly to the number of donors and recipients. The model incorporates a constant of proportionality, the plasmid transfer rate constant, which defines the capacity of a plasmid for transfer, termed ‘fertility’[10]. The constant therefore expresses the probability of gene transfer when cells come into contact, which will depend on factors such as cell activity and expression of transfer (tra) genes.
The original model of Levin et al. [10] considered exponential growth of donor and recipient populations at constant specific rates. Knudsen et al. [9] extended the model to account for exponential growth or decline of donor and recipient populations. Clewlow et al. [8] applied Levin's model to gene transfer in streptomycetes by using the logistic equation for population growth and taking account of the more complex life cycle of these organisms.
Levin et al. [10] acknowledged that their model is not applicable to heterogeneous environments where the distribution of donors and recipient populations may be ‘patchy’ and none of the subsequent modifications to their model specifically considers spatial separation of cells, which is likely to be an important factor controlling gene transfer in the soil and in biofilms in aquatic environments. Although the predictions of the above models were supported by experimental studies, the experimental design eliminated effects of spatial separation by use of high cell inocula, which will produce transfer frequencies equivalent to those in liquid culture. Simonsen [11] demonstrated experimentally that gene transfer in populations growing on surfaces, unlike that of cells suspended in liquid medium, is particularly dependent on the initial number of donor and recipient cells. During growth in liquid culture, the rate of appearance of transconjugants is dependent on the donor:recipient cell ratio but the final number of transconjugants is independent of numbers of donors and recipients [11]. More recently, Licht et al. [12] have shown that in vivo studies of plasmid transfer in the intestine of streptomycin-treated mice did not display the kinetics of mixed liquid-flow system, due to bacteria retaining fixed positions.
Here, we formulate a theoretical model for plasmid transfer that addresses the spatial separation and growth of cells on solid surfaces. The model was validated by computer simulation experiments. Model predictions of the final number of donors, recipients and transconjugants were then tested against data obtained from an experimental model system involving cell growth and gene transfer on the surface of membrane filters, placed on Luria–Bertani (LB) agar medium. The model parameters required for predictions are: the total area available for colonisation, the initial colony radius, the specific growth rate, colony radial specific growth rate and finally the maximum number of cells sustained by the system. The model is applicable to situations where cells are fixed spatially and where values of the model parameters can be determined. The present model provides a new theoretical framework for the study of gene transfer on solid surfaces.
2 Materials and methods
2.1 Development of the mathematical model
2.1.1 Basic assumptions
Gene transfer on a planar surface may be modelled using the following simplifying assumptions:
Following inoculation, cells are distributed randomly on the agar or filter surface.
Each cell is viable and grows to form a circular colony, which increases exponentially in radius at a specific rate gr. The number of cells in the colony also grows exponentially at rate gn, until one or more components of the medium are exhausted. These assumptions are acceptable until growth at the centre of colonies becomes limited by diffusion of nutrients from areas of nutrient richness, although this will have negligible effect on colony growth rate (gr), if initial nutrient concentration is significantly greater than the saturation constant for growth.
Donors, recipients and transconjugants have identical specific growth rates (gn), colony radial specific growth rates (gr), and cell yields (N) on solidified LB medium.
When colonies of donor (or transconjugant) and recipient cells come into contact, conjugation occurs such that all cells in a recipient colony become transconjugants after a conjugation time (tconj). We initially developed our model with tconj=0 to give instantaneous conjugation.
Plasmid loss is negligible.
Cells do not move across the surface, except through colony expansion.
2.1.2 Spatial distribution of bacteria
2.1.3 Growth of colonies
We assume that the radius of colonies increases exponentially at rate gr, over the time period of interest. Hence the radius at time t is r0egrt where r0 is the initial radius. We assume that the number of bacteria in a colony also increases exponentially with rate gn so that the number of bacteria (Nt) in a colony at time t is egnt. We further assume that there is a maximum yield of cells (Nmax) and that growth stops when the total number of cells on a filter reaches Nmax.
2.1.4 Establishment of contact between colonies

2.1.5 Conjugation
For conjugation to occur, colonies of donor (or transconjugant) cells must come into contact with recipient cells, i.e. they must be in the same clump. Consider a colony chosen at random from the filter. For it to be a recipient at time t, it must originally have been a recipient and must be in a clump where all colonies are also recipients. The probability that a bacterium is originally a recipient is Nr/(Nd+Nr), so that the probability that all colonies are recipients in a clump of size n is {Nr/(Nd+Nr)}n.

2.1.6 Final cell numbers

2.1.7 Constants required by the mathematical model
The model parameters required for predictions of final number of donors, recipients and transconjugants are: the surface area available for colonisation (A), initial colony radius (r0), specific growth rate (gn), colony radial specific growth rate (gr), maximum number of cells sustained by the system (Nmax), and the initial number of donors (Nd) and recipients (Nr). Their values were determined experimentally for our conjugation system and are given in Table 1.
Parameters required by the mathematical model
| Parametera | Medium | ||||||
| 100% LB/LB agar | 30% LB | 3% LB | 1.5% LB | 0.6% LB | 0.3% LB | 0.1% LB | |
| gn (cells h−1) | 0.797 | 0.797 | 0.643 | 0.550 | 0.535 | 0.445 | 0.341 |
| gr (μm h−1) | 0.389 | 0.389 | 0.384 | 0.341 | 0.317 | 0.315 | 0.291 |
| Nmax (cells) | 1×10¹⁰ | 1.4×10⁹ | 1.8×10⁸ | 1.8×10⁸ | 1.7×10⁸ | 6.6×10⁷ | 1.5×10⁷ |
Values were determined experimentally for filters incubated over LB agar or floated over different strengths of LB broth.
agn, maximum specific growth rate; gr, maximum colony radial growth rate; Nmax, maximum cell yield. Surface area for colonisation (A) and initial colony radius (r0), were the same for all media and their values are 1.77×108μm2 and 0.5 μm, respectively.
2.1.8 Modelling conjugation time
When conjugation is not instantaneous exact solutions are not available. We approximate this by assuming that no conjugation takes place for time tconj after colonies have met. The model computations are similar to before, but now using t=teff−tconj in our calculations of p1. This approximation was tested against computer simulation experiments that followed the full history of bacterial colonies.
2.2 Simulation experiments
Computer simulation experiments that followed the development and conjugation histories of all bacterial colonies were performed to test the limits of the approximation by Roach [14] that gave Eq. 2. A large number of surfaces were simulated with circular colonies placed randomly from a two-dimensional Poisson process [13], and the numbers of clumps of different sizes recorded. These simulations were performed 1000 times with intensities (number of colonies per unit area) equivalent to the laboratory experiments. Computer experiments were performed over an area equivalent to 10% of the area used for experimental studies, to allow simulations to finish in a reasonable time. A further simulation experiment was performed to test the model approximation with non-instantaneous conjugation. Simulation programmes were written in the C++ computer language and are available on the author's website (http://www.maths.abdn.ac.uk/~ijw).
2.3 Bacterial strains and culture conditions
Pseudomonas fluorescens MON787 pRP4 was the donor strain and the recipient strain was a luxAB-marked, rifampicin-resistant (100 μg ml−1) mutant of P. fluorescens MON787, designated as P. fluorescens MON787 R lux. Reversion rates were negligible. Strains were cultured in LB broth (tryptone, 10 g; NaCl, 10 g; yeast extract, 5 g; distilled water, 1 l), supplemented with 50 μg ml−1 kanamycin (donors) or 100 μg ml−1 rifampicin (recipients), at 30°C and with shaking at 175 rpm. LB agar consisted of LB broth solidified by addition of 1.5% (w/v) Bacteriological agar No.1 (Oxoid, Basingstoke, UK). Non-motile strains of P. fluorescens MON787 RP4 were obtained by mini-Tn5 transposon mutagenesis, using Escherichia coli SM10 (λpir) pUT for delivery of the transposon [15]. Non-motile P. fluorescens MON787 R lux (recipient) were obtained by EMS mutagenesis [16]. Non-motile mutants were selected by their reduced spreading on semisolid L-agar plates (0.1 strength L-broth, 0.3% w/v Bacteriological agar No.1) after 72 h incubation at 30°C. Lack of motility was confirmed by microscopic observation and no revertants were observed after five serial subcultures in LB broth. The mutant strains obtained were also tested for maintenance of the parental growth rate and resistance/sensitivity to antibiotics.
2.4 Experimental system for plasmid transfer
Plasmid transfer experiments were carried out in triplicate on 0.22-μm pore size, Nuclepore filters (Whatman, Maidstone, UK) placed on the surface of agar medium. Donor and recipient cells were grown for 12 h until A600=1. Cells were centrifuged (4500×g, 5 min), washed twice in 0.85% (w/v) NaCl, and resuspended in 0.85% (w/v) NaCl. The required range of cell concentrations was obtained by dilution in 0.85% (w/v) NaCl. Triplicate filters were inoculated by sequential filtration of 0.5 ml of recipient and donor cell suspensions. Filters were placed on LB agar containing no antibiotics, with the inoculated side facing up. The surface area available for colonisation was defined by the 1.5 cm internal diameter of the filtration unit. Filters were removed after 9 h incubation at 30°C and cells were resuspended by vortexing filters for 30 s in 9 ml of 0.85% (w/v) NaCl. Cell numbers were determined by plating (10 μl) dilutions of cell suspensions in 0.85% (w/v) NaCl, onto LB agar. Identification of the donor or the recipient strain was achieved with 50 μg ml−1 kanamycin or 100 μg ml−1 rifampicin, respectively. Transconjugants were identified by growth on medium containing both antibiotics at these concentrations. Colonies were counted after incubation for 48 h. To increase detection levels for low cell numbers, 400 μl of the cell suspension was plated. The experimental detection limit was 2.5 cells ml−1 or 22.5 cells per filter.
Frequency of spontaneous mutants was determined by filtering either P. fluorescens MON787 pRP4 or P. fluorescens MON787 R lux in monoculture and plating out on rifampicin- and on kanamycin-supplemented LB agar. The frequency of mutation of P. fluorescens MON787 pRP4 to resistance to 100 μg ml−1 rifampicin was 10−7–10−8, and had no significant effect on results. Kanamycin-resistant mutants of P. fluorescens MON787 R lux were never detected. The rate of plasmid transfer occurring during resuspension of cells from filters and plating was determined by inoculation of donor and recipient cells onto separate filters and combined resuspension of filters immediately before viable cell enumeration. Conjugation occurring during resuspension of cells and plate counting never accounted for more than 2.8% of final transconjugant numbers. Plasmid loss was not detected during incubation of the donor strain in the presence and absence of kanamycin.
2.5 Experimental determination of model parameters and test of model assumptions
In pilot experiments, similar specific growth rates were found in batch culture and on filters (P>0.05). Therefore, we determined specific growth rates in batch cultures of each strain. Triplicate 250 ml Erlenmeyer flasks containing 100 ml of LB broth (or different dilutions of LB in NaCl 0.85%) were inoculated with 1 ml of an overnight culture, washed twice in fresh medium, and incubated at 30°C with shaking (175 rpm). The flasks were sampled at hourly intervals to determine OD600 and to estimate cell numbers by plating.
Colony radial specific growth rates were determined for colonies growing on black Nuclepore filters, placed on LB agar at 30°C or floated over different dilutions of LB broth. Filters were inoculated with approximately 1×10⁵ cells from an overnight culture and incubated for up to 10 h. At 90 min intervals, two filters were stained with 0.01% (w/v) acridine orange (AO) [17] and the colony diameter measured by microscopy. Between 30 and 100 colonies were measured for each filter at each time.
The maximum cell yield corresponds to the maximum number of cells reached in the experimental system. The stipulated initial colony radius was half the cross section of a cell.
Distances between AO-stained cells [17] inoculated onto black Nuclepore filters (Whatman), were measured using an Olympus BH-2 fluorescence microscope and an eyepiece micrometer.
2.6 Statistical methods
Statistical analysis was carried out using the Minitab statistical package (Release 10, Windows™), with a level of significance of 0.05. Growth rates were compared by analysis of covariance (ANCOVA) [18]. Model and experimental intercellular distances were compared using chi-squared goodness of fit tests. Each conjugation experiment was carried out in triplicate and results are presented as the mean total numbers of donors, recipients or transconjugants per filter. Error bars represent the 95% confidence intervals.
3 Results
3.1 Validation of the experimental system – test of model assumptions
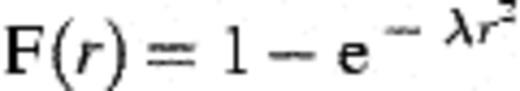
The model assumes that the position of cells follows a Poisson process, so that intracellular distances have a distribution function given by Eq. 1 above. Comparisons with experimental distances revealed no significant deviation from this model (Fig. 1). Experimentally determined cell numbers and colony radius increased exponentially during the 9 h incubation period. Specific growth rates, as well as colony radial specific growth rates, were not significantly different between the donor and recipient strains (P>0.05) and the average values for each growth rate were used as model constants (Table 1).
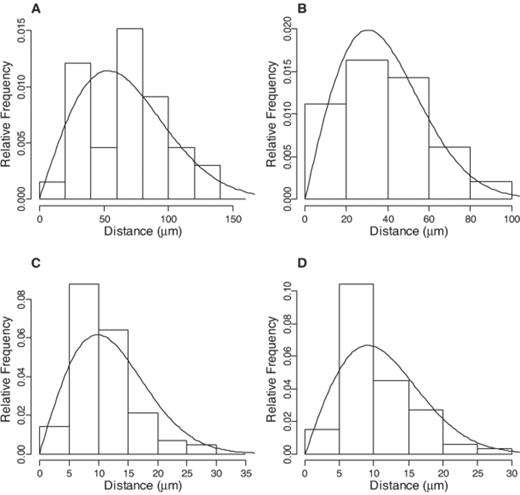
Experimental intercellular distances (bars) and density functions predicted by the model (lines) for intensities of (cells μm−2): 0.06×10⁻³ (A), 0.17×10⁻³ (B), 1.92×10⁻³ (C) and 1.65×10⁻³ (D). n=33, 49, 67 and 84 respectively. Chi-square tests indicated that experimental and model distances did not differ significantly (P>0.05).
The influence of motility on colony expansion and conjugation was assessed by comparing changes in colony diameter and plasmid transfer using the P. fluorescens MON787 system and non-motile mutants of the donor and recipient strains. Rates of colony expansion or changes in donor, recipient or transconjugant numbers were not significantly different (P>0.05, data not shown). Therefore, motility effects were considered to be negligible for our experimental system.
3.2 Model testing 1: comparison of computer simulation experiments and model predictions
Computer simulations of bacterial colonies developing on filters were carried out to test model predictions concerning establishment of contact between colonies (clumping) and conjugation. The approximation defining the probability of clumps of n colonies occurring (Eq. 2) was good when the number of colonies per unit area was low (low λ), so that the mean clump size was small, i.e. less than five (Table 2). Simulations gave a larger probability of single colonies because of the finite area (colonies at the edge can have no neighbours on one side). The theoretical mean clump sizes were accurate for low λ, but as λ increased the theoretical mean clump size and the simulation results differed. The approximation worked well for values of λ up to 0.2, when the area of discs is 60% of the area of the surface. In our experimental system, this corresponds to inocula lower than 1.8×10⁷ cells per filter, which was generally the case, except for the highest inoculum levels in experiments 1–5 (see Section 3.3).
Comparison of clump size estimates (i.e. number of colonies that are meeting at a certain time) using the model approximate theory against those obtained by computer simulation experiments
| Intensitya (λ) | Probability of colony in clump of size one | Mean clump size | ||
| Theory | Simulation | Theory | Simulation | |
| 0.01 | 0.882 | 0.882 | 1.07 | 1.07 |
| 0.02 | 0.778 | 0.780 | 1.14 | 1.13 |
| 0.05 | 0.533 | 0.537 | 1.39 | 1.38 |
| 0.1 | 0.285 | 0.292 | 2.00 | 1.94 |
| 0.2 | 0.0810 | 0.0966 | 4.51 | 3.95 |
| 0.5 | 0.00187 | 0.00821 | 85.1 | 74.5 |
Results are based on hypothetical colonies of unit radius placed on a filter with radius 150. Simulation results are based on 1000 replicates.
aThe number of colonies per unit area in a Poisson distribution.
When the assumption of instantaneous conjugation was dropped, predictions from the mathematical model agreed with results from computer simulation experiments when the intensity was very low (λ<0.1), and gave qualitatively similar results with λ between 0.1 and 0.2. When λ=0.2 the predicted number of transconjugants overestimated simulated results by about 15%.
3.3 Model testing 2: laboratory experimental testing of model predictions
Model predictions of final donors, recipients and transconjugants were obtained for varying donor and recipient inoculum sizes and initial nutrient concentration, using the model parameter values given in Table 1. We tested these predictions against final donor, recipient and transconjugant numbers in the experimental system, over a range of inoculum concentrations (Figs. 2–4). Each set of conditions was triplicated and values are presented as means from triplicates with associated 95% confidence intervals. We use the term ‘accurate’ for predictions that fall within the 95% confidence limits of experimental data. When transconjugant cell numbers approached or exceeded those of one of the parental strains, the transconjugants grew on rifampicin- or on kanamycin-supplemented media to levels that masked those of the parental strains. When this was the case, no experimental values for recipient or donor cells were presented in figures and, for simplicity, the respective predicted values were also omitted from figures.
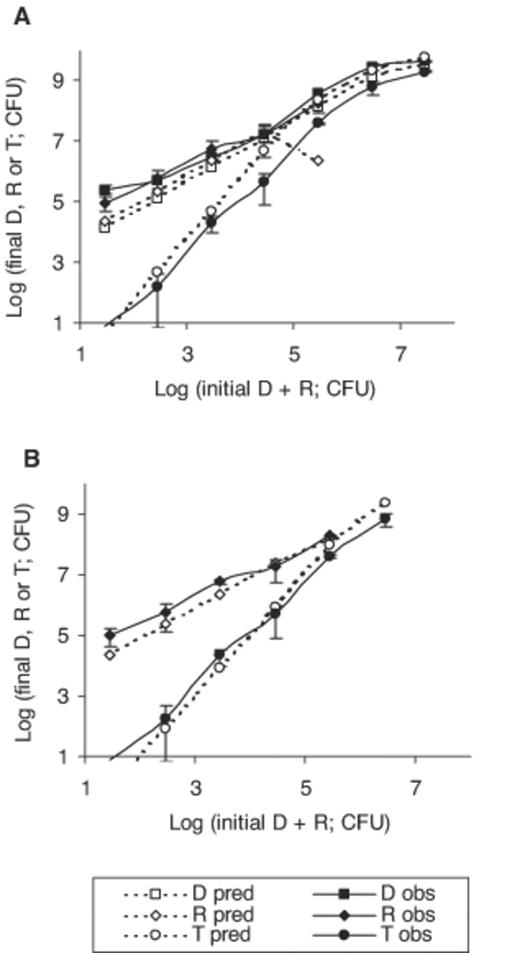
Predicted (pred) and experimental (obs) numbers of donors (D), recipients (R,) and transconjugants (T) following inoculation with similar numbers of donors and recipients in the range log 1.03–7.03 for donors and log 1.24–7.24 for recipients. Triplicate Nuclepore filters were incubated over LB agar, at 30°C, for 9 h. Error bars represent 95% confidence limits for experimental data. The experimental detection limit was log 1.35 (CFU). Model predictions for instantaneous conjugation (A) and for conjugation occurring after 2.25 h of contact (B). Donor predictions remain unchanged and are not presented again in panel B.
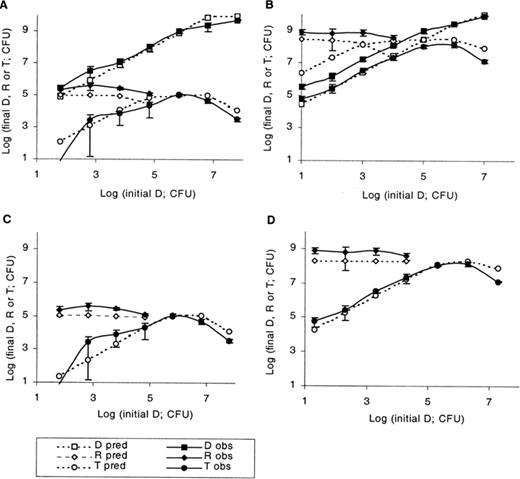
Predicted and experimental final numbers of donors, recipients and transconjugants for initial donor numbers varied from log 1.77 to 7.77 and initial recipient numbers kept constant at log 1.86, with instantaneous conjugation (A) or conjugation occurring after 2.25 h of contact (C); initial donor numbers varied from log 1.32 to 7.32 and initial recipient numbers kept constant at log 5.2, with instantaneous conjugation (B) or conjugation occurring after 2.25 h of contact (D). Donor predictions remain unchanged and are not presented again in panels B and D. Symbols, error bars, experimental details as described in Fig. 2.
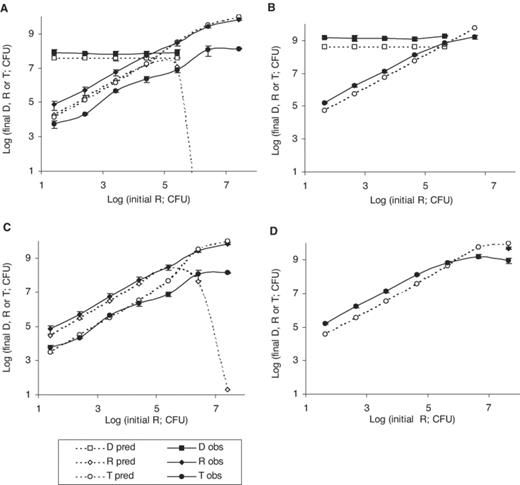
Predicted and experimental final numbers of donors, recipients and transconjugants for initial recipient numbers varied from log 1.41 to 7.41 and initial donor numbers kept constant at log 4.47, with instantaneous conjugation (A) or conjugation occurring after 2.25 h of contact (C); and initial recipient numbers varied from log 1.64 to 7.64 and initial donor numbers kept constant at log 5.48, with instantaneous conjugation (B) or conjugation occurring after 2.25 h of contact (D). Donor predictions remain unchanged and are not presented again in panels B and D. Symbols, error bars, experimental details as described in Fig. 2.
In experiment 1 we inoculated similar numbers of donor and recipient cells on filters (range 1.08×101–1.08×10⁷ donor and 1.75 ×101–1.75×10⁷ recipient cells). Final donor cell numbers were generally predicted accurately, increasing with inoculum size to a maximum value, equivalent to the maximum yield, following complete nutrient utilisation (Fig. 2A). Predicted final recipient cell numbers were close to experimental numbers until an inoculum of 2.78×10⁴ cells, after which the model predicts a decline in recipient numbers due to considering that these are being converted to transconjugants. However, experimental recipient numbers were two orders of magnitude greater than predicted for an inoculum of 2.78×10⁵, indicating an overestimation of conjugation by the model. At the lowest inoculum level (2.78×101), the predicted number of transconjugants was below the level of detection of the experimental system (2.25×101). For inoculum levels greater than 2.78×10³, predicted transconjugant numbers were greater than those detected experimentally, confirming overestimation of conjugation by the model. Nevertheless, the rate of change in transconjugant numbers with increasing inoculum size followed that of the experimental system closely. Transconjugant numbers increased at a greater rate than donor cells, due to combined effects of plasmid acquisition and growth.
Experiments 2 and 3 investigated increasing donor:recipient inoculum ratio at constant initial recipient cell number. In experiment 2 (Fig. 3A), donor inocula were varied from 5.87×101 to 5.87×10⁷ and recipient inocula were 7.28×101 cells. Donor predictions were accurate and recipient predictions were generally an underestimation by half a log unit. Predicted transconjugant numbers followed the experimental trends closely, but those for donor inocula of 5.87×101, 5.87×10⁴ and 5.87×10⁷ were overestimated by half a log unit. As donor inoculum size increased, conjugation increased, due to greater numbers of encounters between donor and recipient colonies within the incubation period and prior to complete nutrient utilisation. Maximum conjugation in the experimental system occurred with a donor inoculum of 5.87×10⁵. At higher inocula, conjugation was reduced due to earlier nutrient exhaustion by the higher number of donor cells. This decline is also predicted by the model.
In experiment 3 initial donors were varied from 2.1×101 to 2.1×10⁷ and the recipients kept constant at a higher inoculum (1.58×10⁵) (Fig. 3B). The model underestimated donor numbers by 0.3–0.9 of a log unit and a decline is predicted for recipient numbers for donor inocula greater than 2.1×10³, which is not observed experimentally. The model overestimated transconjugant numbers, the discrepancy between model and experimental results varying between 0.2 and 1.7 of a log unit and being greater for lower donor inocula. Underestimation of recipients results from the overestimation of conjugation. Underestimation of donors seems to indicate a faster growth rate in the experimental system. When the 95% upper confidence limit for the population growth rate (0.924 cells h−1) was used, donor predictions matched experimental data (data not shown). Experimental transconjugant numbers peaked at a donor inoculum of 2.1×10⁵–2.1×10⁶ followed by a decrease for the highest inoculum, as predicted by the model and explained in the previous paragraph.
Increasing recipient:donor ratios at constant donor inoculum was studied in experiments 4 and 5. In experiment 4 (Fig. 4A), initial donor numbers were 2.95×10⁴ and recipients were varied from 2.6× 101 to 2.6×10⁷. Donor numbers were predicted accurately. In the experimental system, final donors could not be distinguished from transconjugants at recipient inocula greater than 2.6×10⁵. Likewise, predicted donor numbers for these initial conditions were lower than predicted transconjugants (not shown). Changes in final recipients were accurately predicted until a recipient inoculum of 2.6×10⁴, above which predicted recipients declined due to predicted extensive conjugation. In the experimental system, however, recipients continued to be detected, indicating lower levels of conjugation. Predicted transconjugant numbers were an overestimation by 0.3–1.8 log units, but followed the general experimental trend, increasing with increasing proportions of recipients.
In experiment 5 (Fig. 4B), initial donor numbers were 3.07×10⁵ and recipients were varied from 4.37×101 to 4.37×10⁷. Donor numbers were in general underestimated by the model by 0.5 log unit; however, if the 95% upper confidence limit for the population growth rate (0.924 cells h−1) was used, donor predictions were accurate (data not shown). Transconjugant numbers were slightly underestimated (by less than 0.5 log unit) by the model until a recipient inoculum of 4.37×10⁵, beyond which they were overestimated by 0.5–1 log unit. Final recipient numbers could not be determined experimentally, except for the highest inoculum (4.37×10⁷), when they were present at a very high level and the model predicts that all would have become transconjugants. This confirms overestimation of conjugation at high initial cell numbers.
The effects of nutrient concentration on conjugation were examined by floating triplicate filters, inoculated with 3.98×10⁵ donor and 5.01×10⁵ recipient cells, on LB broth, or different dilutions of LB broth in 0.85% (w/v) NaCl, for 9 h at 30°C (experiment 6, Fig. 5A). No transconjugants were found in the liquid medium beneath floating filters at the end of the experiment, except for 0.6% LB broth, where they constituted 0.065% of the total number of transconjugants. Transconjugants arising from conjugation events in resuspension media and on plates during incubation were less than 2.5% of total numbers. The values for parameters used in the model were given in Table 1. The lowest level of nutrient supported both cell growth and conjugation in the experimental system. Increasing nutrient concentration led to increasing cell numbers as nutrients were exhausted later, increasing total colony expansion and the number of encounters between donor and recipient cells. As with most previous experiments, donor predictions were accurate but transconjugants were overestimated by 0.3–1 log unit. Recipient predictions were less accurate, with underestimation by several orders of magnitude for the higher nutrient levels.
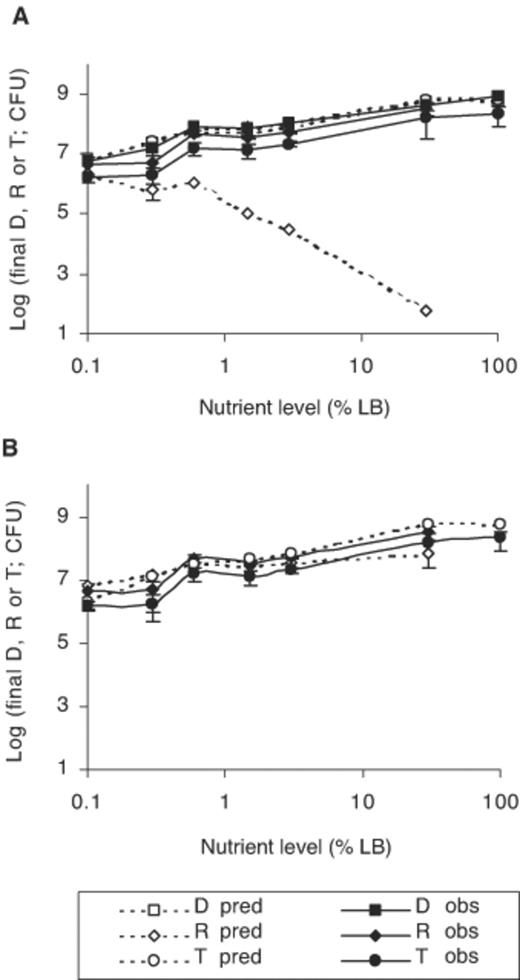
Predicted and experimental final numbers of donors, recipients and transconjugants for initial donor and recipient numbers of log 5.6 and 5.67, respectively, when nutrient concentration was varied experimentally. Model predictions for instantaneous conjugation (A) or conjugation occurring after 2.25 h of contact (B). Donor predictions remain unchanged and are not presented again in panel B. Triplicate Nuclepore filters were floated over different dilutions LB broth in 0.85% (w/v) NaCl or full strength LB broth and incubated at 30°C, for 9 h. Symbols and error bars as described in Fig. 2.
3.4 Consideration of conjugation time by the model
The model predictions presented so far were obtained on the assumption that conjugation occurred instantly when donor or transconjugant colonies met recipient microcolonies. A tentative delay in conjugation was subsequently taken into account by the model, so that all cells in a recipient colony only became transconjugants after contact for a certain length of time. Model predictions for transconjugants and recipients were greatly improved (generally to within half a log unit of experimental data) by a delay of 2–3 h depending on the experiment. A delay of 2.25 h gave the best overall fit and the corresponding predictions were presented in Figs. 2B, 3C, D, 4C, D and 5B. Donor predictions were unaltered by the delay and were not presented again. The most dramatic improvements in predictions were for recipients in experiment 1 (Fig. 2B), transconjugants and recipients in experiment 3 (Fig. 3D), transconjugants and recipients corresponding to a recipient inoculum of up to 2.6×10⁴–105 in experiment 4 (Fig. 4C) and recipients in experiment 6 (Fig. 5). Significant discrepancies between experimental transconjugants and recipients and respective predictions by the model were still observed for conditions where recipient inocula were larger than donor inocula. This occurred for transconjugants and recipients corresponding to a recipient inoculum greater than 2.6×10⁵ in experiment 4 (Fig. 4C) and for transconjugants and recipients arising from recipient inocula greater than 4.37×10⁵ (Fig. 4D).
4 Discussion
Mathematical modelling of plasmid transfer on surfaces requires consideration of two major processes, establishment of contact between donor and recipient cells and attainment, or existence, of physiological status in those cells enabling plasmid transfer. Our model focussed on the first process and therefore provides a maximum estimate of transconjugant numbers, assuming that conjugation occurs with maximum efficiency once microcolonies meet. The laboratory experimental system against which the model was tested consisted of two isogenic strains of P. fluorescens and the self-transmissible conjugative plasmid RP4. This system was chosen to satisfy the simplifying assumptions of the model and ensure a high efficiency of transfer on surfaces. The model was tested at three different levels: (i) initial spatial distribution of bacteria; (ii) limits of the approximate theory (Eq. 2) on which the model is based; and (iii) comparison of final numbers of donors, recipients and transconjugants predicted by the model and observed in laboratory experiments. Spatial randomness of microcolonies was observed in our experimental system and has been described by others [19]. Computer simulation experiments to test the limits of the approximation used by the model (Eq. 2) provided theoretical support for the model when the initial coverage of surface was 60% or less. The model will not be accurate for high initial densities leading to confluent growth, i.e. greater than 1.8×10⁷ cells per filter (log of 7.2) in our experimental system. Densities corresponding to the highest inoculum levels in experiments 1–5 (Figs. 2–4) are above those for which the model fits well as determined by computer simulation experiments. Existing mass action models describe gene transfer adequately under high-density conditions. Here we were interested in describing gene transfer for lower concentrations of cells, when the probability of encounters depends on radial growth of randomly spaced microcolonies.
Overall, the model predictions were close to laboratory experimental trends but, under certain conditions, conjugation was overestimated by 0.5–2 orders of magnitude. A certain degree of discrepancy (half a log unit) seems acceptable, considering that variability in the experimentally determined model parameters was not taken into account by the model, for which average values were used. Overestimation of conjugation may be explained by the model assuming instantaneous conjugation, whereas results indicated a lag period prior to plasmid transfer, as transconjugants were not detected in great numbers until 2 h. Studies on the kinetics of plasmid transfer in liquid matings [20–22] have estimated that conjugative transfer takes 3.5–4 min in Bacillus thuringiensis, E. coli and Enterococcus faecalis, that donors need a period of recovery of 5–30 min following conjugation before they can donate again, and that transfer from newly formed transconjugants may be delayed for 40–80 min. This delay may be required for synthesis of the complementary DNA strand and expression of genes required for transfer functions, e.g. pilus or aggregate formation. When a hypothetical delay was introduced in our model, so that all cells in a recipient microcolony only became transconjugants after 2.25 h of contact with a donor or transconjugant microcolony, predictions were dramatically improved. Discrepancies between laboratory and model data were still observed for some conditions where recipient inocula were much greater than donor inocula. Under such conditions most of the plasmid transfer will necessarily be carried out by transconjugants because the few existing donors can only participate in a limited number of colony encounters and this raises the possibility that transconjugants might not be able to donate as efficiently as the original donors.
Another factor that could play a role in overestimation of conjugation is that not all cells in a microcolony may be able to participate in conjugation. Indeed, in a previous study, in situ gene transfer of the TOL plasmid between isogenic Pseudomonas putida microcolonies never occurred throughout the entire recipient colony [23,24]. This could be due to nutrient limitation at the microcolony centre, as TOL plasmid transfer is strongly dependent on the physiological state of the bacteria [25]. In the present study microcolony growth was still exponential after incubation for 9 h, suggesting that most cells in the colony were actively dividing. It is nevertheless possible that a proportion of the cells were not capable of plasmid transfer due to nutrient limitation, especially when high cell densities were reached or at the centre of large colonies.
The model and experimental system described here are necessarily simplified to demonstrate quantitatively the relationship between inoculum sizes and nutrient concentration on the extent of plasmid transfer. Spatial and biological heterogeneity in natural environments make the precise modelling of both the establishment of contact between cells and their ability to transfer genetic material difficult. We can nevertheless gain some insight when extrapolating to environmental conditions. For example, if donor and recipient cells inoculated into non-sterile soils are sited in ‘hot-spots’, e.g. the rhizosphere or close to decaying material, then cell growth and conjugation may occur readily. If, however, soil conditions do not sustain significant cell growth, then conjugation will only occur if the inoculation process itself leads to contact between the two populations, e.g. if cell concentrations are high, unless mechanisms such as bulk flow, movement of soil and animals, and growth of plant roots and fungal hyphae promote dispersal of cells [26,27]. Previous studies aimed at testing models of gene transfer in the soil have eliminated spatial effects by utilisation of high cell concentrations and high matric potentials that enhanced mobility [28].
Nutrient relationships in natural environments are complex, affecting both cell growth and ability to conjugate. In established biofilm systems, physical and chemical heterogeneity are believed to result in a range of growth conditions [29,30]. The majority of microcosm studies of effect of nutritional factors on gene transfer in soil indicate increased gene transfer in the presence of nutrients [31–35]. Greater cell activity may increase the probability of gene transfer once donor and recipient cells have met. However, the current model also indicated significant effects due to increased probability of encounters through colony expansion. Normander et al. [36] have shown that only a low activity threshold is required for conjugation on leaves, with cell-to-cell contact being guaranteed by aggregation of bacteria into microhabitats. This is analogous to low nutrient levels (0.1% LB) being capable of sustaining conjugation in our system.
We foresee that the model could be applied to studies of gene transfer between bacteria growing on surfaces, such as those of Normander et al. on the phylloplane [36], Christensen et al. on biofilms [23] or Licht et al. on animal intestine [12], provided that the model parameters are known for the conjugation system and as long as confluent growth is not observed. This last point implies that the model will be most useful for the initial stages of colonisation. In addition, as it stands, the model is only applicable to systems that do not require pheromone signalling for conjugation. The assumption of exponential growth will need testing and if it does not hold, growth should be described by other functions [8]. Exponential colony expansion has been demonstrated during early colony growth of a variety of strains under conditions similar to those of our experimental system [37–39]. As colonies increase in size, however, exponential colony expansion will not be sustained due to nutrient limitation and accumulation of inhibitory compounds and most growth will take place at the periphery of the colony [38,40].
Another limitation of the model is that it assumed identical growth rates for donors, recipients and transconjugants, which will rarely be the case when different donor and recipient strains are involved and/or plasmid acquisition carries a metabolic load. Nevertheless, there is scope for the model to account for different growth rates [14].
The present model does not consider cell mobility and this was not shown to be important in our experimental system. In other systems, the effect of mobility on establishment of cell-to-cell contact and plasmid transfer may require consideration. In aquatic environments, cell movement through bulk flow is facilitated and it has been shown to occur within biofilms cultured in flow chambers [23,41]. In soils, soil–water relationships will determine distribution of cells within pore size categories and greatly influence mobility [28].
Determination of model parameters, in particular growth rates, by the methods used in the present study might prove time consuming. Alternative methodologies are available, such as the use of image analysis techniques for determination of growth rates in situ [37] and of fluorescence-labelled ribosomal probes to quantify cellular RNA, which in turn can be related to growth rate [42]. More sophisticated conjugation systems may allow for in situ determination of transconjugants and of the kinetics of conjugation. One such system consists of plasmids containing gfp under the lac promoter, where gfp expression is repressed in the donor due to a chromosomal lacIq repressor gene, but occurs when a recipient not containing the repressor gene receives the plasmid [23,24,36,43].
In conclusion, the model provides the basis for a mechanistic description of plasmid transfer on solid surfaces, taking into account spatial effects on the kinetics of conjugation. Description of transfer of less promiscuous plasmids under a variety of environmental conditions will no doubt require greater parameterisation of the model and more sophisticated experimental testing. In particular, the kinetics of plasmid transfer within microcolonies will have to be studied in greater detail, in order to develop the mathematical model further.
Acknowledgements
We thank Drs N. Cook and J. Roberts (University of Aberdeen) for provision of strains. This work was supported by JNICT/FCT (Portuguese Government) under a CIENCIA/PRAXIS XXI Ph.D. studentship to C.L.
References
