


Abstract
To better understand the trigger for and use of motility in marine bacterial chemotaxis, specific (amino acids) chemical stimuli were used to test the effect on bacterial speed and reorientation. An assay system was developed to analyse bacterial behavioural responses to point-like nutrient sources (beads 10–40 μm). The marine bacteria Pseudoalteromonas haloplanktis, Shewanella putrefaciens, Deleya marina, the enteric bacterium Escherichia coli and an enriched assemblage of marine bacteria were used in the assay. E. coli responded to the amino acids (e.g. serine, leucine) in this assay in a manner similar to the classical capillary plating method, and accumulated near the attractants using biased random walks and maximum speeds of less than 30 μm s−1. The marine bacteria travelled more than 100 μm s−1 and reversed direction instead of randomly tumbling to reorientate. Marine bacteria also showed different chemotactic responses. The enriched marine community and P. haloplanktis were repelled by serine while leucine was an attractant for all three marine isolates. More importantly marine bacteria formed band specific distances (>20 μm) away from individual beads. The bands were composed of free-swimming bacteria rather than bacteria attached to the beads or chamber surfaces. The bands’ formation time (25–180 s) and width (5–20 μm) varied depending on the bacterial strains and attractant. This variation in chemotactic responses by the marine isolates may reflect adaptations to specific ecological niches of bacterioplankton in the ocean. However, band forming ability by marine bacteria has still only been reported in experimental studies, nutrient coupling between nutrient sources and bands of chemotactic marine bacteria have yet to be detected in the natural environment. The fragility of the bands, a clear association between free-swimming bacteria and nutrient, indicates the difficulty and potentially sets limits for finding microzones of bacteria around particles in the open ocean.
1 Introduction
Free-living marine bacteria inhabit a largely oligotrophic environment. However, the production and accumulation of macromolecules and nutrients via aggregation into particles results in nutrient enriched particles or point source microenvironments in an otherwise nutrient deficient broth [1,2]. Bacteria that are attached to these particles often have increased metabolic activity over that of free-living bacteria in the water column that are not associated with a nutrient source [3,4]. The increased reproductive advantages of attachment are offset by the fact that these microenvironments are often transient, easily exhausted and prone to grazing by micro-zooplankton [2]. Therefore the ability of bacteria to stay loosely associated with discrete sources of nutrients could be advantageous, by enabling bacteria to benefit from transient microenvironments and move on once the nutrient source has been depleted. Localised discrete sources of nutrients may explain the reason for chemotaxis in a turbulent environment. The heterogeneous pelagic environment differs from the relatively stable environments in which the enteric Escherichia coli and terrestrial bacteria have evolved, and there is evidence the chemotaxis is different as well [5–7]. Here we are interested in the details of how marine bacterial chemotaxis differs from that of enteric and soil bacteria.
The generalised model for bacterial chemotaxis involves bacteria swimming at speeds of up to 40 μm s−1 in a relatively straight line during a ‘run’ which may last up to a second and stopping to complete a tumble before swimming off in a new random direction. The presence of a concentration gradient may cause a chemosensory response to increase or decrease the stopping, and thus the turning, frequency of the bacteria that alters the runlengths of the cells while not altering the swimming speed. The effect of these behavioural changes is a general slow migration of the bacteria either away from or towards areas of high chemical concentration [8]. Scale is an important consideration in bacterial chemotaxis. Migration, the drift velocity, is ∼3 μm s−1 a few percent of the swimming speed 10–30 μm s−1 of E. coli[9]. This is implicit in Adler's [10] classic paper on chemotaxis that showed enteric bacteria required many hours to migrate a few centimetres. This was quantified by Berg and Brown [8] and Jackson [11], explained by Purcell [12] and shown to be far from the optimum of what bacteria were capable of by Segall et al. [13]. This inefficiency is problematic in the ocean and most aquatic environments. The turbulent nature of the ocean means that, what is a few centimetres away from a bacterium one minute might be tens of centimetres or a metre away the next minute. If chemotaxis is going to be useful in the ocean then it might best be adapted to responding rapidly over short distances.
Free-living motile marine bacteria display modified swimming behaviour from that of Brown and Berg's E. coli model [8]. Typically, the swimming speed of marine bacteria is variable, can be >300 μm s−1 and is used as part of a run and reverse strategy [7,14]. Johansen et al. [15] recently reported that up to 70% of marine bacterial isolates demonstrate run and reverse strategy. Instead of tumbling marine bacteria can reverse their direction after each stop, this simple back and forth motion enables them to form tight (<20 μm wide) swarm bands around air bubbles or chemical attractants [7,14]. A recent model hypothesised how run–reverse bacteria in the ocean may use chemotaxis to enhance interactions with particles without the need for attachment due to the function of shear [16]. This behaviour may be useful for remaining at a preferred nutrient concentration around a nutrient source. Bacterial chemotaxis can be viewed as a precursor to metabolism, symbiosis, predator prey relationships or other ecological processes such as nutrient cycling. Blackburn et al. [17] proposed that chemotaxis could increase nutrient gain by a factor of two for marine bacteria loosely associating with particles. To receive a benefit but not become attached would require the bacteria to stay within tens of micrometres around the nutrient source, while swimming at speeds greater than 80 μm s−1[7]. Individual cells would find an optimum or preferred nutrient concentration and when large numbers of cells accumulated at a similar chemical concentration the result may be a cluster band or ring of bacteria around the nutrient source [14].
Previous studies have described the basic features of high-speed motility but they did not reveal the exact use of high-speed motility in marine bacteria [7,18]. Here we observed bacterial responses to discrete point-like sources of nutrients. By ionically bonding individual amino acids to ion exchange beads, we were able to compare the behavioural response of marine bacteria and E. coli to discrete sources. The marine bacteria often formed discrete bands of moving cells suspended in the medium that remained a fixed distance from the bead. This was not observed in E. coli, indicating the response of the marine bacteria under these conditions is qualitatively distinct and may be an adaptation to the need to perform chemotaxis in a turbulent environment.
2 Materials and methods
2.1 Enrichment and growth conditions
Bacterial community samples were collected from the sea, approximately 100 m from shore in 3 m of water (water temperature 21°C), at Brighton Beach, South Australia, and kept in 500 ml, sterile, glass bottles at 21–23°C for 24 h. This permitted particles in the water sample to settle out, separating bacterioplankton from discrete nutrient sources and was done to increase the fraction of motile cells [5]. To increase cell number and stimulate motility, 10% tryptic soy broth (Difco Laboratories) (TSB) was added to produce an enriched community at a final concentration of 0.1% TSB and the sample left for another 24 h. For comparison with the enriched seawater community, strains of Shewanella putrefaciens, Pseudoalteromonas haloplanktis and Deleya marina all originally from Brighton Beach [5–7], as well as E. coli ATCC 29922 were used in the chemotaxis trials. The E. coli were grown up in 0.1% TSB cultures overnight while the marine isolates were grown up in 0.1% TSB autoclaved filter sterilised seawater from Brighton Beach. The pHs for E. coli, the marine isolates and the enriched bacterial community were 7.4, 8.2 and 8.3, respectively.
2.2 Chemotactic stimuli
The point source beads for chemotaxis were Sephadex G-50 (10–40 μm) superfine beads (Pharmacia Fine Chemicals) ionically bonded with amino acids (Sigma) or casamino acid (Difco Laboratories). Concentrations of stimulants were set at 6×10⁻⁵ g ml−1 for casamino acid and individual amino acids, of the L-configuration, were used at a concentration of 6×10⁻⁴ M and all were adjusted to pH 7.0, before being ionically bonded to the Sephadex beads (hereafter simply referred to as beads). The freshly prepared beads were frozen with the amino acids or casamino acid. All nutrient or chemotactic solutions were prepared with glass distilled water. We used an untreated bacterial suspension as one of two controls to compare bacterial behaviour, beads in frozen glass distilled water at pH 7.0 served as the second control. The results of the bacteria in the untreated suspensions were used as references to normalise the data from the treatments.
2.3 Chemotactic assay
Stimulants preloaded onto ion exchange beads were used for each experiment instead of a capillary tube, as in the classical chemotactic assay [19]. The beads were viewed using a trinocular microscope (Olympus BH-2) fitted with a video camera (Panasonic CCTV, WV-BP550). Rather than plate counts, the bacterial accumulation and behaviour were analysed directly from the video images to quantify the response to the stimulants. This method made it possible to assess the bacterial response to a stimulant within a few minutes and gather information on runlength, reorientation and cell speed. Each assay was run at room temperature, 21–23°C, for 10 min and experiments for each treatment were repeated three times.
2.4 Direct observation and motility measurements
Cells in 45 μl samples of each of the bacterial cultures were placed into O-ring spacers on microscope slides and the chambers filled with an additional 5 μl of the treatment beads to form 50 μl chambers and sealed immediately preceding videotaping. The bacterial cells were videotaped under bright-field microscopy (magnification, ×400) with the field of view maintained at the surface of the bead. The video image was recorded continuously by a video cassette recorder (Panasonic NV-HS1000). A heat dissipation filter consisting of water in a container 3 cm thick was used to minimise the effect of any temperature changes caused by the microscope lamp.
Bacterial speed was measured using frame-by-frame analysis of video images and averaged from 60 cells for each replicate [14]. Only those cells within focus were recorded and bacterial concentration of cells was calculated using the focal depth and direct counts of the highest accumulation of cells near a stimulant in the field of view. The proportion of motile cells within the population or the community concentration was measured directly from video images according to Mitchell et al. [5].
2.5 Attachment to beads
In some instances there was bacterial clustering and band formation detected around particular stimulants with the marine bacteria. To test whether the band formations ended in attachment of cells to the bead, the marine isolates were followed for 20 min and attachment recorded over this period. Attachment was defined as bacterial cells making contact with bead surface and ceasing motility.
2.6 Normalised data
To normalise for day-to-day variation in motility, a series of indices were calculated expressing the bacterial responses as ratios to the control responses from the untreated controls. These values showed less variability between the different replicates than did the absolute responses. Relative responses of 2.0 or greater are considered to be significant since they are approximately twice the response of the control and at least two standard deviations above the mean control values.
The accumulation index is a measure of the relative accumulation of cells and was determined from the total number of cells that accumulated within 70 μm of a bead surface divided by the number of cells in the same sized area in the untreated control. The distributions of the normalising controls are not plotted, they consisted of treatments without beads, or amino acids.
The motility index measured the proportion of motile cells that accumulated in the 70 μm2 area near the beads. It was determined by calculating the percentage of motile cells that accumulated in the 70 μm2 area near the beads and dividing that by the percentage of motile cells in the untreated control for each of the bacteria.
The relative change in speed was calculated by subtracting the average speed of the cells in the untreated controls from the average speeds of the cells in the treatments. This indicates any significant changes in speed for the bacteria in the treatments, we define significant as two standard deviations above or below the average control value.
The band structure depicts the pattern of cell accumulation and is a measure of the degree of clustering or organisation of the bacteria. The higher the number, the tighter the clustering and organisation of the cells, values below 2 indicate accumulation without organisation. It was calculated by dividing the standard deviation of the distance distribution within 70 μm of the bead surface by the standard deviation of the untreated control distributions. The area (70 μm2) was selected randomly within the untreated controls, since the bacterial distribution within these controls was even.
3 Results
3.1 Chemotaxis
Attractants were stimulants with an accumulation index that was significantly higher than the control while repellents were stimulants with an accumulation index significantly lower than the control (Fig. 1). The behavioural responses of all five bacterial cultures varied for the different chemical stimuli yet the marine bacteria had some similar mechanisms for accumulating. E. coli cells migrated en masse, and were attracted to casamino acid, cysteine and serine as shown by their increased accumulation index and cell concentrations above that of their control (Fig. 1,Table 1). Glutamine, leucine and valine repelled the enteric bacteria (Fig. 1,Table 1). Of the marine bacteria only D. marina and S. putrefaciens were attracted to cysteine and serine in large numbers (Fig. 1,Table 1). P. haloplanktis and the bacterial community were repelled by serine (Fig. 1,Table 1). The casamino acid had no significant effect on the chemotactic response of S. putrefaciens but was an attractant for P. haloplanktis, D. marina and the enriched bacterial community (Fig. 1,Table 1). Leucine was an attractant for all of the marine isolates and the enriched bacterial community (Fig. 1,Table 1).
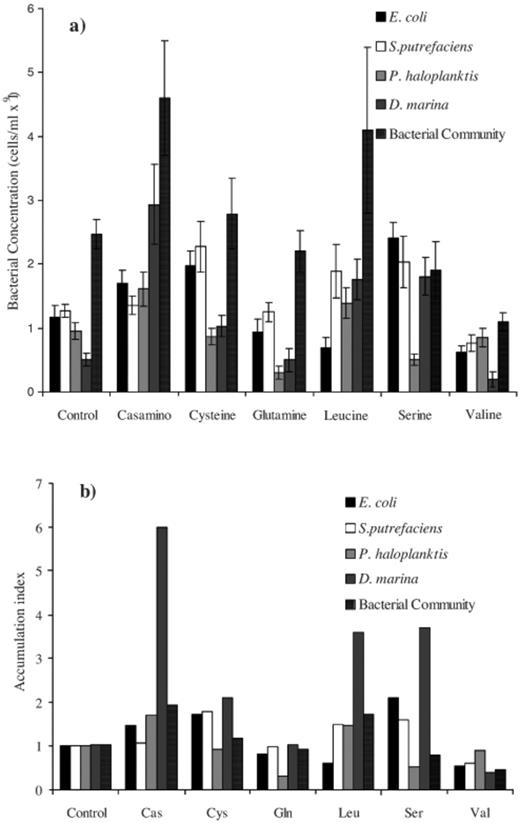
Bacterial accumulations in response to the bead load stimulants depicted as both a: total cell abundances (means±95% confidence intervals) and b: as an accumulation index (bead, control Sephadex beads with no added stimulant; Cas, casamino acid; Cys, cysteine; Gln, glutamine; Leu, leucine; Ser, serine; Val, valine).
Represents the taxis of the bacterial strains and enriched seawater community toward the stimulants
| Stimulant | E. coli | S. putrefaciens | P. haloplanktis | D. marina | Enriched bacterial community | |||||||||||||
| Conc.a | Taxisa | Conc.a | Taxisa | Band | Time (s) | Conc.a | Taxisa | Band | Time (s) | Conc.a | Taxisb | Band | Time (s) | Conc.a | Taxisa | Band | Time (s) | |
| Casamino | 1.7 (0.2) | + | 1.4 (0.1) | + | × | nd | 1.6 (0.3) | + | ✓ | 35 | 2.9 (0.6) | + | ✓✓ | 20 | 4.6 (1.1) | + | ✓ | 45 |
| Cysteine | 2.0 (0.2) | + | 2.3 (0.4) | + | ✓ | 75 | 0.9 (0.1) | − | × | nd | 1.2 (0.1) | − | ✓ | 120 | 2.8 (0.6) | + | × | nd |
| Glutamine | 0.9 (0.2) | − | 1.0 (0.1) | − | × | nd | 0.3 (0.1) | − | × | nd | 0.5 (0.2) | − | × | nd | 2.2 (0.3) | − | × | nd |
| Leucine | 0.7 (0.1) | − | 1.9 (0.4) | + | ✓✓ | 15 | 1.4 (0.2) | + | ✓✓ | 55 | 1.8 (0.3) | + | ✓ | 50 | 4.1 (1.9) | + | × | nd |
| Serine | 2.4 (0.2) | + | 2.0 (0.4) | + | ✓ | 45 | 0.5 (0.1) | − | × | nd | 1.8 (0.3) | + | ✓ | 85 | 1.9 (0.5) | − | × | nd |
| Valine | 0.6 (0.1) | − | 0.8 (0.1) | − | × | nd | 0.8 (0.1) | − | × | nd | 0.2 (0.1) | − | × | nd | 1.1 (0.1) | − | × | nd |
Bands were defined as regions of high density of cells where the proportion of motile bacteria in a 20 μm wide area exceeded 90%, (✓) symbolises presence of a band, (×) denotes absence of band, note a (✓✓) indicates a particularly tight accumulation of cells in a band.
Time in seconds is given for band formation when a band first begins to form around a stimulant source and has an accuracy of ±5 s.
Due to the short experimental time any increase in the number of cells within the field of view was due to accumulation of cells near the stimulant, not the cells dividing. Cell suspensions were monitored from the moment the slides were placed on the microscope stage.
(×109 cells ml−1) refers to the maximum concentration of cells that accumulated near a stimulant, and not the concentration of cells localised within a band.
Taxis, denoted as either positive (+) or negative (−).
3.2 Chemokinesis
Despite leucine having an increased accumulation index, increased cell numbers around the stimulant source, for all of the marine isolates and the enriched bacterial community it only elicited an increase in the motility index for S. putrefaciens (Figs. 1 and 2).
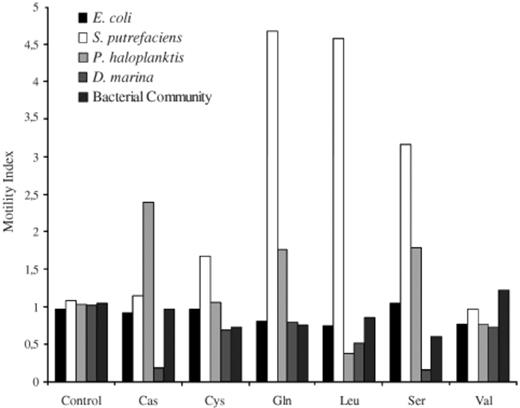
Motility index shows the relative proportion of motile cells that accumulated near the stimulant beads (bead, Sephadex bead with no stimulant; Cas, casamino acid; Cys, cysteine; Gln, glutamine; Leu, leucine; Ser, serine; Val, valine).
The motility index, a measure of the proportion of motile cells, of S. putrefaciens was raised for the attractants serine and cysteine (Fig. 2) but was a factor of 4 higher than its control for leucine and the stimulant glutamine. The high number of motile cells may have caused the large error bars in the accumulation index for S. putrefaciens in response to these two amino acids (Fig. 1b). The motility index of D. marina decreased in the presence of all stimulants but was only significantly lower for its attractants in comparison to its control (Fig. 2). The motility index of P. haloplanktis increased in the presence of glutamine and serine (Fig. 2) despite these chemicals acting as repellents to that isolate (Fig. 1). Excluding the enriched bacterial community, that had large variations in its average speed, all of the marine bacteria trialed showed a significant increase in relative cell speed in the presence of a stimulant (Fig. 3). E. coli had no significant changes in its motility index (Fig. 2) and only showed significant speed changes for the stimulants leucine, serine and valine (Fig. 3).
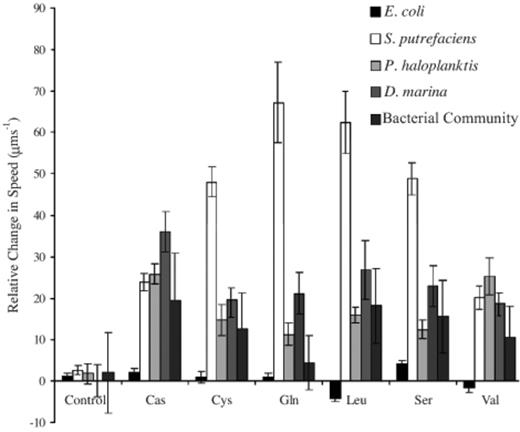
Relative change in speed, depicts the change in average speed above or below the controls for the different bacteria in response to the stimulant sources (bead, Sephadex bead with no stimulant; Cas, casamino acid; Cys, cysteine; Gln, glutamine; Leu, leucine; Ser, serine; Val, valine). Error bars are the standard deviations.
3.3 Bands
The marine bacteria, unlike E. coli, often formed uniform bands with an average width of 18 μm (±15 standard deviation) around the stimulant loaded beads (Figs. 4b and 5). These bands were on average 37 μm (±11 S.D.) from the beads’ surface and took 54 s (±32 S.D.) to form (Table 1). They remained stable for up to 5 min after which the band would either break up or migrate toward the bead surface (Fig. 6). All cells within these bands were motile, using run–reverse to remain within the bands and had a maximum reached speed of 211 μm s−1. The outer margin of the band was always less defined than the inner margin, with few motile cells and no non-motile cells between the band and the bead surface. These bands were extremely fragile and any attempts to physically manipulate them by inserting a microsyringe [14] resulted in their dispersal.
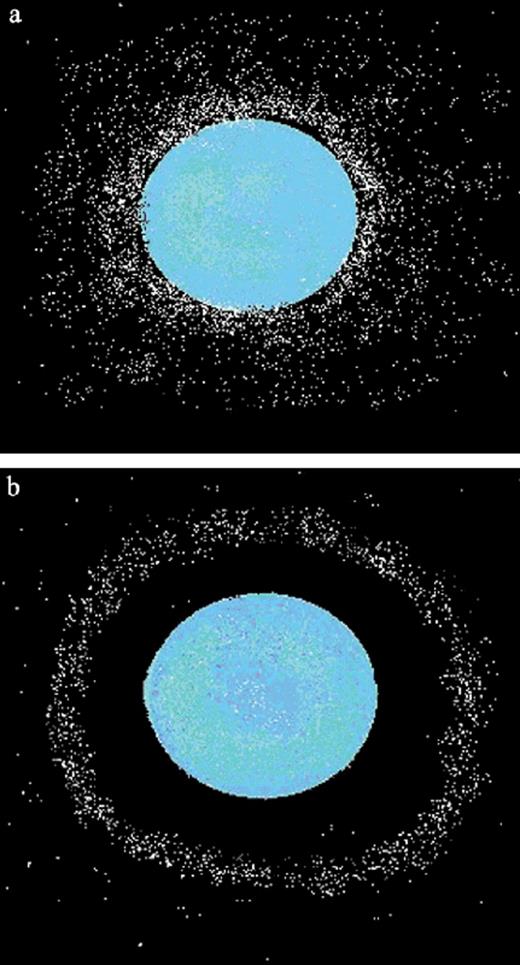
Two-dimensional schematic of the bacterial accumulation around a bead. a: En masse accumulation of bacterial cells near an attractant. b: Depicts a structured accumulation of bacteria in a band rather than en masse and to a stimulant point-like source.
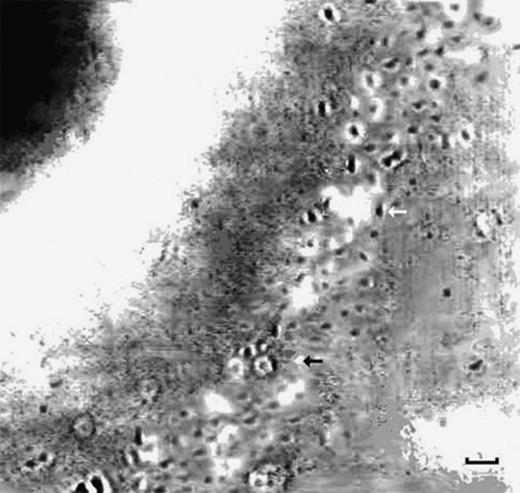
Digital image of bacterial band around a bead (scale bar equivalent to 5 μm). The bacteria in focus are seen as black dots (example indicated by white arrow), while the bacteria going in or out of the plane of focus are seen as white dots (example indicated by black arrow). This is a single tick band, refer to Table 1.
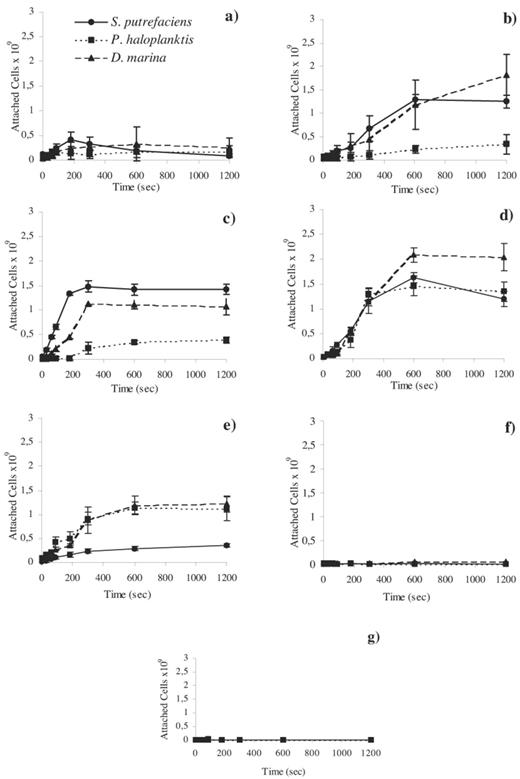
These figures show the attachment time of the marine isolates S. putrefaciens, P. haloplanktis, and D. marina to a: control with only beads, b: cysteine, c: serine, d: leucine, e: casamino acid, f: glutamine, and g: valine. The attached cells×109 are in cells ml−1, error bars represent the 95% confidence interval.
The band structure (Fig. 7) depicts the pattern of cell accumulation, the higher the number the tighter the clustering of cells in the band, values greater than 2 represent the presence of a band. The formation of the bands was not merely a result of increased cell concentration near a stimulant. In most cases band structure was independent of the accumulation index (compare Figs. 1b and 7). Therefore, the development of the band was not simply a chemotactic response but more likely a response related to the motility index and average cell speed. For example S. putrefaciens despite not having a significant increase in its accumulation index for leucine (Fig. 1) showed a high affinity for clustering in a band centred at 30 μm (±7 S.D.) from the bead (Fig. 7 and Table 1) while also maintaining a high motility index with high average cell speed (Figs. 2 and 3).
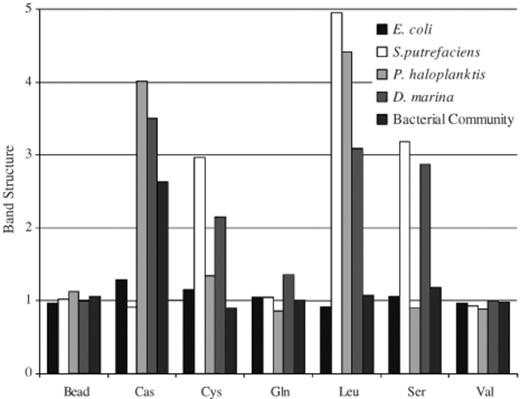
The band structure depicts the pattern or structure of the bacterial accumulations. The higher the number the tighter the clustering of the cells, values below 2 indicate accumulation without organisation (bead, Sephadex bead with no stimulant; Cas, casamino acid; Cys, cysteine; Gln, glutamine; Leu, leucine; Ser, serine; Val, valine).
3.4 Attachment to beads
The band formation ended in either attachment of cells to the bead or the dispersal of the band, shown by trials with the marine isolates recorded for 20 min. The concentration of cells that attached to the beads in the treatments showed that the stimulants glutamine and valine that did not cause band formation had negligible cell attachment to the beads (Fig. 6). The stimulants that caused the formation of bands, casamino acid, cysteine, leucine and serine (Fig. 7), also resulted in the highest number of attached cells to the stimulant beads (Fig. 6). However in the cases of S. putrefaciens with casamino acid and P. haloplanktis with cysteine or serine the attached number of cells was not significantly different from the attached number in their control (Fig. 6). The concentrations of attached cells for the stimulant casamino acid after 20 min were lower than initial bacterial concentrations recorded near the beads (Fig. 1a), suggesting that in some instances there was migration away from stimulant over time possibly as the resource was used up.
4 Discussion
All of the bacterial strains and populations in the chemotactic trial reacted differently to the treatments, showing a range of preferences for the amino acids (Fig. 1). The chemotactic responses of the enteric bacterium E. coli to the amino acids in this assay were similar to the classical capillary plating method [20]. While the repellents leucine, valine and to a lesser extent glutamine elicited a negative chemotactic response, the E. coli migrated toward the attractants cysteine and serine and the nutrient source casamino acid (Fig. 1) using biased random walks and speeds of 26 μm s−1 (±4 S.D.) (data not shown).
The marine bacteria in this study, however, showed a variety of responses to the stimulants (Fig. 1) and large speed increases (Fig. 3). As Fig. 1 shows glutamine and serine acted as repellents for P. haloplanktis cells and caused an increase in the motility index (Fig. 2), which is an example of marine bacterial negative chemotaxis. Marine bacteria may increase their motility not only to seek out and accumulate near attractants but also to disperse from and avoid inappropriate areas.
The trials involving marine isolates all had significant increases in average motile cell speed over that of their controls in the presence of any stimulant (Fig. 3), which shows that despite having only a small proportion of motile cells, particularly for D. marina (Fig. 2), those cells that were motile still achieved high speeds, >100 μm s−1 (Fig. 3). The enriched bacterial community however did not show significant increases in the proportion of motile cells (Fig. 2) or in its average speed (Fig. 3) due to the large variations in its average speed. This may be a reflection of the natural variation within the community dampening out any uniform response by a single species or small group of species.
The motility indices, proportion of motile cells, for all treatments of E. coli were all within the bounds of the control however, four of the stimulants, serine, glutamine, leucine and valine were significantly different from each other (t-tests, P<0.001). Leucine and valine both caused a significant decrease in average speed for E. coli (Fig. 3). The decrease in population speed for E. coli (Fig. 3) in the presence of the repellents leucine and valine may not have necessarily been due to a reduced motility index, but rather an artefact of measurements based on low cell numbers (99±42 cells per screen) biasing the population speeds. This conclusion is supported by the response of E. coli to glutamine, where it had declines in population motility (Fig. 2), yet it showed no significant reduction in population accumulation or speed (Figs. 1 and 3) (196±12 cells per screen).
The marine bacteria showed an ability to structure their population density in response to certain amino acids. The marine isolates all showed localised, increased average speed (Fig. 3) in the presence of a stimulant despite sometimes having an overall low motility index (Fig. 2) suggesting that the point source nature of the bead stimulants was having a localised effect on the bacterial behavioural responses.
For example, the motility index of S. putrefaciens increased in the presence of its attractants cysteine, leucine and serine but it also increased by a factor of 4 for glutamine (Fig. 2). This mobilisation of the bacteria was, in the case of glutamine, to get cells away from the stimulant bead, or move away to a preferred concentration as in the case for leucine, where the motile cells formed a band a set distance from the bead surface (Figs. 4b and 5).
Most of the marine bacteria studied here, unlike E. coli, were capable of positioning themselves, using run–reverse, at a preferred distance from a stimulant bead surface often resulting in bands of cells uniformly encircling the bead. Microscopy only has a limited focal depth, so the ‘bands’ we saw were not merely hoops around the beads but rather cross-sections of spheres of bacteria around the beads much in the same way that an onion can be sliced into rings. The development of the marine bacterial bands was not simply a chemotactic response but a more complex response related to the average cell speed and the proportion of motile cells in the immediate area of the chemical gradient.
The marine bacterial bands differ from the mass accumulation of cells, seen in the chemotactic responses of E. coli (Fig. 1). The marine bacteria congregated at a preferred distance from the stimulant source with often no net increase or migration of cells (e.g. S. putrefaciens with leucine Figs. 1 and 4), instead they restructure and compress their local population by becoming highly motile (Figs. 2 and 3) with between 90 and 100% of the cell population within the band being motile. Because the bacteria in the bands were not necessarily migrating en masse, but merely localising to a preferred chemical gradient, the strongest bands are not simply the treatments with the highest accumulation index (Figs. 1b and 7; Table 1). The narrowness (5–20 μm) and compressed nature of the band surrounding the stimulant bead meant that despite concentrations of cells within a band volume being high the overall bacterial accumulation near a stimulant may still appear small. We have reported a similar phenomenon for bacteria within microbial mats that formed bands of cells (30–40 μm wide) at a preferred intersecting oxygen/sulfide gradient [14].
The longevity of band formations was dependent on the number of marine bacteria in the band and near the stimulant the band was encircling. In most cases, the stimulants that elicited band formation resulted in some attachment of cells to those beads and the dispersal of the band (Fig. 6). Dispersal can be determined, not only from the disappearance of the band but also from the low number of cells that attached to the bead (Fig. 6) compared to the initial bacterial concentrations, e.g. casamino acid (Fig. 1a). This suggests that in some instances there was migration away from stimulant over time possibly as the resource was used up. The attachment of bacteria to the bead's surface may have been a function of bacteria colliding with the surface due to their high speed [21] while swimming through the band, as the band migrated closer to the bead when resources depleted.
The assay technique developed here differs from the classical capillary technique [20] in that we used amino acid loaded beads and observed the bacteria in situ. This enabled us to determine the bacterial response to point sources of nutrients, which the fluid filled capillary assay does not provide. It simulates more closely the freely floating natural nutrient particles in the ocean, in a way that the capillary cannot.
Unfortunately, because of the unsuspended nature of the beads, attempts to insert a microsyringe into the bands caused water movement due to capillary attraction and the beads to move, resulting in dispersal of the bacteria in the bands. However, if the affect of capillary attraction and water movement disperse the bands then how do they exist in the ocean? Presumably it is local perturbations and low Reynolds number viscous coupling processes that cause the disruption. In the ocean, eddies move as a unit for extended periods and so may permit the uninterrupted development of bands. Alternately, bands may occur in protected areas such as the confines of a porous marine snow particle, animal guts, within structures such as Rhizosolenia mats or in cyanobacterial mats.
4.1 Chemical concentration at band
4.2 Implications in the open ocean
Mitchell et al. [9] stated that marine bacteria were unlikely to form clusters around phytoplankton because the bacterial chemotactic migration rate (∼3 μm s−1) was too slow to form clusters in less than ∼100 s. However, this was based on assumptions derived from studies on E. coli and the random walks model for motility. This study's results show that marine bacteria can form clusters in tens of seconds and use run–reverse to form the clusters around stimulants. Bacteria in the open ocean may therefore be attracted to the nutrients associated with a particle, such as amino acids, and be able to remain loosely associated with the particle using a mode of motility other than a random walk.
It should be noted that the marine bacterial strains investigated, Pseudoalteromonas, Shewanella and Deleya, are not necessarily typical of the bacterioplankton and are quite possibly rare [26], furthermore the alterations to natural communities through laboratory enrichments may have selected for more opportunist species [24,25]. However, Kelly and Christoserdov [27] recently reported that seasonal succession in natural bacterial communities could result in rare genera, such as Pesudoalteromonas, becoming dominant due to shifts in the natural environmental conditions, especially when algal blooms may exist. Therefore the genera we investigated, although not necessarily typical of all marine bacteria, have the potential to become dominant in the natural environment given the correct conditions, possibly by using their motility strategy to give them a competitive advantage to point-like sources of nutrients.
Alldredge and Cohen [3] reported high bacterial abundance, almost 300× normal seawater concentration, on and around marine snow particles. These patches of high abundance may be unique microhabitats attracting various assemblages of pelagic microorganisms and resulting in non-random distributions of bacteria. Such microhabitats would be readily available to motile cells, positive chemotaxis would increase the access to and exposure of bacteria to nutrient gradients that surround particles in marine waters [28,29] and prolonging exposure to these substrates would lead to higher rates of cell division and population growth. Sinking velocities of marine snow measured in situ may vary from between 230 and 2300 μm s−1[30]. Kiørboe and Jackson [31] calculated that a 200 μm diameter aggregate would have a sinking velocity of less than 400 μm s−1, using their equation 1, the beads we used were in the 10–40 μm range which would have a maximum sinking velocity of ∼260 μm s−1. These speeds are attainable by marine bacteria [14] implying that the bacteria would be able to remain with sinking aggregates of the same dimensions as the beads. Also, bacteria within a few tens of micrometres of larger particles will be within the fluid boundary layer and so to some extent be carried along with the particle. The role of bacterial motility for sinking particles may be to remain near enough to be entrained and then overcome the slow process of fluid exchange between the boundary layer and bulk fluid. In fact, Kiørboe and Jackson [31] actually state that for the smallest particles they considered, bacteria are able to follow a sinking aggregate and hence never leave a nutrient plume.
Our results show that highly motile bacteria can congregate at a preferred concentration gradient. This has been reported for aerotactic bacteria [10,14,32,33], but to the best of our knowledge has not been previously shown for amino acids. The formation of the motile bands by the marine bacteria could be a strategy evolved for life in a turbulent environment. This structuring and banding of the population in response to a preferred chemical concentration rather than a mass accumulation as near as possible to the stimulant may help to explain how marine bacteria associate with free-floating particles in the open ocean.
Acknowledgements
We acknowledge V. Mirabelli, J. Seymour and J. Armitage for comments on earlier versions of the manuscript as well as two anonymous reviewers and K. Lange for advice on data analysis. This work was supported by the ARC (Australian Research Council) and the Flinders University of South Australia.
References
