


Abstract
In situ hybridization was used to study the spatio-temporal distribution of phototrophic sulfur bacteria in the permanent chemocline of meromictic Lake Cadagno, Switzerland. At all four sampling times during the year the numerically most important phototrophic sulfur bacteria in the chemocline were small-celled purple sulfur bacteria of two yet uncultured populations designated D and F. Other small-celled purple sulfur bacteria (Amoebobacter purpureus and Lamprocystis roseopersicina) were found in numbers about one order of magnitude lower. These numbers were similar to those of large-celled purple sulfur bacteria (Chromatium okenii) and green sulfur bacteria that almost entirely consisted of Chlorobium phaeobacteroides. In March and June when low light intensities reached the chemocline, cell densities of all populations, with the exception of L. roseopersicina, were about one order of magnitude lower than in August and October when light intensities were much higher. Most populations were evenly distributed throughout the whole chemocline during March and June, while in August and October a microstratification of populations was detected suggesting specific eco-physiological adaptations of different populations of phototrophic sulfur bacteria to the steep physico-chemical gradients in the chemocline of Lake Cadagno.
1 Introduction
Studies on the ecology of microorganisms are often complicated by the heterogeneous and dynamic nature of their habitat together with the small and discontinuous size distribution of microhabitats. In this regard, water columns of stratified lakes offer defined physico-chemical conditions or unidirectional gradients in depth intervals ranging from cm to m [1]. As such, meromictic lakes are interesting model systems for research on bacterioplankton because a number of different physiological groups of bacteria substitute each other along the vertical gradient of light, oxygen and sulfide [2–4]. Lake Cadagno in Switzerland represents such a model system. The water body of this lake is structured in three distinct layers, the oxic mixolimnion, a narrow chemocline and the anoxic monimolimnion. The chemocline is permanent and stabilized by density differences of salt-rich water constantly supplied by subaquatic springs to the monimolimnion and of electrolyte-poor surface water feeding the mixolimnion [5]. High concentrations of sulfate and steep gradients of sulfide in the chemocline [6,7] support the growth of elevated numbers of bacteria (up to 107 cells ml−1) indicating that a bacterial community making use of these gradients is present [8,9]. Molecular techniques that permit analysis of microbial community structure unaffected by the limitations of culturability showed that almost all bacteria belonged to the Proteobacteria [8,9] with numbers for the α-, β-, γ- and δ-subdivisions of Proteobacteria, respectively, accounting for 23, 17, 45 and 15% of the total number of bacteria [8,9]. Purple sulfur bacteria were most prominent numerically with on average 33% of all bacteria [10,11]. All large-celled purple sulfur bacteria were identified as Chromatium okenii, while small-celled purple sulfur bacteria consisted of four major populations forming a tight cluster with Amoebobacter purpureus (recently reclassified as Lamprocystis purpurea[12]) and Lamprocystis roseopersicina[9]. These small-celled purple sulfur bacteria were usually found in aggregates, together with sulfate-reducing bacteria of the family Desulfovibrionaceae[8,9].
The populations of small-celled purple sulfur bacteria displayed different distribution profiles in the chemocline of Lake Cadagno indicating different eco-physiological adaptations [9,13,14].Since most of these bacteria have not been obtained in pure culture yet, the aim of this study was to gather information on their spatial and temporal distributions in the chemocline of Lake Cadagno and to analyze their interrelationships with environmental factors [13,14]. The analysis was based on in situ hybridization using rRNA-targeted, Cy3-labeled oligonucleotide probes. In addition to specific populations of purple sulfur bacteria (C. okenii, A. purpureus, L. roseopersicina, and two yet uncultured and uncharacterized populations D and F) [9], green sulfur bacteria were analyzed using a published [15] and a newly designed probe specifically targeting a sequence retrieved from a 16S rRNA gene clone library from the chemocline of Lake Cadagno [16].
2 Materials and methods
2.1 Site description, physical analyses and sampling
Lake Cadagno is an alpine lake located 1923 m above sea level in the south of Switzerland (46°33′N, 8°43′E) in the catchment area of a dolomite vein rich in gypsum (Piora-Mulde). The lake has a surface area of 26×105 m2 and a maximum depth of 21 m. Due to the infiltration of water through the dolomite vein, Lake Cadagno is a meromictic lake characterized by a high salinity of the monimolimnion and a permanent chemocline in a depth between 9 and 14 m [5,17]. Samples were taken from the chemocline over the deepest site in the center of the lake (21 m) in October 1998, and in March, June and August 1999. The chemocline and the bacterial plume in Lake Cadagno were located at each sampling date using temperature, conductivity, pH, dissolved oxygen, turbidity and redox potential measurements with a YSI 6000 profiler (Yellow Springs Inc., Yellow Springs, OH, USA) [9,18]. In addition, PAR-light transmission conditions were determined down to the chemocline in steps of 0.1 m using two LI-193SA spherical quantum sensors and a LI-COR 1000 datalogger (LI-COR Ltd., Lincoln, NE, USA). The latter measurements were used to calculate vertical attenuation coefficients (Kd) of photosynthetically available radiation [19] for the mixolimnion and the bacterial layer. The YSI 6000 profiler and LI-COR sensors were fixed at the lowest part of a thin-layer pneumatic multi-syringe sampler (University of Zurich, Institute of Microbiology, Switzerland) that was used after detection of the chemocline to take 20 samples of 100 ml simultaneously each over a total depth of 2 m, yielding in a depth resolution of 10 cm between each sample [9,18,20,21].
2.2 Chemical analysis
From these samples, 11-ml subsamples were immediately transferred to screw-capped tubes containing 0.8 ml of a 4% zinc acetate solution. These were stored on ice and used to determine sulfide concentrations by colorimetric analysis [22] using the Spectroquant® kit of Merck (Switzerland) [9,18]. Additional 10 ml was immediately filtered through 0.22-μm polyethersulfone membrane filters (GyroDisc-PES25, Orange Scientific, Waterloo, Belgium) into plastic tubes containing 100 μl of 65% nitric acid solution (Fluka, Buchs, Switzerland). These samples were further analyzed for dissolved iron by graphite furnace and air acetylene flame atomic absorption with a SpectrAA-800 instrument (Varian, Melbourne, Australia). Ammonium and sulfate concentrations were measured by isocratic ion chromatography with suppressed conductivity detection with a Dionex DX-500 ion chromatograph (Dionex, Olten, Switzerland). For the determination of ammonium, a CG-12 pre-column, a CS-12 column, a CSRS-1 suppressor, 20 mM methanesulfonic acid as an eluent at a flow of 1.0 ml min−1 were used, for that of sulfate an AG-14 pre-column, an AS-14 column, an ASRS Ultra suppressor, and a mixture of 3.5 mM Na-carbonate and 1.0 mM Na-bicarbonate as eluent were used at a flow of 0.6 ml min−1[23].
2.3 Microbial analysis
For the microbial analysis of the chemocline, 15-ml subsamples of water obtained with the multi-syringe sampler were filtered immediately after sampling through 0.22-μm polycarbonate membrane filters (25 mm diameter; Millipore, Volketswil, Switzerland) [24]. Bacteria were fixed by overlaying the filters with 4% paraformaldehyde in phosphate-buffered saline (PBS; 0.13 M NaCl, 7 mM Na2HPO4, 3 mM NaH2PO4, pH 7.2) for 30 min at room temperature [25]. The filters were subsequently rinsed twice with PBS by vacuum filtration and transferred into plastic bags with 1 ml of 50% ethanol in PBS. In sealed bags, the bacterioplankton was released from filters and resuspended by slightly massing the filter with thumb and forefinger [26]. The complete release of the bacteria from filters was checked microscopically after DAPI staining. Resuspended bacterial cells were than transferred into Eppendorf tubes and stored at −20°C until further use [9,25].
Aliquots (1 μl) of the samples were spotted onto gelatin-coated slides (0.1% gelatin, 0.01% KCr(SO4)2). The preparations were allowed to air-dry and subsequently dehydrated in 50, 80 and 96% of ethanol for 3 min each [25]. The analysis of purple and green sulfur bacteria in the chemocline samples from Lake Cadagno was based on in situ hybridization using rRNA-targeted, Cy3-labeled oligonucleotide probes (Table 1). In addition to previously published probes GAM42a [27], Cmok453, Apur453, Laro453, S453D, S453F [9] and GSB532 [15], an additional probe (CHLP441) was designed using the ARB program [28]. Probe CHLP441 specifically detected clone 366 of a 16S rRNA gene clone library from the chemocline of Lake Cadagno [16] that had a sequence identical to that of Chlorobium phaeobacteroides (accession number Y08104). Probe specificity was checked with reference to available 16S rRNA sequences with the ARB program and in the EMBL/GenBank databases using FASTA [29].
Oligonucleotide probes
| Probe | Target | Sequence (5′⇒3′) (% formamide in hybridization buffer) | Reference |
| GAM42a | γ-subdivision of Proteobacteria 23S rRNA, pos. 1027–1043 | GCCTTCCCACATCGTTT (10%) | [27] |
| Cmok453 | Chromatium okenii (DSM169) 16S rRNA, pos. 453–479 | AGCCGATGGGTATTAACCACGAGGTT (20%) | [9] |
| Apur453 | Amoebobacter purpureus (DSM4197) 16S rRNA, pos. 453–479 | TCGCCCAGGGTATTATCCCAAACGAC (40%) | [9] |
| Laro453 | Lamprocystis roseopersicina (DSM229) 16S rRNA, pos. 453–479 | CATTCCAGGGTATTAACCCAAAATGC (40%) | [9] |
| S453D | Clone 261 from Lago Cadagno 16S rRNA, pos. 453–479 | CAGCCCAGGGTATTAACCCAAGCCGC (30%) | [9] |
| S453F | Clone 371 from Lago Cadagno 16S rRNA, pos. 453–479 | CCCTCATGGGTATTARCCACAAGGCG (35%) | [9] |
| GSB532 | Green sulfur bacteria 16S rRNA, pos. 532–547 | TGCCACCCCTGTATC (10%) | [15] |
| CHLP441 | Chlorobium phaeobacteroides 16S rRNA, pos. 441–464 | AAATCGGGATATTCTTCCTCCAC (40%) | This study |
Hybridizations were performed in 9 μl of hybridization buffer (0.9 M NaCl, 20 mM Tris–HCl, 5 mM EDTA, 0.01% SDS; pH 7.2) in the presence of 10–40% formamide depending on the probe (Table 1), 1 μl of the probe (25 ng μl−1), and 1 μl of a solution of DAPI (200 ng μl−1) at 46°C for 2 h [30]. After hybridization, the slides were washed in buffer containing 20 mM Tris–HCl, pH 7.2, 10 mM EDTA, 0.01% SDS and either 440, 308, 102, 80 or 56 mM NaCl depending on the formamide concentration during hybridization (10, 20, 30, 35, and 40%, respectively) for 15 min at 48°C, subsequently rinsed with distilled water, and air-dried. The slides were mounted with Citifluor AF1 immersion oil solution (Citifluor Ltd., London, UK) and examined with a Zeiss Axiolab microscope (Zeiss, Oberkochen, Germany) fitted for epifluorescence microscopy with a high-pressure mercury bulb and filter sets F31 (AHF Analysentechnik, Tübingen, Germany; D360/40, 400DCLP, D460/50, for DAPI detection) and F41 (AHF Analysentechnik; HQ535/50, Q565LP, HQ610/75, for Cy3 detection), respectively. Microorganisms were counted at 1000× magnification in 40 fields covering an area of 0.01 mm2 each [31]. Numbers were expressed as mean±S.E.M.
where V is the cell volume and a and b are the major and the minor axes, respectively, of the best fitting ellipsoid [32]. After determination of a mean cell biovolume, the total biovolume for microbial populations was determined using cell numbers obtained through visual counting. This was converted into biomass using the calibration factor of 310 fg C μm−3[33].
3 Results
3.1 Analysis of physico-chemical conditions
The chemocline of Lake Cadagno was located at a depth between 11 and 13 m at all sampling times, except for March when it was found at a depth between 12 and 14 m. Basic physico-chemical conditions were similar at all sampling times with high conductivity and sulfate values throughout the whole chemocline, low and rapidly declining oxygen concentrations and subsequently steeply increasing ammonium and sulfide concentrations (Fig. 1). Turbidity and light intensity profiles, however, differed between sampling times. Turbidity was high in October (approximately 57 FTU) indicating the presence of a well-developed plume of microorganisms. In March, a very low turbidity (<8 FTU) was measured, that slowly increased from June to August to values similar to that found in October (Fig. 1). Since the lake was covered by ice and snow (2 m) at the sampling in March, light reaching the chemocline was of much lower intensity than at the other sampling times (Fig. 1). After melting of the ice cover in June, about 10-fold higher light intensities reached the chemocline. Light intensity values, however, generally decreased steeply with depth (Fig. 1,Table 2). In contrast to March and June, the vertical attenuation coefficient (Kd) of photosynthetically available radiation was high in August and October indicating large absorption in the bacterial plume (Table 2). Kd values in the mixolimnion were low for both August and October samplings indicating good light transmission (Table 2). Light transmission through the mixolimnion was much lower in March as indicated by a higher Kd value. At this sampling time a Kd value of 2.46 m−1 in the bacterial layer suggested smaller microbial densities than in October or August (Table 2).

Physico-chemical characteristics of the chemocline of Lake Cadagno at the samplings in October 1998, March 1999, June 1999, and August 1999.
Vertical attenuation coefficient of photosynthetically available radiation Kd (PAR), calculated for the mixolimnion Kd (PAR, a) and the bacterial layer Kd (PAR, b) and scalar irradiance at the upper border of the bacterial layer (z1) E0 (PAR, z1) calculated for a normalized surface radiation of 1500 μE m−2 s−1
| Sampling | Kd (PAR, a) (m−1) | Kd (PAR, b) (m−1) | Sampling depth z1 (m) | E0 (PAR, z1) (μE m−2 s−1) |
| October 1998 | 0.38 | 3.11 | 11.4 | 4.2 |
| March 1999 | 0.61 | 2.46 | 13.1 | 0.3 |
| June 1999 | 0.57 | 2.14 | 11.4 | 2.2 |
| August 1999 | 0.38 | 6.66 | 11.6 | 5.8 |
| Sampling | Kd (PAR, a) (m−1) | Kd (PAR, b) (m−1) | Sampling depth z1 (m) | E0 (PAR, z1) (μE m−2 s−1) |
| October 1998 | 0.38 | 3.11 | 11.4 | 4.2 |
| March 1999 | 0.61 | 2.46 | 13.1 | 0.3 |
| June 1999 | 0.57 | 2.14 | 11.4 | 2.2 |
| August 1999 | 0.38 | 6.66 | 11.6 | 5.8 |
3.2 Microbial analysis
Enumeration of bacteria after DAPI staining or in situ hybridization with specific probes revealed large shifts in their spatio-temporal distribution. Numbers of DAPI-stained bacteria generally followed the turbidity profiles with maximum numbers obtained in October and August at a depth around 12 m (Fig. 2). In March and June, values were about one order of magnitude lower. Cells detected with probe GAM42a targeting members of the γ-subdivision of Proteobacteria and thus also detecting purple sulfur bacteria accounted generally for about 34% of the DAPI-stained bacteria. Their distribution profile was similar to that of the DAPI-stained cells (Fig. 2). The majority of these cells were detected with probes S453D and S453F targeting yet uncultured small-celled purple sulfur bacteria (Fig. 2). Probes targeting C. okenii (Cmok453), A. purpureus (Apur453), L. roseopersicina (Laro453), or green sulfur bacteria (GSB532, CHL441) generally detected numbers that were about one order of magnitude lower (Fig. 3). Populations comprising A. purpureus exhibited similar distribution profiles as population F with high numbers in October and August, but much lower numbers in March and June (Fig. 3). The other populations, however, displayed different seasonal distributions. Significant populations of C. okenii were only detected in October 1998, but not the following year. Populations of green sulfur bacteria that were only slightly higher than those for C. phaeobacteroides at all sampling times were detected in high numbers in August 1999 only (Fig. 3). In March, green sulfur bacteria were not detected, but they were present in June and October though in relatively small numbers (Fig. 3). In contrast to all other populations, populations comprising L. roseopersicina were found at all samplings in the same order of magnitude, even though numbers were smaller in March and June than in October and August (Fig. 3).
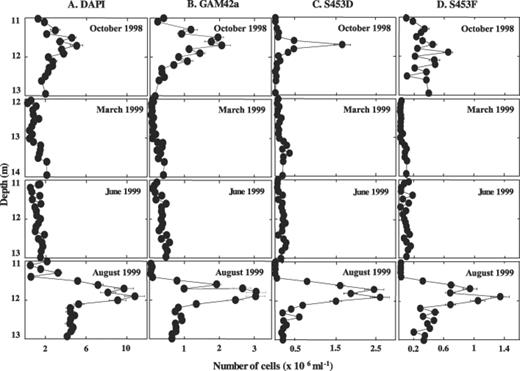
Number of cells stained with DAPI (column A) or hybridizing to probes GAM42a (column B), S453D (column C) or S453F (column D), respectively, in chemocline samples from Lake Cadagno from October 1998, March 1999, June 1999, and August 1999.
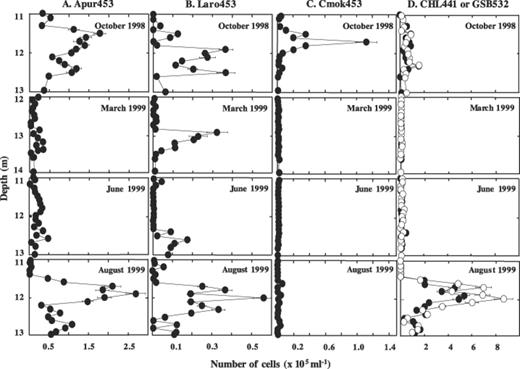
Number of cells hybridizing to probes Apur453 (column A), Laro453 (column B), Cmok453 (column C) or CHL441 and GSB532 (column D), respectively, in chemocline samples from Lake Cadagno from October 1998, March 1999, June 1999, and August 1999.
Determination of biovolumes within the phototrophic sulfur bacteria confirmed the differentiation between large-celled (55.8±3.6 μm3 cell−1) and small-celled (between 4.7±0.3 and 7.6±0.5 μm3 cell−1 in October) purple sulfur bacteria, and the comparably much smaller volume of the green sulfur bacteria (0.8±0.1 μm3 cell−1). Within the small-celled purple sulfur bacteria, populations detected with probes Apur453 and Laro453 were slightly larger with biovolumes (average of all samplings) of 8.65±0.55 and 8.45±0.65 μm3 cell−1, respectively, than cells detected with S453D and S453F (7.82±0.37 and 6.77±0.35 μm3 cell−1, respectively). Most of these populations showed only small seasonal changes in biovolumes. Cells detected with probe Laro453, however, almost doubled in volume in March and June compared to October samples.
Total biomass of phototrophic sulfur bacteria averaged over the whole chemocline increased between March and August by one order of magnitude from 6.33 to 61.37 mg C ml−1. In March, June and August, cells detected with probe S453D (population D) contributed most to the biomass accounting for 67, 58 and 62% of the biomass, respectively. At these times, population F contributed between 18 and 30% of the biomass, while the remaining populations accounted for about 10% (A. purpureus) or less (C. phaeobacteroides 0–1%, L. roseopersicina 1–6%, C. okenii 0%). In October, population F was most prominent with 41% of the biomass, followed by population D with 28%, C. okenii with 16% and A. purpureus with 13%. Due to their small number and size, cells detected with probe CHLP441 never constituted an important part of the bacterial biomass, always accounting for less than 1% of the total biomass averaged over the whole chemocline.
Fine scale analysis in 10-cm steps through the chemocline displayed differences in spatial and seasonal distribution of phototrophic sulfur bacteria in the chemocline (Table 3). In March and June when cell densities were low, most populations were relatively evenly distributed throughout the whole chemocline. At these times, biomass of phototrophic sulfur bacteria was mainly represented by that of population D (40–80%). Population F and A. purpureus generally accounted for the remaining biomass though biomass of L. roseopersicina was detectable at lower depths (Table 3). C. okenii and green sulfur bacteria were not present in significant amounts. Green sulfur bacteria were detectable throughout the chemocline in June, August and October generally in small percentages (usually 1–2%, occasionally up to 7% of the biomass of phototrophic sulfur bacteria) (Table 3).
Percentage of biomass of phototrophic sulfur bacteria in the chemocline of Lake Cadagno
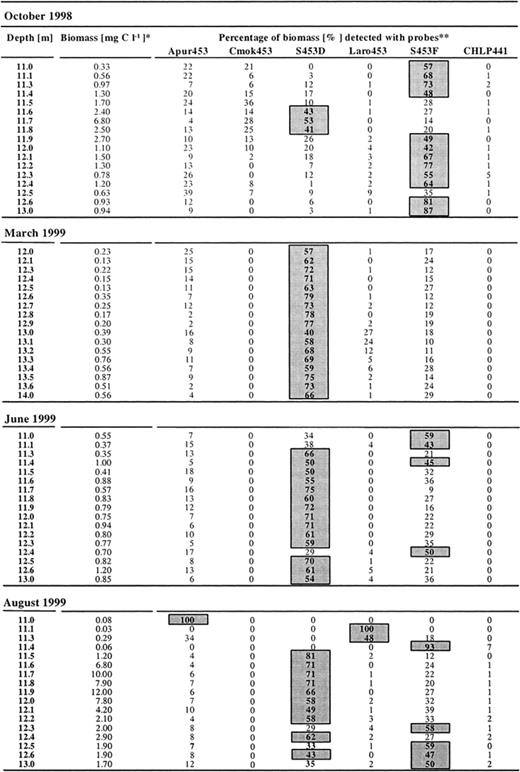
*Sum of specific biomasses determined after in situ hybridization with the respective probes Apur453, Cmok453, S453D, Laro453, S453F and CHLP441.
**Boxes indicate specific biomass values making up more than 40% of the total biomass of all phototrophic sulfur bacteria in the chemocline of Lake Cadagno.
Percentage of biomass of phototrophic sulfur bacteria in the chemocline of Lake Cadagno
*Sum of specific biomasses determined after in situ hybridization with the respective probes Apur453, Cmok453, S453D, Laro453, S453F and CHLP441.
**Boxes indicate specific biomass values making up more than 40% of the total biomass of all phototrophic sulfur bacteria in the chemocline of Lake Cadagno.
In August a clear microstratification of phototrophic sulfur bacteria was detected with A. purpureus making up 100% of the phototrophic sulfur bacteria at the upper border of the chemocline at a depth of 11 m, followed by 100% of L. roseopersicina at a depth of 11.1 m, and 93% of population F at a depth of 11.4 m. The remaining portion of the chemocline down to a depth of 13 m was then dominated by population D. In August, biomass of C. okenii was not present in significant amounts. In October, however, biomass of C. okenii made up a large portion of the biomass in the upper part of the chemocline (36% at 11.5 m), together with populations D and F, and to a lesser part A. purpureus (Table 3).
4 Discussion
In contrast to previous reports in which C. okenii and A. purpureus were described as key organisms of Lake Cadagno [20,21,34], our study demonstrated that, although both C. okenii and A. purpureus can make up significant portions of the phototrophic sulfur bacteria in the chemocline, these were dominated by yet uncultured populations designated D and F throughout the whole chemocline. Major factors supposed to determine both composition and distribution of phototrophic sulfur bacteria in bacterial layers as encountered in the chemocline of Lake Cadagno are intensity and quality of light, in addition to oxygen and sulfide concentrations [35–38].The light quality in the water column of Lake Cadagno has been extensively studied [5,11,37]. At the bacterial plume wavelengths ranging from 450 to 650 nm with a maximum at 570 nm are present in summer as well as in winter [5]. Light intensity, however, varied significantly during the year with lower intensities related to smaller populations of phototrophic sulfur bacteria as shown in our study. Light intensities also generally decreased within the chemocline by two orders of magnitude confirming results of previous studies [11].
Since green sulfur bacteria such as C. phaeobacteroides require strictly anoxic conditions [39], need only about one quarter of the light intensity of the purple sulfur bacteria in order to grow at comparable growth rates [40] and show different light absorption optima than purple sulfur bacteria [5], a microstratification of phototrophic sulfur bacteria with purple sulfur bacteria growing above green sulfur bacteria could be expected [40–42]. Green sulfur bacteria, however, were only detected when light intensities reaching the chemocline were relatively high (i.e. in June, August and October). At these times, they were distributed over the whole chemocline and thus encountered in a light intensity range from high to low and, similar to reports for other meromictic lakes [38], they were present at the same depths as purple sulfur bacteria. Populations of purple sulfur bacteria, however, were microstratified under these conditions. The different distribution profiles might be due to the fact that purple sulfur bacteria such as A. purpureus, L. roseopersicina or C. okenii are motile and thus have the potential to reposition themselves when environmental conditions change while non-motile green sulfur bacteria such as C. phaeobacteroides cannot. Although purple sulfur bacteria are the dominant group of phototrophic sulfur bacteria in the chemocline of Lake Cadagno, populations of green and purple sulfur bacteria co-exist in the same environment most obviously due to eco-physiological differences such as e.g. differences in light absorption spectra.
In addition to other physico-chemical conditions such as higher redox potential, higher oxygen or sulfide concentrations reported to favor growth of purple sulfur bacteria over that of certain green sulfur bacteria [38,43],metabolic properties might give purple sulfur bacteria growth advantages over green sulfur bacteria. Small-celled purple sulfur bacteria in the chemocline of Lake Cadagno form large cell aggregates with up to 900 cells and are associated with sulfate-reducing bacteria related to the genus Desulfocapsa[18]. D. thiozymogenes is able to grow by the oxidation of a limited range of organic compounds and by disproportionation of inorganic sulfur compounds [44]. Either sulfate reduction or disproportionation in association with aggregates of small-celled phototrophic sulfur bacteria might therefore overcome sulfide limitations of small-celled phototrophic sulfur bacteria during periods of intensive photo-oxidation.
The metabolic versatility of purple sulfur bacteria might also add to their superior competitiveness with green sulfur bacteria. Purple sulfur bacteria might be able to simultaneously oxidize sulfide and polysulfide [45] and have the capacity to grow chemolithotrophically [46,47]. Compared to green sulfur bacteria which are strictly anaerobic, obligate phototrophs, they are better adapted to the presence of oxygen and also much more versatile with respect to carbon resources [48,49].A. purpureus, for example, also grows under mixotrophic conditions with several organic compounds [46]. High concentrations of dissolved organic compounds (DOC; 1–4 mg l−1) have been reported at the upper border of the chemocline of Lake Cadagno with steep decreases with depth suggesting large production and consumption activity of DOC [50].
Different spatio-temporal distribution profiles were obtained for specific populations of purple sulfur bacteria. These were most pronounced for C. okenii and L. roseopersicina. C. okenii was only detected in significant numbers in October which is in agreement with previous observations on larger populations in late-summer and fall [9,51]. Their development might be impacted by day length since long dark periods were found to favor growth of large-celled purple sulfur bacteria in competition with small-celled purple sulfur bacteria [52].
In contrast to populations of other purple sulfur bacteria, cell densities of L. roseopersicina were in the same order of magnitude at all sampling times. The maximum abundance in October (3.7×10⁴ cells ml−1), for example, was not significantly different from that in March (3.2×10⁴ cells ml−1). Maximum abundance of L. roseopersicina was always detected below the other populations of purple phototrophic sulfur bacteria similar to that of green sulfur bacteria suggesting an adaptation of L. roseopersicina to low light conditions and relatively high sulfide concentration (ranging from 1.2 mg l−1 in October to 6–7 mg l−1 in March). Similar to green sulfur bacteria, however, the failure to become dominant under these conditions indicates an impact of other environmental conditions on populations of L. roseopersicina that essentially allows them to persist and increase biomass by increasing cell size but not to proliferate in the environment.
The most pronounced microstratification of populations of purple sulfur bacteria along environmental gradients of light, oxygen and sulfide was obtained in August when defined layers consisting entirely or almost entirely of one population of small-celled purple sulfur bacteria developed. A. purpureus at the upper border of the chemocline inhabits an environment characterized by high light intensities, the presence of oxygen although at low concentration, no sulfide and no ammonium. Just below the layer of A. purpureus, similar conditions, however with even less oxygen present, support the establishment of L. roseopersicina. Decreasing light intensity and oxygen concentrations as well as increasing sulfide concentrations characterize the environment almost entirely inhabited by population F at a slightly lower depth. Together with population D, population F makes up for most of the remaining purple sulfur bacteria within the chemocline, supposedly tolerating a large range of environmental conditions with steep gradients in light intensity from high to low, and increasing sulfide concentrations. Populations F seems to tolerate low concentrations of oxygen as indicated in October, while population D does not.
The differences obtained in the distribution profiles of specific populations of purple sulfur bacteria suggest eco-physiological adaptations to the steep physico-chemical gradients in the chemocline of Lake Cadagno. However, although different environmental characteristics such as light intensity (and supposedly quality), sulfide and oxygen concentrations were related to specific populations, these relationships only represent indications and have to be confirmed by defined pure culture studies. Such studies should also include biotic interrelationships and address questions on competition between different populations of phototrophic sulfur bacteria or synergism between small-celled purple sulfur bacteria and associated sulfate-reducing bacteria.
Acknowledgements
Mauro Tonolla and Sandro Peduzzi contributed equally to the study. This work was supported by grants from the Swiss National Science Foundation (SNSF) (NF31-46855.96), and the canton of Ticino (Switzerland). S.P.'s work at Rutgers University was supported by a fellowship from the SNSF Commission of the University of Lugano (81IT-59640). The authors are indebted to N. Ruggeri and A. Caminada for technical support.
References
