


Abstract
Methods that quickly assess microbial density and aggregation in soil and sediments are needed in environmental microbiology. We report a flow cytometry method that uses the green and orange emission of the fluorochrome SYTO-13 to discriminate between bacteria and clay–humic acid particles. This approach distinguishes single or clustered bacteria, and clusters of bacteria and abiotic particles during the growth of the biosurfactant-producing strain Pseudomonas aeruginosa 19SJ on solid phenanthrene in the presence of humic acid–clay complexes.
1 Introduction
Flow cytometry provides a direct and rapid means to determine the number, size and biochemical characteristics of cells [1,2]. However, direct flow cytometry analysis has limited application in soils and in aquatic systems with a high concentration of abiotic particles. The more particles and aggregates the sample contains, the greater the difficulty for flow cytometric analysis. Abiotic particles, such as clay minerals, may also interact with fluorochromes, which are supposedly cell-specific.
Pseudomonas aeruginosa induces cellular aggregates by producing rhamnolipid biosurfactants, which also increases the bioavailability of hydrophobic chemicals such as phenanthrene through pseudosolubilization at concentrations above the critical micelle concentration (CMC) [3]. Here we employed a flow cytometry method using the fluorochrome SYTO-13 to examine the growth of the biosurfactant-producing strain P. aeruginosa 19SJ on solid phenanthrene in the absence and presence of humic acid–clay complexes. Humic acids and clays affect the activity [4–6] and transport [7] of soil pollutant-degrading bacteria, and are also potential carriers of pollutants [8]. The method we report uses the green and orange emission of SYTO-13. It discriminates bacteria from abiotic particles and allows aggregation to be estimated. SYTO-13 has an affinity for nucleic acids and it is cell-permeable, so it can be used with both live and dead cells [9]. This approach provided a clearer picture of the ecological significance of bacteria and clay aggregation during the biodegradation of hydrophobic pollutants.
2 Materials and methods
2.1 Bacterial strain
P. aeruginosa 19SJ, a bacterium originally isolated from a petroleum-contaminated soil, was a gift of E. Déziel (Centre de Recherche en Microbiologie Appliquée, Université du Québec, Canada). This bacterium produces rhamnolipid biosurfactants when it is grown on phenanthrene as the sole source of carbon and energy [10]. The CMC of the rhamnolipids produced by this strain, as determined at 25°C with a TD1 Lauda ring tensiometer (Lauda, Germany), was 50 μg ml−1, at which a minimum tension of 35 mN m−1 was reached. The bacterium was stored at −80°C in glycerol and subcultured on tryptic soy agar (TSA) plates (ADSA-Micro, Spain), before being used as inoculum.
2.2 Humic acid–clay complexes
Stable associations of humic acids and clay were prepared by coating montmorillonite clay (Swy-2, University of Missouri-Columbia, Columbia, MO, USA, size <2 μm) with humic acids from soils neighboring Santa Olalla Lake (Doñana National Park, Huelva, Spain), following a previously described procedure [7]. The mass fraction of organic carbon contributed by the sorbed humic fraction in these model soil particles was 0.013, as determined by a Leco CHNS932 elemental analyzer (Leco, St. Joseph, MI, USA).
2.3 Biodegradation of solid phenanthrene
For biodegradation experiments with crystalline phenanthrene, the bacterium was grown at 25°C and 200 rpm in 250-ml Erlenmeyer flasks containing 100 ml of mineral SWF medium (pH 7) [10]. Per liter of distilled water, the medium contained 0.1 g CaCl2, 0.4 g MgSO4·7H2O, 2 g NaNO3, 0.9 g Na2HPO4, 0.7 g KH2PO4 and 2 ml of a filter-sterilized trace element solution containing 2 g of FeSO4·7H2O, 1.5 g MnSO4·H2O and 0.6 g (NH4)6Mo7O24·4H2O per liter. Humic acid–clay complexes were added at 1 mg ml−1 as appropriate. The sole source of carbon and energy was phenanthrene (Sigma-Aldrich Chemie, Steinheim, Germany), added to the sterilized media as sieved crystals (<500 μm) at 10 mg ml−1. No growth was observed when the bacterium was cultivated in the presence of complexes but without phenanthrene.
Biodegradation of phenanthrene was estimated indirectly by bacterial growth. Viable cells were quantified at time intervals as colony forming units (CFU) after serial dilution of culture samples in phosphate buffer (61.5% K2HPO4, 38% KH2PO4) and plating on TSA. Underestimation of the number of viable cells due to aggregation at later stages of growth was avoided by adding 10 μg ml−1 of Triton X-100 to the last dilution tube, which was placed on a rotary shaker operating at approximately 200 rpm for 5 min before plating. This procedure produced approximately 10% more CFUs from stationary phase cultures than untreated controls. The amounts of rhamnolipids in solution and associated with solids were measured in the supernatant and in the pellet, respectively, of separate samples that were centrifuged at 12 000×g for 10 min. The concentration of rhamnolipids was estimated as rhamnose equivalents with a modified orcinol method, after being extracted with diethyl ether and redissolved in a sodium bicarbonate solution [10]. The complete biodegradation of phenanthrene at the end of the experimental period was confirmed microscopically by the disappearance of phenanthrene crystals. Furthermore, stationary phase cultures were extracted with hexane and analyzed with a Waters (Millford, MA, USA) high-performance liquid chromatography system: 2690 separations module and 474 scanning fluorescence detector; column 3.9×150 mm Nova-Pak C18 (Waters, Eire); flow, 1 ml min−1; mobile phase, 60% acetonitrile 40% water; excitation wavelength, 248 nm; emission wavelength, 378 nm. The detection limit of this method was 2 ng ml−1.
2.4 Particle size analysis
Samples of the overnight bacterial cultures, clay–humic acid complexes and phenanthrene crystals were analyzed by a Coulter Multisizer II (Coulter Electronics, Luton, UK) using an aperture tube of 30-μm diameter. Cells and particles were suspended in 0.9% NaCl previously filtered through 0.2 μm. Particles passed one by one through the Coulter orifice, in which cell volume was measured electrically. The coincidence count was maintained below 2% in order to obtain information about the concentration and size distribution of the bacteria, complexes and crystals. Data were analyzed by the standard AccuComp software of the equipment.
2.5 Flow cytometry, staining and sorting
Flow cytometry was performed using a Coulter Epics Elite (Coulter, Miami, FL, USA) equipped with a 15-mW air-cooled 488-nm argon-ion laser set up with the standard configuration. Fluorescent beads (1 μm Fluoresbrite carboxylate microspheres, Polysciences Inc., Warrington, PA, USA) were used as an internal standard for scatter and fluorescence. The forward scatter (FS) detector in the Elite flow cytometer is a photodiode which collects light between 1.5° and 19° from the laser axis and discriminates latex particles >0.5 μm in diameter. The side scatter (SS) detector is situated at right angle to the laser axis. Samples fixed with paraformaldehyde (0.2% final concentration) were stained with 2.5 μM (final concentration) of the nucleic acid stain SYTO-13 (Molecular Probes), using frozen stock DMSO solutions at 500 μM. The green emission from SYTO-13 was collected through a 525-nm band-pass filter and the orange emission was collected through a 575–625-nm band-pass filter after excitation at 488 nm. Samples were vigorously vortexed and incubated in the dark at room temperature for 30 min prior to flow cytometric analysis. Data were analyzed with Elitesoft version 4.1 (Coulter) and WinMDI version 2.8 software (Windows Multiple Document Interface, a flow cytometry application; build #05 03–09–1999, ©1993–1998 Joseph Trotter, The Scripps Research Institute). The Epics Elite Autoclone sorting option, a programmable single-cell deposition system, was used to sort a defined number of particles to be observed microscopically.
2.6 Microscopic observations
Microscopic examination of sorted particles was performed using a Jenamed 2 fluorescence microscope (Carl Zeiss, Jena, Germany) with a 12.5×Apochromat objective (0.35 ∞/0.17 A) and 10×oculars. Fluorescence was produced using a 50 W-Hg arc lamp with a BPF 510 filter combination. Phase contrast microscopy (Leica DMRB, Wetzlar, Germany) images were captured with a CCD camera at a resolution of 782×580 pixels using Metamorph version 4.2 software (Universal Imaging).
3 Results
3.1 Discriminatory power of microscopy, particle analysis and flow cytometry
Fig. 1 shows the various particles used in this study and their different forms of aggregation as observed by phase contrast microscopy. P. aeruginosa 19SJ cells displayed variable morphology depending on the cell cycle phase and aggregation. The predominant forms during growth were elongated rods (Fig. 1A), but coccoid forms predominated during the stationary phase (data not shown). Phenanthrene crystals differed microscopically from the clay–humic acid complexes by their higher refringency and larger size (Fig. 1B); clay–humic acid complexes were not refringent and showed variable aggregation (Fig. 1C). When bacteria, clay–humic acid complexes and phenanthrene crystals were incubated together, aggregates of different size and composition formed (Fig. 1D,E).

Phase contrast microscopy of P. aeruginosa 19SJ (A), phenanthrene crystals (B), clay–humic acid complexes (C), aggregates of bacteria and phenanthrene without clay–humic acid complexes (D) and with clay–humic acid complexes (E). Magnification ×2500.
Discrimination between Pseudomonas cells, clay–humic acid complexes and phenanthrene crystals was not achieved by particle size analysis (using the Coulter multisizer), nor by flow cytometry in fresh non-stained suspensions (data not shown). Consequently, prior staining was necessary.
3.2 Cytometric approach after SYTO-13 staining
Cytometric analysis of fluorescence emitted by the growth media, phenanthrene, clay–humic acid complexes and P. aeruginosa 19SJ cells after SYTO-13 staining revealed that the cultured bacteria produced the highest green fluorescence. Clay–humic acid complexes and phenanthrene crystals were also easily detected and were slightly stained by SYTO-13, yielding green and orange emission (at 575 and 625 nm, respectively). Because the bacteria were characterized by highly fluorescent green emission but not orange fluorescence, the SYTO-13 staining allowed to us to discriminate between bacteria by green fluorescence and abiotic particles by low orange emission. This was verified by microscopic examination of sorted samples (see Figs. 2Figs 3).
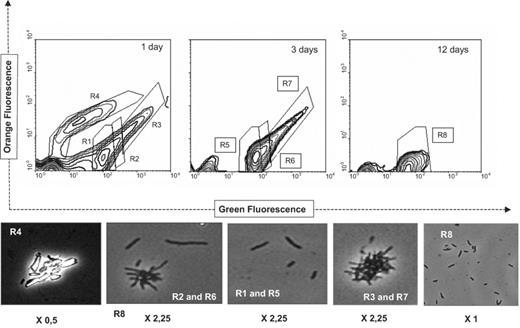
Growth of P. aeruginosa 19SJ on solid phenanthrene in the absence of clay–humic acid complexes. The number of days of incubation is given in the upper right-hand corner of the histograms. The defined gates (R1–R8) in the histogram were subject to phase contrast microscopy after sorting (below): R1 and R5 are single bacteria; R2 and R6, small bacterial aggregates and medium-sized filaments; R4, phenanthrene crystals; R3 and R7, aggregates of phenanthrene crystals and bacteria; R8, single small bacteria. Magnification is 2500× the factor shown below each picture.

Growth of P. aeruginosa 19SJ on solid phenanthrene in the presence of clay–humic acid complexes. Legend is as Fig. 2. Gates R9, R10 and R11 were medium, large and small aggregates, respectively, that comprised bacteria, phenanthrene crystals and clay–humic acid complexes. Magnification is ×2500.
3.3 Flow cytometric analysis during growth on solid phenanthrene
To validate the discriminatory ability of the cytometric method, a set of time-course phenanthrene biodegradation experiments were carried out with P. aeruginosa 19SJ. This system was used because as the solid phenanthrene was biodegraded, the proportion of abiotic particles to bacterial biomass and the concentration of biosurfactants were expected to change. Both in the presence and absence of clay particles the bacterium grew exponentially during the first three days (Fig. 4). Growth stopped after nine days in the absence of complexes (Fig. 4A), with a maximum growth density of 1.99×10⁹ cells ml−1, and the death phase started after 14 days. The presence of suspended complexes caused the growth to be extended for a further 11 days (Fig. 4B), raising the final microbial biomass to 5.24×10⁹ cells ml−1, and the death phase was less apparent. The production of rhamnolipids from solid phenanthrene was approximately linear, and extended beyond the period of active growth. The rhamnolipids CMC (50 μg ml−1) was surpassed in culture supernatants at the late exponential phase of growth, reaching an average final concentration in solution of 110 μg ml−1 without complexes, and 143.4 μg ml−1 in the presence of complexes.
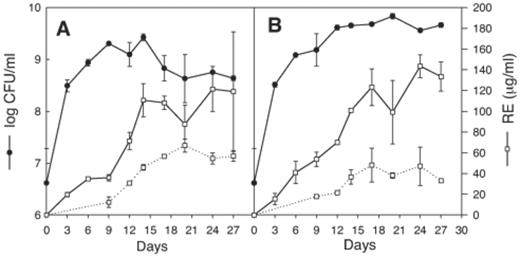
Time course of bacterial growth and biosurfactant production in phenanthrene-degrading cultures of P. aeruginosa 19SJ in the absence (A) and presence (B) of humic acid–clay complexes. ●: growth measured as exponential CFU ml−1; ◻: production of rhamnolipids estimated as rhamnose equivalents in solution (solid line) and associated with particulate material (dashed line). Error bars represent one standard deviation of duplicate measurements.
Fig. 2 shows the cytometric analysis of culture samples at 1, 3 and 12 days of growth without complexes (corresponding to Fig. 4A). Subpopulations of single cells, abiotic particles and aggregates could be discriminated on the basis of green and orange fluorescence (into gates R1–R8, Fig. 2). They were subsequently verified by microscopy after sorting. Two bacterial subpopulations (gates R1, R5 and R8), discriminated by their green fluorescence, consisted of individual small bacteria. Gates R2 and R6 were bacterial clumps with some long bacteria. Gate R4 contained phenanthrene crystals and their aggregates, and gates R3 and R7 comprised aggregates of bacteria and phenanthrene crystals. In the experimental conditions used in this study, green fluorescence particles after SYTO-13 staining were considered to contain bacteria and they represented 90% of the total number of particles in these samples.
Cytometric analysis complemented by microscopy of the sorted gates after the first three days of incubation indicated that bacteria had the highest green fluorescence. The aggregates composed of phenanthrene crystals (gate R4) disappeared. This is significant, since solid phenanthrene was still present, as approximately 10% of the compound had been consumed at that time (estimated by CFU counts). This residual solid phenanthrene was not detected by flow cytometry, probably because scatter values were close to the detection limit. In contrast, gate R3, which consisted of clusters of bacteria and phenanthrene crystals, was still relatively abundant after three days of incubation (gate R7), indicating that P. aeruginosa 19SJ showed a tendency to clump during the first days of growth on phenanthrene. This aggregation occurred when biosurfactant levels in solution were still below the CMC (Fig. 4A). However, the relative predominance of stained particles in gate R5, which represents suspended single bacteria, suggests that, during that period, biodegradation of phenanthrene occurred mainly in the aqueous phase as a result of the dissolution of the compound and not directly at the water–crystal interface by means of adhered bacteria. The stationary phase, which began when the carbon source had been completely consumed, occurred on day 12, and coincided with the losses of the bacterial aggregates observed in gate R7 (Fig. 2). At this time the size of single bacteria also diminished significantly (data not shown). Mean values of fluorescence emission and percentages of labeled particles decreased progressively to 63.6% after 27 days, possibly as a result of the cellular reduction in the nucleic acid content concomitant with stationary and dead phases.
After one day of growth in the presence of humic acid–clay complexes (corresponding to Fig. 4B), the extensive formation of aggregates caused the histograms to be homogeneous (Fig. 3, gate R9). Sorted samples showed that aggregates with low numbers of single cells predominated. The high capacity of humic fraction–clay complexes to form aggregates with phenanthrene crystals and bacteria induced homogeneous and undifferentiated cytometric distribution to continue during the first three days of growth (not shown). After the sixth day of incubation, the bacterial population could be differentiated into two regions according to their green versus orange emission (Fig. 3, gates R10 and R11). Gate R10 contained larger aggregates than gate R11.
4 Discussion
We present a new method for the discrimination in flow cytometry of bacterial cells, humic acid–clay complexes and phenanthrene crystals by the detection of green and orange fluorescence from SYTO-13 staining. The validity of these measurements was confirmed by microscopy after droplet sorting and size analysis. Fig. 3 indicates that the bacteria participated in the formation of aggregates with humic acid–clay complexes, providing evidence of surface contact between these two types of particles. The high scatter values and low green fluorescence emission of the aggregates suggest that the green fluorescence emission was partially blocked when bacteria adhered to complexes. Two mechanisms may explain this effect: (i) the fluorochrome has a chemical specificity that is counteracted by of the physical affinity (absorption, clustering, etc.) between the fluorochrome and the humic acid–clay complexes, and (ii) the humic acid–clay particles partially covered the cell surface and hampered fluorochrome uptake by the bacteria. In spite of this limitation, there was a consistent discrimination of bacteria-containing aggregates (gates R2, R3, R6, R7, R9 and R10) from those formed only by complexes and phenanthrene crystals (gate R4) with the different cell densities originated by growth-linked biodegradation of phenanthrene. This indicates the potential of this new flow cytometric method for identifying bacterial populations in suspensions with relatively high loads of abiotic particles.
The experimental system we used to verify the method allowed us to analyze particle distribution with a progressive increase in the concentration of rhamnolipid biosurfactants synthesized by P. aeruginosa. These surface-active molecules may have affected the system in two ways. Firstly, bacteria may degrade hydrophobic compounds faster by producing surface-active molecules that, above CMC levels, accelerate the mass transfer of the compounds into the aqueous phase [11]. P. aeruginosa 19SJ excreted biosurfactants when it was grown with phenanthrene at levels that may have helped the compound to dissolve, thereby constituting an additional carbon input to that resulting from abiotic dissolution. This happened even in the presence of humic acid–clay complexes, which is remarkable because these soil colloids constituted a significant proportion of the total abiotic surfaces. These particles would theoretically have induced a decrease in the concentration of the biosurfactant in solution due to sorption processes [12]. On the other hand, rhamnolipids may also have affected cell aggregation during growth on phenanthrene. Indeed, flow cytometry showed a progressive increase in the number of aggregates throughout growth, both with and without complexes. The effect of rhamnolipids on bacterial aggregation is attributable to the increased cell hydrophobicity following exposure to these biosurfactants. In P. aeruginosa these substances remove lipopolysaccharides from the outer membrane of the cell, thereby enhancing cell surface hydrophobicity and favoring direct interaction with hydrophobic substrates [13,14]. However, in our study, adhesion to phenanthrene crystals was only observed at very late stages of growth. The association between cells and humic acid–clay complexes was evident from the initial periods. This is remarkable, because the interaction of bacterial cells with humic acids adsorbed onto clay particles is not favorable, as was shown for several polycyclic aromatic hydrocarbon degraders in saturated column experiments [7]. In our work, rhamnolipids detected at significant levels during growth with phenanthrene may have mediated this direct interaction.
The flow cytometric application based on SYTO-13 staining provides a new method to examine the microbial ecology of soil, sediment and sludge, including those processes involving the interaction of bacteria with solid pollutants. However, because calibration with internal and external standards was lacking, the method could not be used in this study to quantify the concentration of bacteria or aggregates. Further studies are needed to determine whether it can be applied quantitatively when mixtures of microorganisms are present in complex matrices such as soils and sediments.
Acknowledgements
Support for this research was provided by the European Union (Contract BIO4-CT97-2015) and Spanish CICYT (Grant BIO97-1960-CE).
References
