


Abstract
The effect of competition for macroelements with bacteria from ditch water on the parathion-hydrolyzing Flavobacterium sp. ATCC 27551 (FB) was investigated within mixed continuous cultures under carbon-, nitrate- or phosphate-limited conditions. The high initial rate of parathion hydrolysis decreased rapidly in all cultures due to the loss of strain FB. Addition of 2-isopropyl-6-methyl-4-pyrimidinol (a selective source of carbon, nitrogen and energy for FB) to one nitrate- and carbon-limited chemostat caused a 20-fold increase in parathion-hydrolyzing activity compared to unamended control cultures and retention of FB. The presence of the parathion hydrolase-encoding gene could be demonstrated by a newly developed PCR detection method in all FB cultures during most of the cultivation period. These results suggest that competition effects cause the pesticide-degrading capacity of microbial communities depending on their frequency of exposure to the pesticide compounds.
1 Introduction
The majority of pesticides used in The Netherlands are easily biodegradable (half-life in fresh water <30 days), but 80% of the compounds previously investigated were nevertheless detected in Dutch surface water in a monitoring program carried out between 1988 and 1994 [1]. For example, the organophosphorus insecticide diazinon was detected in approximately 50% of the surface water locations investigated between 1989 and 1994 in The Netherlands. In five of these studies the highest measured concentration was at or above 1.1 μg l−1, the 96-h LC50 value for the caddisfly Cyrnus trimaculatus[2], which implies that pesticides occurring at these concentrations in Dutch surface water may influence insect populations.
In areas of intensive agriculture, pollution of surface water with pesticides usually coincides with a high input of inorganic nutrients such as ammonium, nitrate and phosphate. In Western European countries, a large fraction of the total emission of nitrogen and phosphorus is caused by agricultural activity [3]. An investigation of the agricultural input of nitrate and phosphate into surface waters [4] revealed that between 140 and 740 mol nitrate ha−1 found its way to water courses, resulting in average nitrate concentrations of 300–400 μM in the nearby river. Like nitrate, the average phosphate concentration (25–50 μM) in this river varied within the growing season, reaching a maximum during the autumn period. In Flevoland province in The Netherlands, total P and N concentrations measured in agricultural ditches and field channels were 5–68 μM and 64–860 μM, respectively [5]. Pesticide biodegradation was also investigated in that study, using simazine, mecoprop, 4-chloro-2-methylphenoxyacetic acid (MCPA) and aldicarb as model compounds. There appeared to be a dramatic difference (up to three orders of magnitude) in the first order transformation rates calculated for a particular pesticide in surface water collected at different locations. Thus, some property of the particular surface water is usually the rate-limiting factor in the process of removal of pesticide contamination from surface waters in agricultural areas.
The highest possible rate of pesticide degradation is likely to occur when the pesticide promotes its own biodegradation by supplying a nutrient that is limiting for growth of the responsible microorganisms, a phenomenon known as ‘accelerated biodegradation’[6]. In order for biodegradation of a given pesticide to occur at a high rate, the responsible microorganisms must be able to compete for nutrients even in its absence, since most pesticides are only occasionally present at detectable levels [1,5]. Since it has been demonstrated that biodegradation of simazine [7,8], mecoprop [9,10], MCPA [9,11] and aldicarb [12,13] may support microbial growth, a possible explanation for the differences in degradation rate observed by Vink and van der Zee [5] is the local presence of microbial degradative activity of the pesticide. The degrading activity, however, not only depends on the presence of microbes capable of degrading the specific compound but also on the expression level of the enzymatic machinery involved. This expression may either be constitutive or be subject to regulation.
In this investigation, we tested the hypothesis that in the absence of a specific selective advantage, microorganisms capable of pesticide degradation will disappear from the ecosystem as a result of competition for macroelements with other microbial species. Our prediction was that after the introduction of a specific microbial activity that causes a high in situ biodegradation rate, this biodegrading activity would normally decrease relatively rapidly as a result of interspecies competition. The most likely chemical elements to be available in a proportionally insufficient quantity in microbial ecosystems are the macroelements C, N and P. We therefore devised a continuous culture system to investigate the competitive success of pesticide-degrading bacteria with microorganisms originating from an agricultural ditch under different macroelement limitations. Chemostats inoculated with either ditch water alone or with ditch water and the organophosphorus insecticide-degrading bacterial strain Flavobacterium sp. ATCC 27551 (FB) were investigated for their parathion-hydrolyzing activity in the course of 6 weeks of cultivation.
The cell-bound phosphotriesterase activity was measured during the course of the cultivation period in bacterial cell samples retrieved from the cultures as a measure of the abundance of FB. We thus tested whether FB could successfully compete for the growth-limiting macronutrient with bacteria from an agricultural ditch in the absence of pesticides. In the absence of a pesticide that may serve as a source of C, N or P for FB this strain does not have any competitive advantage over the species present in the ditch water sample. However, FB can grow on the diazinon hydrolysis product 2-isopropyl-6-methyl-4-pyrimidinol (IMP) as a sole source of carbon, nitrogen and energy (W.W. Sprenger, unpublished observation). The effect of continuous addition of IMP (10 mg l−1 via the medium supply) to one carbon- and one nitrogen-limited mixed continuous culture on the abundance of FB was therefore also investigated.
2 Materials and methods
2.1 Source of chemicals and bacteria
Ethyl parathion (99.2% pure) and IMP (99% pure) were purchased from Chem Service (West Chester, PA, USA). Cycloheximide was purchased from Aldrich (Zwijndrecht, The Netherlands). Protein reagent was purchased from Bio-Rad (Hercules, CA, USA). Phosphate test and nitrate assay kits (‘Spectroquant’) were from Merck (Darmstadt, Germany). Yeast extract and peptone tryptone (pancreatic casein digest) were from Difco (Detroit, MI, USA). Bacterial alkaline phosphatase (APase) (from Escherichia coli) and 4-nitrophenyl phosphate were purchased from Sigma (St. Louis, MO, USA). All other chemicals used were of analytical grade and were purchased from Sigma, Merck, Acros Organics (Geel, Belgium) or BDH Lab Supplies (Poole, UK). FB was obtained from the American Type Culture Collection (Manassas, VA, USA). Surface water used for inoculation was collected at the Vuursteentocht, a 6 m wide agricultural ditch in Flevoland, The Netherlands, on 6 November 2000 using a presterilized 10-l glass bottle.
2.2 Cultivation of bacteria
FB was routinely cultured in 25 ml batch culture in 100-ml Erlenmeyer flasks (26°C, 100 rpm) in a rotary shaker on Luria–Bertani medium (10 g peptone tryptone, 5 g yeast extract and 10 g NaCl per liter of de-ionized water) or on the mineral medium below without nitrate but with 250 mg l−1 of IMP as a sole source of nitrogen, carbon and energy for growth. For growth on solid media, 20 g l−1 of agar was added. Continuous cultures (chemostats) consisted of a double-walled glass vessel thermostatically temperature-regulated at 20°C by a water mantle connected to a water bath. Filter-sterilized air was supplied at 20 ml min−1 and cultures were stirred by a magnetic stirring bar at 500 rpm. The culture vessel volume was 350 ml and the dilution rate was 0.39±0.02 day−1. On 6 November 2000, surface water was collected and the in situ water temperature and pH were measured. After transfer to the laboratory, 350-ml portions of the surface water were transferred to each culture vessel and incubated at 20°C for 89 h with aeration (20 ml−1) and mixing by stirring at 500 rpm before the medium pump was switched on. FB was added to two carbon-limited, two nitrogen-limited and one phosphorus-limited continuous cultures. Two carbon-limited, two nitrogen-limited and one phosphorus-limited continuous cultures were inoculated with surface water only as controls. The cultures were covered with aluminum foil to prevent phototrophic growth. Biofilm formation on the glass vessels’ surface was removed regularly by means of an aquarium magnet and the stirrer bar inside the vessel.
2.3 Growth medium composition
The medium concentration of either carbon sources, nitrate or phosphate was lowered in each culture in order to impose a particular macroelement limitation of growth to the mixed bacterial culture. The medium contained carbon, nitrogen and phosphorus in a molar ratio of 100:51:203 under carbon-limited conditions, 100:3.4:68 under nitrogen-limited conditions and 100:16.9:0.14 under phosphorus-limited conditions (not including the macroelements present as N2 and CO2 in the sterile air flow and in the vitamins, trace elements, cycloheximide and Tris buffer solutions). Values between parentheses correspond to this lowered concentration. The carbon sources were 2 mM (0.67 mM) sodium acetate, 0.7 mM (0.233 mM) glucose, 0.6 mM (0.2 mM) sodium benzoate, 0.35 mM (0.117 mM) sodium citrate, 0.15 mM (50 μM) sodium salicylate in the following mineral medium: 2.5 mM (0.5 mM) KNO3, 10 mM (20 μM) KH2PO4/K2HPO4 buffer, pH 7.5, 93 μM Na2SO4, 3.6 μM CaCl2, 4.2 μM MgCl2, 16 μM KCl, 1 ml vitamins solution, 1 ml trace elements solution and 20 mg l−1 cycloheximide. In the case of phosphate limitation, 10 mM Tris–HCl, pH 7.5 (1,1,1-tris-hydroxymethyl-aminomethane) was added to ensure sufficient pH buffering capacity. Glucose, cycloheximide and vitamins were added from sterile stock solutions after autoclaving the media for 20 min at 120°C. The trace elements solution contained 0.1 mM ZnSO4, 0.1 mM MnSO4, 0.1 mM H3BO3, 0.2 mM CoCl2, 0.5 mM CuCl2, 50 μM NiSO4, 0.5 mM NaMoO4, 1 mM FeSO4 and 6 mM sodium citrate. The vitamins solution contained 20 mg l−1 folic acid, 20 mg l−1 biotin, 100 mg l−1 pyroxidine, 50 mg l−1 thiamine·2H2O, 50 mg l−1 riboflavin, 50 mg l−1 nicotinamide, 50 mg l−1 Ca-d-pantothenate, 50 mg l−1, vitamin B12, 50 mg l−1p-aminobenzoic acid and 50 mg l−1 lipoic acid.
2.4 Molecular detection of the organophosphorus hydrolase gene
Specific amplification of the parathion hydrolase-encoding gene was carried out by designing specific PCR primers and assessing the size of two independently amplified PCR products with DNA isolated from the culture pellets as a template by agarose electrophoresis. The nucleotide sequence of the gene encoding the parathion hydrolase from FB was retrieved from the EMBL database (accession number M29593) and three forward and four reverse PCR primers were designed to yield 11 possible primer combinations with predicted amplified DNA fragments between 153 and 663 bp (Table 1). The specificity of the PCR amplification procedure was assessed by using total nucleic acid from FB as a template with each primer combination and analyzing the size of the amplified gene fragment by agarose gel electrophoresis. Detection of the parathion hydrolase gene in DNA isolated from the continuous cultures was carried out with two separate amplifications, with forward primer F196 and with reverse primers R603 and R840, respectively. The detection of the expected 426- and 663-bp fragments with these two combinations by agarose gel electrophoresis confirmed the presence of the parathion hydrolase-encoding gene in the culture sample pellet. Total DNA from FB served as a positive control; a negative control consisted of an identical PCR amplification reaction without added template.
Sequence of PCR primers designed to amplify specific gene fragments of the parathion hydrolase-encoding gene of FB or other parathion-degrading bacteria present in the mixed continuous cultures derived from surface watera
| Name | Nucleotide sequence | Size of PCR product (bp) | ||
| with F196 | with F225 | with F450 | ||
| F196 | 5′-CGCGTCCTATCACAATCTC-3′ | X | X | X |
| F225 | 5′-TTTCACACTGACTCACGAGG-3′ | X | X | X |
| F450 | 5′-CGCCACTTTCGATGCGAT-3′ | X | X | X |
| R468 | 5′-TCGCATCGAAAGTGGCGG-3′ | 290 | 262 | X |
| R603 | 5′-ACACTAACTCCTGAAAGGGG-3′ | 426b | 398 | 153 |
| R757 | 5′-TCAGTATCATCGCTGTGACC-3′ | 580 | 552 | 308 |
| R840 | 5′-CTTCTAGACCAATCGCACTG-3′ | 663b | 635 | 391 |
Names consist of the letter F (forward) or R (reverse) followed by the number of base pairs in the gene sequence between the first base of the initiation codon and the nucleotide to which the 5′ nucleotide of the primer is complementary. The right three columns list the expected fragment size of the reverse primers in combination with each of the three forward primers. The combination of F450 and R468 was not investigated since these two primers are complementary to the same region of the gene.
Fragments used to screen DNA for parathion hydrolase gene.
2.5 Analytical procedures
2.5.1 General
Culture fluid was retrieved aseptically from the cultures with a heat-sterilized Pasteur pipette connected to a 60-ml syringe with silicone tubing and immediately stored on ice. Bacterial cells were collected by centrifugation and the culture supernatant was stored on ice. Bacterial cell suspensions were washed and resuspended in APase buffer (25 mM Tris–HCl, pH 7.5, 10 mM MgCl2) and stored on ice. Cell pellets for isolation of bacterial DNA were stored at −20°C until use. All assays were carried out at room temperature.
2.5.2 Cell-bound APase activity
The assay mixture contained 0.5 mM of 4-nitrophenyl phosphate and a dilution of bacteria in APase buffer. The rate of formation of 4-nitrophenol was monitored at 410 nm assuming an ε410 of 12 mM−1 cm−1. In case of a high activity, the reaction was monitored continuously in a spectrophotometer cuvette, but at lower activities the incubation mixture was centrifuged and the final absorption at 410 nm was measured against a blank sample (without bacteria) after 1–3 days of incubation. E. coli APase served as a positive control.
2.5.3 Parathion hydrolase activity
The assay mixture contained 100 μl of 400 mg l−1 ethyl parathion in methanol and 900 μl of APase buffer. The rate of formation of 4-nitrophenol was monitored as described above. A pure culture of FB served as a positive control.
2.5.4 Phosphate
Potassium phosphate standard or culture supernatant (230 μl) was added to 770 μl of freshly prepared phosphate test reagent (Merck) and the absorption at 550 nm was measured after 15 min of incubation. Potassium phosphate solutions of known concentrations served as standards. The detection limit was approximately 10 μM phosphate.
2.5.5 Nitrate
Sample (290 μl) was added to 960 μl of freshly prepared nitrate reagent (Spectroquant, Merck). Standards and samples were incubated for 30 min and the absorption at 515 nm was measured, using NaNO3 solutions of known concentrations as standards. The detection limit was approximately 50 μM nitrate.
2.5.6 Glucose
Sample (200 μl) was added to 1 ml of Trinder reagent (Sigma) and incubated for 30 min. The extinction was measured at 515 nm, and the detection limit was 25 μM glucose.
2.5.7 Protein
Bacterial protein was measured with the Bio-Rad Dc Protein assay in the following manner. To a cell sample of 200 μl, 100 μl of 20 g l−1 sodium lauryl sulfate and 100 μl of 600 mM KOH was added to lyse bacteria. Bovine serum albumin samples treated in the same way served as standards. The assay was carried out according to the manufacturer's instructions and samples were centrifuged to remove cell debris before measuring the absorption at 750 nm.
2.5.8 Culture turbidity
The optical density at 400 nm was measured for dilutions of resuspended bacterial pellets from the continuous culture in APase buffer.
2.5.9 Molecular analyses
For DNA extraction, 8 ml of culture samples were centrifuged for 5 min at 2000×g. Cell pellets were collected in 2-ml microcentrifuge tubes. To lyse the cells, 0.5 g of zirconium beads (0.1 mm diameter), 0.5 ml TE buffer (10 mM Tris–HCl, pH 7.6, 1 mM EDTA) and 0.5 ml buffered phenol (pH 7–8, Invitrogen Life Technology, Carlsbad, CA, USA) were added to the tubes containing the cell pellets and the tubes were vigorously shaken (5000 rpm) on a Mini Bead beater (Biospec Products, Bartlesville, OK, USA) for 2 min with intermittent cooling on ice. The tubes were then centrifuged for 5 min at 10 000×g and the upper (aqueous) phase was collected and extracted twice with phenol–chloroform–isoamyl alcohol (25:24:1 by volume). The DNA was then precipitated by adding one tenth volume of 3 M sodium acetate (pH 5) and two volumes of 96% (v/v) ethanol, 2 μl of glycogen solution (20 mg ml−1) and centrifuging for 30 min at 14 000×g. Finally the DNA was dissolved in water. The extracted DNA was subjected to PCR amplification in a 25-μl reaction mixture containing 10 mM Tris–HCl pH 8.3, 50 mM KCl, 0.01% w/v gelatin, 200 μM of each deoxynucleotide, 1.5 mM MgCl2, 2.5 units of Taq DNA polymerase (Life Technologies, Breda, The Netherlands), 400 μg ml−1 bovine serum albumin, 0.5 μM of each primer (Isogen, Maarssen, The Netherlands) and approximately 100 ng of purified DNA. The cycling conditions were as follows. First, a preincubation at 94°C for 5 min, then 35 cycles of 94°C for 1 min, 55°C for 1 min and 72°C for 1 min, and a final incubation at 72°C for 5 min. PCR products (153–663 bp) were checked through electrophoresis (agarose 1.5%, 2 V cm−1).
3 Results
3.1 Growth of mixed cultures under carbon, nitrate and phosphate limitation
Fig. 1 shows the mean concentrations of glucose, nitrate and phosphate measured in the carbon-, nitrate- and phosphate-limited mixed continuous cultures. In the four carbon-limited cultures, glucose (Fig. 1A) was always below the limit of detection (15 μM). In the other cultures, residual glucose (supplied at 0.7 mM in the growth medium) was sometimes present. It should be noted that in all cultures, the growth medium also contained acetate, citrate, benzoate and salicylate as additional carbon and energy sources. Nitrate (Fig. 1B) was detectable (0.5 mM) in the surface water used for inoculation, but in the four nitrate-limited cultures, nitrate was no longer detectable (<50 μM) from the first sampling 68 h after switching on the medium supply pump. In the carbon- and phosphate-limited cultures the average nitrate concentration was lower than 2.5 mM during the whole period, indicating that significant bacterial consumption of nitrate occurred also in these cultures. Fig. 1C shows the residual concentration of phosphate in the cultures. No phosphate could be detected under phosphate limitation. The amount of phosphate supplied in the medium (20 μM) was just above the limit of detection (10 μM). In the carbon- and nitrate-limited chemostats phosphate (10 mM) was evidently supplied to the cultures in excess. Since nitrate (Fig. 1B) and occasionally glucose (Fig. 1A) could be detected in the phosphate-limited cultures and since the molar ratio of phosphate per carbon supplied was only 0.0014:1, growth of the mixed bacterial culture on the medium with proportionally less phosphate was concluded to be controlled by the amount of phosphate. Fig. 2 provides an additional indication that the cultures that received less phosphate were limited by this macronutrient. The specific cell-bound activity of APase was consistently about 10-fold lower in the other cultures that contained 10 mM of phosphate in the growth medium.
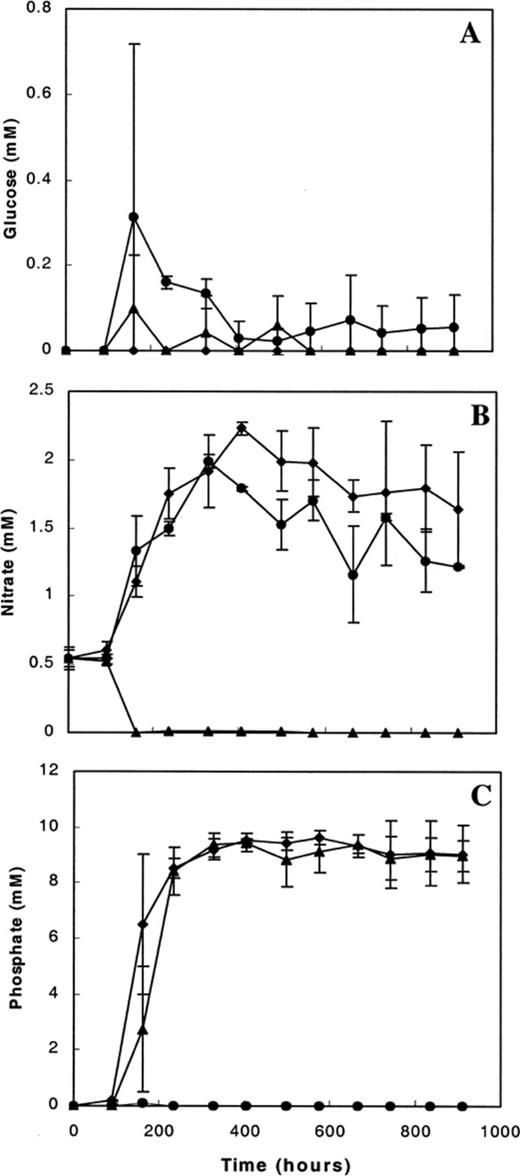
Residual concentrations (mean±S.D.) of glucose (A), nitrate (B) and phosphate (C) in the mixed continuous cultures during the course of cultivation. The medium pump was started at 89 h after transfer of the surface water to the culture vessels. The average residual concentration measured in the four carbon-limited (diamonds), the four nitrate-limited (triangles) and the two phosphate-limited (circles) mixed continuous cultures is shown.
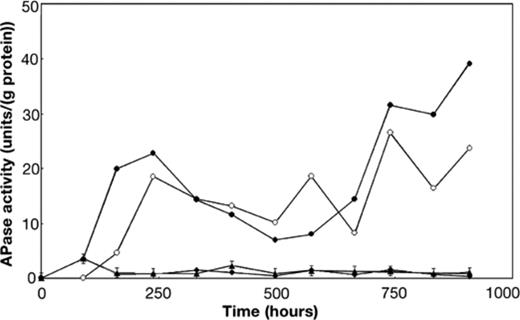
Specific cell-bound APase activity in the continuous cultures. The specific activity in the phosphate-limited cultures with (open circles) and without (filled circles) FB and the average specific activity in the four carbon- (diamonds) and the four nitrate-limited cultures (triangles) is shown.
3.2 Parathion-hydrolyzing activity in the course of continuous cultivation
The bacterial cells in the five continuous cultures inoculated with ditch water only did not form p-nitrophenol from parathion at a measurable rate. Addition of FB as a positive control to the assay always led to immediate accumulation of p-nitrophenol, indicating that rapid conversion of p-nitrophenol by the bacterial cells did not cause a false negative outcome of the parathion hydrolase assay (data not shown). In our 1-ml assay the detection limit of parathion hydrolase was 10−5 enzyme unit (1 enzyme unit hydrolyzes 1 μmol parathion min−1). A washed cell suspension obtained from a pure 25-ml batch culture of FB had a specific activity of 141±13 units g−1 bacterial protein. All assays with a low parathion-hydrolyzing activity were carried out with 900 μl of washed bacterial culture suspension (containing at least 450 μg of protein). Thus, assuming no p-nitrophenol conversion, the activity of FB would become undetectable in our assay procedure if the organism formed less than 0.002% of the bacterial protein of the mixed continuous cultures. Fig. 3A shows the specific bacterial parathion-hydrolyzing activity (μmol parathion hydrolyzed mg−1 bacterial protein min−1) in bacterial cells from the five continuous cultures that were inoculated with a 1% inoculum of FB containing 1.4 mg of bacterial protein. During the first 600 h of cultivation all cultures showed a decrease in the cell-bound specific parathion-hydrolyzing activity at a rate that almost equalled the theoretical washout rate (dashed line in Fig. 3A). After 598 h (509 h of continuous cultivation) one of the two carbon-limited and one of the two nitrate-limited cultures (open symbols in Fig. 3A) received 10 mg l−1 IMP in the continuous culture medium. These two cultures showed a sudden increase in parathion-hydrolyzing activity. Fig. 3B shows the relative specific parathion hydrolase activity in these two cultures compared to their respective control cultures without IMP. It is evident from Fig. 3B that, although the activity never reached the high initial level (directly after the moment of inoculation), IMP significantly increased it under nitrate- and under carbon-limited conditions.

The decline of FB, measured as parathion-hydrolyzing activity (PTHase), in the mixed continuous cultures and effect of IMP addition to the growth medium. A: Logarithmic graph of the specific cell-bound parathion-hydrolyzing activity in the five cultures inoculated with ditch water and FB. The dashed line represents the calculated washout rate of a non-growing microorganism from the carbon- (diamonds), nitrate- (triangles) and phosphate-limited (circles) chemostats. Open symbols are the two cultures to which 10 mg l−1 IMP was added to the chemostat medium at the time indicated by the arrow. B: Ratio of the specific parathion-hydrolyzing activity in the nitrate- and the carbon-limited mixed continuous cultures to which 10 mg l−1 IMP was added at the time indicated by the arrow to that in the respective control chemostats that did not receive IMP.
3.3 Detection of the phosphotriesterase-encoding sequence by PCR amplification
Fig. 4A shows the specific amplification of fragments of the phosphotriesterase-encoding gene from total DNA isolated from a pure culture of FB using 11 oligonucleotide primer combinations (see Section 2 and Table 1 for experimental details). Each combination yields a single amplification product of the expected size. The 426- and 663-bp PCR products from lanes 2 and 4 were used routinely in two separate amplification procedures to detect the presence of the gene in DNA isolated from the pellets of the mixed continuous cultures. Fig. 4B shows the detection of the phosphotriesterase gene in the five cultures inoculated with surface water and FB at the beginning of C-, N- or P-limited continuous cultivation and after 72, 240, 484 and 744 h. The positive control yields the two expected DNA fragments, which are not detectable in the no-template control (the two lanes on the right). In most of the other lanes, one or both fragments can be seen except for the carbon-limited culture without IMP at 72 and 240 h, the carbon-limited culture with IMP at 72 h and the nitrogen-limited culture without IMP at 72 h. In other lanes, there is often only a successful amplification of the 426-bp product, and there is a large variation in the intensity of the bands. Possibly, the quality of the isolated DNA or the yield of plasmid DNA caused the failure to detect the phosphotriesterase gene in samples that had a much higher parathion-hydrolyzing activity than some of the others (e.g. the phosphate-limited culture at 744 h). Therefore, a negative result with this PCR detection method should be interpreted with caution.
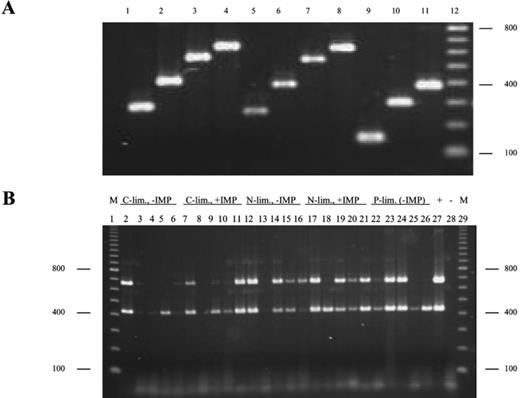
Detection of the phosphotriesterase-encoding gene by specific PCR amplification of fragments from total DNA isolated from bacterial cultures. A: PCR amplification of 11 phosphotriesterase gene fragments (lanes 1–11) with predicted sizes of 240, 426, 580, 663, 262, 398, 552, 635, 153, 398, 391 bp, respectively using total DNA from FB as a template. Lane 12 contains molecular mass markers (100-bp ladder). B: Detection of the phosphotriesterase gene in mixed cultures in the course of continuous cultivation by partial PCR amplification with specific primers. Agarose gel of the 426- and 663-bp PCR products (lanes 2 and 4 in A) using template DNA isolated from the five cultures inoculated with surface water and FB after 0, 72, 240, 480 and 744 h of C-, N- or P-limited continuous cultivation. Each lane contains two PCR products amplified in two separate PCR amplification reactions. Lanes 1 and 29: molecular mass markers (M); lane 27: total DNA from FB used as a template (+); lane 28: no-template negative control (−). Lanes 2–6: C-limited culture that did not receive IMP; lanes 7–11: C-limited culture that received IMP from 504 h onwards; lanes 12–16: N-limited culture that did not receive IMP; lanes 17–21: N-limited culture that received IMP from 504 h onwards; lanes 22–26: P-limited culture (not treated with IMP).
3.4 Detection of FB on solid medium with IMP as the sole carbon source
A dilution series of culture fluid in sterile mineral medium without carbon and nitrogen sources was obtained from the five chemostats inoculated with ditch water and FB 960 h after the start of continuous cultivation (451 h after the addition of 10 mg l−1 IMP to two of these five cultures). Diluted bacterial suspension (20 μl) yielded bacterial colonies in all cases. Apparently, significant numbers of bacteria with the ability to utilize IMP (250 mg l−1) as a source of carbon, nitrogen and energy for growth were present in all five cultures. At least one colony morphotype derived from each continuous culture was streaked out on the same solid growth medium and cell morphology, colony pigmentation and parathion-hydrolyzing activity were assessed. It appeared that yellow bacterial colonies only grew on plates inoculated with the two cultures that had received IMP in the previous cultivation period. All yellow colonies that were tested hydrolyzed parathion and had a similar cellular morphology (small non-motile rods) to FB. On the other hand, none of the other, non-pigmented colonies hydrolyzed parathion and individual bacterial cells mostly could be distinguished from FB by phase contrast microscopic observation (due to a larger or smaller cell size, a vibroid or ovoid cell shape, and sometimes due to being motile). Table 2 shows the numbers of white and yellow colony-forming units in all five cultures inoculated with Flavobacterium. The fact that a large number of IMP-utilizing bacteria were present in all cultures explains why no Flavobacterium colonies were detected in the other cultures (which all still had a measurable parathion-hydrolyzing activity). At the low dilutions confluent growth of bacterial colonies probably impaired their detection.
Numbers of FB (CFU) detected per ml of mixed bacterial culture after 960 h of continuous cultivation on agar plates with IMP as the sole source of carbon, nitrogen and energy
| Limitation type | IMP in medium (mg l−1) | CFU ml−1 (total) | Yellow colonies (%)a |
| Carbon | 0 | 2.7±0.3×10⁶ | 0 |
| Carbon | 10 | 19±11×106 | 9.6±1.3 |
| Nitrate | 0 | 22±8×10⁶ | 0 |
| Nitrate | 10 | 47±4×10⁶ | 0.10±0.05 |
| Phosphate | 0 | 1.4±0.3×10⁶ | 0 |
| Limitation type | IMP in medium (mg l−1) | CFU ml−1 (total) | Yellow colonies (%)a |
| Carbon | 0 | 2.7±0.3×10⁶ | 0 |
| Carbon | 10 | 19±11×106 | 9.6±1.3 |
| Nitrate | 0 | 22±8×10⁶ | 0 |
| Nitrate | 10 | 47±4×10⁶ | 0.10±0.05 |
| Phosphate | 0 | 1.4±0.3×10⁶ | 0 |
Assumed to be FB (based on parathion-hydrolyzing activity and cell and colony morphology).
4 Discussion
We applied continuous cultivation of ditch water microorganisms with and without FB, an organism capable of hydrolyzing a variety of organophosphorus insecticides, to study the effect of competitive interaction under different macroelement limitations on this organism. FB was chosen as a model pesticide-degrading microorganism for the following reasons. (1) It can easily be grown in pure culture on a complex or mineral medium (data not shown). (2) A simple and sensitive activity assay of its constitutively expressed, low specificity phosphotriesterase could be developed. (3) The nucleotide sequence of the phosphotriesterase-encoding gene has been determined, facilitating its detection by means of PCR amplification. It appeared that, although the physicochemical cultivation conditions permitted the growth and survival of FB, it decreased in abundance in the mixed continuous cultures at a high rate (as judged from the rapid decrease in the parathion-hydrolyzing capacity of the bacterial cells from the mixed cultures) irrespective of the macroelement limiting bacterial growth. Addition of (the diazinon hydrolysis product) IMP to one carbon- and one nitrogen-limited mixed continuous culture led to a more than 20-fold increase of the parathion-hydrolyzing activity of these cultures compared to controls without IMP. FB could only be detected, on agar plates containing IMP as a sole source of carbon, nitrogen and energy, in the two IMP-amended continuous cultures. However, each of the five chemostats contained a variety of other bacteria capable of growth on IMP but not capable of hydrolyzing parathion, possibly interfering with the detection of FB at still lower abundance in the remaining three cultures. This is in agreement with the observation that all five cultures contained the phosphotriesterase-encoding gene throughout the whole cultivation period, based on specific partial amplification by means of PCR. These observations indicate that FB, a bacterial strain capable of detoxification of organophosphorus insecticides in surface water, is apparently incapable of successfully competing with resident chemoheteroorganotrophic microorganisms from an agricultural ditch for nitrate, phosphorus or carbon sources.
In an earlier investigation [14], chemostats were inoculated with surface water from the same location as in the present study and grown for 40 days on a rich medium containing a mixture of vitamins and 3 mg l−1 of the fungicide 2,6-dichloro-4-nitroaniline (dichloran). A significant biodegradation of dichloran compared to a sterile control chemostat took place in these cultures. However, the continuous presence of dichloran may have resulted in the selection of microorganisms involved in its degradation.
In contrast, in the present study, we have grown microorganisms in a chemically defined medium under carbon-, nitrate- and phosphate-limited conditions. Based on our observation that the parathion-hydrolyzing strain proved unable to outcompete the resident ditch microbiota, we conclude that a specific selective advantage for pesticide-degrading microorganisms is required for rapid biodegradation in surface water. Our current hypothesis is that this selective advantage is the repeated or continuous presence of a given pesticide that can be used as a macroelement (carbon, nitrogen or phosphorus) by a pesticide-degrading microorganism. Indeed, the isolation procedure of FB [15,16] illustrates that this may be the case. A rice paddy field in the Philippines that had been treated with diazinon every 20 days during a 3.5-year period showed a rapid disappearance of the insecticide from the paddy water and a concomitant decrease in its effectiveness against the brown plant hopper Nilaparvata lugens. It appeared that subsequently applied diazinon was degraded by bacteria that were capable of using the pesticide as an additional, but not as a sole source of carbon [15]. In a subsequent publication [16], the isolation of FB was reported, a strain capable of using diazinon as a sole source of carbon, due to its ability to hydrolyze the pesticide and further metabolize one of the hydrolysis products, IMP, to CO2.
Our current investigation demonstrates that the half-life of a pesticide which is potentially rapidly biodegradable (such as parathion) may be much longer if microorganisms capable of biodegradation of the pesticide are unsuccessful in competing for macronutrients in the absence of the pesticide. In general a pesticide will only be degraded rapidly if it not only provides the degrading organism with a competitive advantage (e.g. an additional source of a limiting macroelement for growth) but also is regularly present in a particular environment. This phenomenon, termed enhanced biodegradation, has previously been demonstrated for many xenobiotic compounds, including several other organophosphorus compounds such as methyl parathion, ethyl parathion, fenitrothion [17], fenamiphos [18] and ethoprophos [19].
The results presented here imply that estimations of the degradation rate of a xenobiotic compound in the environment by resident microbial populations should normally be based on a ‘worst case’ situation, with an unadapted local microbial population, except where biodegradation rates have to be predicted for locations at which regular exposure of the local microbiota to a particular xenobiotic compound is to be expected. In order to test our general hypothesis that the continuous presence of growth-supporting pesticides leads to a higher abundance of degrading bacteria, further research will involve an experimental setup in which a mixture of pesticides (including diazinon) is continuously supplied to these types of mixed chemostat cultures under C, N or P limitation.
References
