


Abstract
Consequences of initial spatial organisation of model fungal communities upon their spatio-temporal development were investigated. Dynamics of prescribed two- and three-species ‘communities’ developing on tessellated agar tile model systems were analysed in terms of literal maps, principal component analyses, or as the proportion of species extant within tiles. It was established that for two-species interactions of equal patch size, large-scale (i.e. many constituent tiles) behaviour could be extrapolated from the relevant small-scale (i.e. pairs of tiles) interactions. However, relative patch sizes (scale) of species within tessellations influenced the times taken by individuals to colonise tiles and, hence, temporal behaviour of the system. Outcome of arrangements involving three species of equal patch size and inoculum potential, and prescribed with different mixing patterns, could not be directly extrapolated by reference to the outcome of pair-wise interactions between constituent species. Three-species arrangements attempt to limit assembly of lateral aggregates of individuals (patch size) and hence any effects of tile colonisation times, so as to reveal effects of nearest neighbour context within the complex community. Such arrangements indicate that spatial configuration of inoculum influences community development and reproducibility. They also suggest that spatial distribution of species affects persistence of individuals, which would otherwise be expected to be eliminated from the system. Two-species interactions appeared generally more reproducible than those comprising three species, and the sensitivity of fungal community development to temperature was not solely associated with influence on colony extension rate.
1 Introduction
Fungal mycelia display extensive morphological and developmental plasticity as they encounter spatio-temporal heterogeneity within their abiotic and biotic environments [1,2]. It has long been established that biotic interactions, especially antagonistic mycelial interactions, are fundamental in determining fungal community structure in woody, submerged and soil environments [1,3,4]. In vitro, such fungal interactions may be described qualitatively as neutral (intermingling of mycelia), deadlock (in which neither mycelium enters the spatial domain of the other), or replacement (of one isolate by the other) [1,3,5]. However, relating such interaction studies to community development in natural environments is complex, and the predictive capacity of conceptual models based on such data is limited, especially in terms of temporal dynamics and biological context. A number of features have been identified empirically as being influential in determining interaction outcome, e.g. the age of the interacting hyphae [4], resource quality [1,4,6], distribution or mixing of inocula [7] and relative proportion or biomass of inocula [7,8].
Nevertheless, studies based on agar media, in particular binary pairings, and classification of the ecological strategy of isolates are often employed by microbial ecologists to study, explain or predict ex situ natural ecology [1,9]. Such a ‘bottom-up’ or reductionist approach fails to recognise the effect of context and/or scale on emergent behaviour of mycelial systems. For example, we have demonstrated, using a tessellated agar microcosm, the complex nature of the co-ordinated behaviour of fungal mycelia on overall community development [7,10]. Temporal development of model fungal binary species arrangements was strongly influenced by initial spatial arrangement and mixing of constituent species [10]. Moreover, temporal evolution of communities comprising three species were neither random nor fully deterministic. Replicates of physically smaller-scale tessellations were more consistent than those at larger scales and different initial spatial configurations of species influenced community development and the degree of consistency between replicates [7]. It is recognised that population and community dynamics of any organisms should be studied at an appropriate scale; this is generally apparent when considering determinate organisms (i.e. not at scales below the individual). With regard to indeterminate life forms such as filamentous fungi, the scale at which overriding processes function is less obvious, and indeed different species may have evolved to operate at different scales [11,12].
The overall aim of our programme of study, of which this paper reports a part, is to ascertain the important factors influencing community dynamics of eucarpic fungi. Many of these influences are often intuitively acknowledged by fungal ecologists, but few attempts have yet been made at formalisation or quantification. This paper specifically considers the effects of physical or spatial scale (of two-species interactions), spatial arrangement (of three-species interactions) and microclimatic context (a change in temperature regime). Commensurate inoculum potential of isolates is prescribed in all experiments described here, thereby limiting any irregular influence due to unequal weighting of species which may occur during mycelial interactions. Furthermore, the three-species arrangements attempt to limit assembly of lateral aggregates of individuals (patch size) and hence any effects of the time taken to colonise constituent tiles (‘crossing time’), so as to reveal the effects of nearest-neighbour context within the complex community (cf. [7]).
2 Materials and methods
2.1 Microcosm and species interaction design
The microcosm used in all experiments was based on that previously described [7,12]. Various initial spatial patterns of fungal species were established on tiles (10×10×3 mm) of 2% (w/v) malt extract agar (MEA; 20 g Oxoid malt extract, 15 g Oxoid technical agar in 1 l distilled water, approximate pH 5.6). Individual tiles arranged in a variety of arrays were simultaneously inoculated at their centre with 4-mm-diameter cores obtained from the actively growing margins of 2% MEA cultures. Tiles were tessellated with respect to the fungal species Poria placenta (=Tyromyces placenta or Oligoporus placenta) (Fr.) Cooke sensu J. Eriksson, Coniophora marmorata Desm. or Paecilomyces variotii, hereafter referred to as Pp, Cm and Pv, respectively [7,13]. Tiles were separated by 2-mm air gaps and arrays arranged in Petri dishes sealed with strips of Parafilm, placed in loosely sealed plastic bags together with a Petri dish containing water-saturated cotton wool (to maintain humidity). Basic arrangements were as follows:
Arrangement 1: For the 2×1 arrays, confrontations were established in all pair-wise permutations of species Pp, Cm and Pv, denoted by 1a (Pp vs Cm), 1b (Pp vs Pv) and 1c (Cm vs Pv).
Arrangement 2: For the 3×3 arrays, confrontations were established among species Pp, Cm and Pv arranged in equal ratios in all possible configurations, such that no lateral clustering of tiles occupied by any single species was permitted. This arrangement constraint led to three tessellations, denoted as 2a, 2b and 2c (Fig. 1a–c).
Arrangement 3: For the 6×6 arrays, confrontations were established between the species pair Cm and Pv in regularly arranged patches of size 1 (3a), 3 (3b) and 9 (3c) (Fig. 2a–c).
Arrangement 4: Further 6×6 array arrangements were established for all pair-wise permutations of species Pp, Cm and Pv with patch size 1, denoted by 4a (Pp vs Cm), 4b (Pp vs Pv) and 4c (Cm vs Pv).
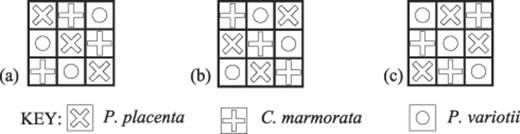
Example maps showing the spatial distribution of fungal species in the 3×3 (equal proportion) tessellated agar tile interactions at the onset of the experiment. a: Arrangement 2a. b: Arrangement 2b. c: Arrangement 2c. Bold lines denote air gaps between individual tiles. Dimension of each tile is 1 cm2. Symbols indicate the species inoculated onto each tile.
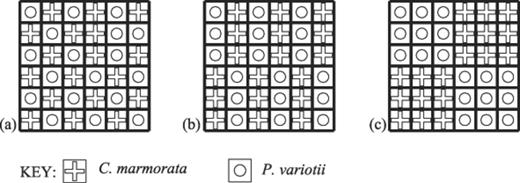
Example maps showing the spatial distribution of fungal species in the 6×6 (varying patch size) tessellated agar tile interactions between C. marmorata and P. variotii at the onset of the experiment. a: Arrangement 3a. b: Arrangement 3b. c: Arrangement 3c. Bold lines denote air gaps between individual tiles. Dimension of each tile is 1 cm2. Symbols indicate the species inoculated onto each tile.
Arrangements 1, 2 and 3 were established and incubated at 15°C in the dark and the interaction outcomes assessed after 1, 3 and 5 weeks. Arrangement 4 was incubated at ambient temperatures (20–25°C) in the dark and the interaction outcomes assessed (see Section 2.2) after 6 weeks; this design was used in order to facilitate comparison with an Arrangement 1 experiment incubated at ambient temperature, previously reported [7]. Colony extension rates of the three species grown in isolation at 15°C and ambient temperatures were also determined for five replicates.
2.2 Assessment of interaction outcomes and data analysis
All tiles within each replicate microcosm were harvested at the various time intervals according to each experiment, and the spatial distribution of species within four quadrants of each tile determined by isolation and sub-culturing as previously described [7]. Six replicate microcosms were harvested at each sampling time for Arrangements 1a–c, 2a–c and 4a–c. In the case of Arrangements 3a–c, five replicates were harvested at each sampling time. For Arrangements 1a–c, 3a–c and 4a–c, results are presented as tables indicating occupancy of tiles at each time point. For Arrangement 2a–c designs, spatial configurations were visualised by both schematic maps indicating occupancy of space over time and a principal component analysis (PCA) of ‘interface class’ and ‘state transition class’ described in detail previously [7]. ‘Interface class’ categorised the number of interfaces between adjacent tiles of the combinations Pp: Pp, Cm: Cm, Pv: Pv, Pp: Cm, Pp: Pv, Cm: Pv, and numbers for multi-occupied tiles were expressed as a proportion of the whole tile. ‘State transition class’ categorised the number of tiles that showed a particular transition from one state of occupancy at a particular time point to another at the time of sampling. Levene's test [14], chosen since it does not assume normality, was used to test if the standard deviation of the number of quarter tiles was the same for each species for each initial tessellation.
3 Results
3.1 Extension rates
Extension rates (mean mm day−1) observed at both 15°C and ambient temperature, respectively, were as follows: Pp 3.01 (S.E.M.=0.01) and 3.99 (S.E.M.=0.04); Cm 3.61 (S.E.M.=0.04) and 4.54 (S.E.M.=0.07); Pv 2.45 (S.E.M.=0.01) and 3.45 (S.E.M.=0.06).
3.2 Arrangement 1
Outcomes of the 2×1 binary interactions are presented in Table 1. For Arrangement 1a, Cm defended its territory against Pp, and often invaded space initially occupied by Pp; however, complete replacement did not occur. For Arrangement 1b, Pp usually defended its territory against Pv and vice versa. For Arrangement 1c, Pv was invaded by and subsequently replaced by Cm, whilst Cm defended its territory against Pv.
Proportion of fungal species Pp, Cm and Pv existing within each quarter tile, during 2×1 confronting tessellations incubated at 15°C
| Experiment and sampling period (weeks) | Proportion of fungal species in confronted inoculated tiles | |||||
| Tile 1 | Tile 2 | |||||
| Species | Species | |||||
| Pp | Cm | Pp and Cm | Pp | Cm | Pp and Cm | |
| 0 | 24 | 0 | 0 | 0 | 24 | 0 |
| 1 | 23 | 1 | 0 | 0 | 24 | 0 |
| 3 | 21 | 0 | 3 | 0 | 24 | 0 |
| 5 | 12 | 0 | 12 | 0 | 24 | 0 |
| Pp | Pv | Pp and Pv | Pp | Pv | Pp and Pv | |
| 0 | 24 | 0 | 0 | 0 | 24 | 0 |
| 1 | 24 | 0 | 0 | 0 | 24 | 0 |
| 3 | 24 | 0 | 0 | 0 | 24 | 0 |
| 5 | 22 | 0 | 2 | 0 | 24 | 0 |
| Pv | Cm | Pv and Cm | Pv | Cm | Pv and Cm | |
| 0 | 24 | 0 | 0 | 0 | 24 | 0 |
| 1 | 10 | 12 | 2 | 0 | 24 | 0 |
| 3 | 0 | 24 | 0 | 0 | 24 | 0 |
| 5 | 0 | 24 | 0 | 0 | 24 | 0 |
3.3 Arrangement 2
Outcomes of the 3×3 tessellated agar interactions were expressed as spatial distribution maps as shown in Fig. 3. Temporal development of species present in Arrangement 2a was relatively consistent between replicates during the first 3 weeks, with Cm replacing Pv. However, by 5 weeks incubation, some variation between replicates was revealed, with either replacement of Cm by Pp, or Pp invading Cm's domain, or Cm invading Pp's domain. Pv had emerged from a few tiles by 5 weeks. In Arrangement 2b there was an initial replacement of Pv by adjacent tiles of Cm. However, at 3 weeks the Pv tile in the lower left-hand side, laterally adjacent to a diagonal of Pp-colonised tiles, showed no presence of Cm until 5 weeks at which time Pv was replaced by Cm. Development of species interactions in Arrangement 2c revealed variable outcomes between replicates. Initially, Cm invaded Pv's domain, but some Pv tiles remained even at 5 weeks.
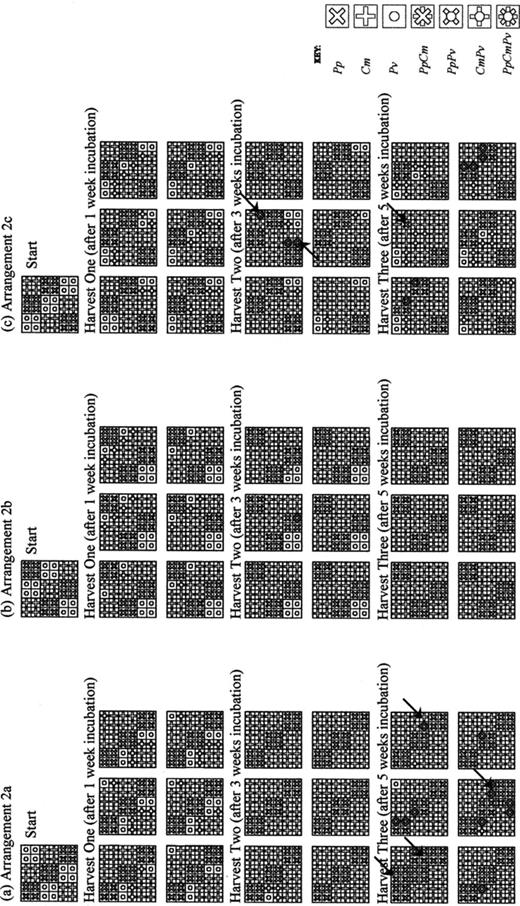
Spatial distribution maps of fungal species in the 3×3 tessellated agar tile. a: Arrangement 2a. b: Arrangement 2b. c: Arrangement 2c, at the start of interaction and then after 1, 3 and 5 weeks incubated at 15°C. Bold lines denote air gaps between individual tiles, fine lines denote quadrants, which were plated to determine interaction outcome. Arrows indicate Cm prescribed tiles invaded by other species. See text for experimental details.
Plots of the first and second principal components associated with these outcomes are presented in Fig. 4. They indicate that for Arrangements 2a and 2b, interaction outcomes between replicates became more similar as incubation proceeded. Interaction outcomes remained variable in Arrangement 2c during the 5-week incubation period. Levene's test showed that the standard deviation of the number of tiles occupied by Pp and Cm was consistent across the initial arrangements for harvests at weeks 1 and 3 (each P>0.05). At the week 5 sampling, however, the number of tiles occupied by Pv was higher for Arrangement 2c than 2a (Mann–Whitney test W=22; P=0.0074) and varied more (Levene's test statistic=9.474; P=0.012). There were no tiles occupied by Pv at this time on Arrangement 2b.
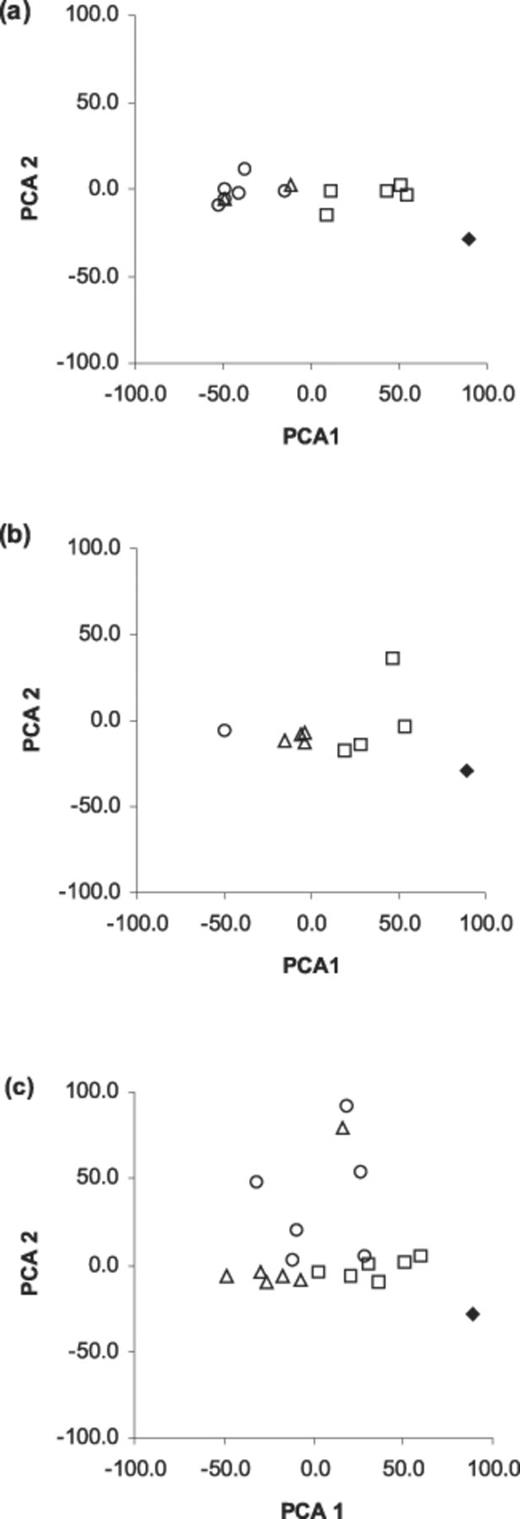
Plots of first and second principal components from analysis of interface classes and state transition classes of tessellated agar tile arrangements. a: 2a. b: 2b. c: 2c. Diamond=0 week, square=1 week, triangle=3 weeks, circle=5 weeks incubation at 15°C. See text for details.
3.4 Arrangement 3
Outcomes for the patch size 1, 3 and 9 arrangements (Fig. 2) for Cm vs Pv reveal the effect of patch size on the temporal behaviour of the system (Table 2). The mean number of Pv tiles remaining at the final sampling period increased with increasing patch size. Tiles invaded by Cm at the 8-day sampling reduced with increasing patch size, and at the 12-day sampling increased with increasing patch size. The mean number of tiles subsequently replaced by Cm at both the 8-day and 12-day sampling points decreased with increasing patch size.
Mean occupancy (quarter tiles) of fungal species Cm and Pv in binary pairings of patch size 1, 3, and 9 tiles for each 6×6 tessellation
| Experiment and sampling period (days) | Mean occupancy (of quarter tiles) and S.E.M. of fungal species in each arrangement | ||
| Species | |||
| Pv | Pv and Cm | Cm | |
| Patch size 1 | |||
| 0 | 72±0 | 0±0 | 72±0 |
| 8 | 10.8±8.64 | 39.8±5.32 | 93.4±12.05 |
| 12 | 1±0.71 | 2.6±2.7 | 140.4±2.19 |
| Patch size 3 | |||
| 0 | 72±0 | 0±0 | 72±0 |
| 8 | 9.8±4.44 | 19.6±11.48 | 114.6±13.94 |
| 12 | 1.8±2.17 | 3.4±3.36 | 138.8±4.45 |
| Patch size 9 | |||
| 0 | 72±0 | 0±0 | 72±0 |
| 8 | 52.2±3.36 | 12.8±5.76 | 79±6.74 |
| 12 | 6.6±1.34 | 4.6±2.07 | 132.8±3.08 |
See text for experimental details.
3.5 Arrangement 4
During the 6×6 ‘checkerboard’ tessellated agar binary interactions (Table 3), Pp replaced Cm almost entirely within the 6-week incubation period, complete deadlock occurred between Pp and Pv, and Cm replaced Pv completely. The large-scale two-species interactions showed little heterogeneity between replicates and outcome was achieved within the 6-week incubation period, concordant with the binary-tile interactions.
Mean occupancy (quarter tiles) of fungal species isolated from 6×6, checkerboard, patch size 1 tessellations, for binary pairings of species Pp, Cm and Pv
| Experiment and sampling period (weeks) | Mean occupancy (of quarter tiles) and S.E.M. of fungal species in each arrangement | ||
| Species | |||
| Pp | Pp and Cm | Cm | |
| 0 | 72.00±0.00 | 0.00±0.00 | 72.00±0.00 |
| 6 | 139.33±8.16 | 4.00±6.69 | 0.67±1.63 |
| Pp | Pp and Pv | Pv | |
| 0 | 72.00±0.00 | 0.00±0.00 | 72.00±0.00 |
| 6 | 68.83±2.14 | 3.17±2.14 | 72.00±0.00 |
| Pv | Pv and Cm | Cm | |
| 0 | 72.00±0.00 | 0.00±0.00 | 72.00±0.00 |
| 6 | 0.00±0.00 | 1.00±0.52 | 143.00±0.52 |
4 Discussion
The results presented raise a number of general issues. Most generally, non-local features impact on the interactions among species precluding detailed extrapolation from small-scale, pair-wise experiments to larger-scale systems. Whilst final outcomes of the larger-scale Pv vs Cm interactions (Arrangement 3a–c) can indeed be broadly determined from the small-scale data (Arrangement 1c), the finer-scale dynamics of the interactions are dependent on patch size at the larger scale. The rate of invasion of Pv and subsequent replacement by Cm is reduced with increasing patch size. These data support our previous suggestion that larger patch sizes influence the crossing times of individuals (i.e. the time taken for an individual to move stepwise from one region of the system to another). Therefore, particular large-scale spatial arrangements may produce longer dynamical time scales, although final outcomes are similar to those of the binary-tile pairings [7,10]. It should also be recognised, however, that patch size affects the age of the entire component mycelia at the time of interaction with an opposing individual, which might also influence the dynamics of the system. For example, Stahl and Christensen [4] found younger mycelia to be less combative than more mature growth.
In attempts to limit assembly of lateral aggregates of individuals in arrangements, it is evident that both local and non-local processes drive the system dynamics. The purpose of such arrangements (2a–c) is to reveal the effects of localised, nearest-neighbour processes on the interaction dynamics of a complex large-scale community. Nevertheless, in Arrangement 2b (Fig. 3b) the lower left-hand corner tile occupied by Pv is replaced by Cm, where neither a Cm lateral nearest neighbour is present nor any replacement of nearest neighbours Pp occurs, first to Cm, which may then subsequently replace the Pv tile. Significantly, the diagonal aggregate of Pv in Arrangement 2c appears to be related to persistence of this species over time.
Hierarchical rules, relating to combative ability, derived from pair-wise interactions (Arrangements 1a–c) may not be sufficient to predict the overall outcomes of larger-scale multi-species interactions. The hierarchy of combative ability of all three species, derived from the pair-wise (1a–c) interactions, predicts that Pv would rapidly be eliminated from the community and that Cm would coexist with Pp, whilst defending its spatial domain. The three-species Arrangement 2a–c tessellations provide commensurate inoculum potential of species, but with different mixing patterns. Examination of the resultant data maps demonstrates survival of Pv after 3 (Arrangement 2b) and 5 (Arrangement 2c) weeks, compared with the evident elimination of Pv by Cm by the 3-week sampling period in the 2×1 (Arrangement 1a) pairings. Furthermore, within Arrangements 2a and 2c, with maximum partitioning of Cm, some prescribed Cm tiles became colonised or replaced by Pp (arrows in Fig. 3). Behaviour of two fungal individuals is particular to that combination under the prevailing incubation regime. Introduction of further species will influence the interactive functioning of the system, the operation of which cannot be predicted by measures indicating an organism's behaviour during interactions with individual fungi in isolation. Similar inferences have been reported previously [3,4,7].
Results indicate that the extent of heterogeneity displayed among replicates of tessellations is a consequence of number of species present, irrespective of the scale of the tessellation arrangement. Spatio-temporal maps and PCA of development of the three-species tessellations indicate the effects of time and spatial arrangement on variability in outcome. The variation in outcome among replicates of the same initial arrangement reveals the sensitivity of outcome to differences in starting conditions below detectable limits in our experiments. However, replicate heterogeneity of two arrangements (2a and 2b) appeared to converge over time. Extrapolation of this observation to the natural environment implies that the effect of perturbations on the outcome of interactions may become less significant over prolonged periods. For example, fungal succession on a single species of leaf litter collected from a single source, but allowed to decompose in different habitats, produced a similar sequence of events but within different time scales [15]. In contrast, for Arrangement 2c, replicate heterogeneity developed and persisted during the period studied. It is therefore not possible to make general observations regarding the effect of perturbation on interaction outcome. Importantly, it is evident that Arrangements 1a–c and 3a–c exhibited less variation among replicates than Arrangement 2a–c tessellations.
Results of Arrangement 2a–c demonstrate that survival of species (akin to diversity within this system) is dependent on spatial arrangement of those species. Spatial pattern is an essential factor controlling species dynamics and different arrangements produce different degrees of variability among replicates. Persistence of Pv in Arrangement 2c, and colonisation of Cm tiles in Arrangements 2a and 2c, could be considered as experimental evidence supporting concepts of stable coexistence of metapopulations due to appropriate spatial distribution or habitat subdivision (e.g. [16]). Such interactions have been theoretically demonstrated in a number of systems [17] and habitat patchiness is generally considered to promote biodiversity (e.g. [18]). Although patchy environments may encourage a diversity of function, as observed here, generalisation of this phenomenon is problematic, since species’ functions may overlap to a sufficient extent so as to collapse any partitioning from spatial patterning.
Comparison of Arrangement 1a–c outcome data presented here with an experimental cohort presented previously [7] clearly demonstrates the sensitivity of fungal interactions to temperature regime. This is particularly evident for the Cm vs Pp pairing where Cm invades Pp at 15°C, but at the higher temperature regime (20–25°C) the converse occurred [7]. That the effect is not merely a manifestation of altered colony extension rates is apparent, as all three species studied exhibited increased radial colony extension rates at the higher temperature regime. Furthermore, the outcome of the Cm vs Pv confrontation attained completion sooner at the lower incubating temperature regime. Different incubation temperatures in this case influenced the final outcome of only one of the 2×1 (Pp vs Cm) binary pairings, with no unanimous influence for a particular species during its interaction with all other species. These data demonstrate the complexity of contextual interactions; specifically that improved growth temperature regimes are not necessarily conducive to superior combative physiology.
There are conflicting reports on the relevance of mycelial interactions studied on agar plates to those occurring in more natural substrates such as wood (e.g. [1,8,19,20]). This may be related to the spatial or temporal scale at which the data are collected or aggregated [21,22]. Such features will become relatively more significant in models or studies of fungal communities of individuals with similar or overlapping evolutionary or functional niche spaces. Indeed, different species are likely to have an appropriate scale (spatial, temporal and organisational) for optimum functioning (e.g. [23–25]). Therefore selecting a single scale of microcosm is likely to give preference to particular individuals. The disadvantages noted in the study of agar systems should be considered against the considerable advantages in terms of the simplicity and amenability of the microcosms used. Observations made in such systems provide, at least, an indication of key processes in more natural environments.
Acknowledgements
We would like to acknowledge the financial support of the Leverhulme Trust, SHEFC and The University of Abertay Dundee. SCRI receives grant-in-aid from the Scottish Executive Rural Affairs Department.
References
