


Abstract
The viability and culturability of chemoheterotrophic bacteria in Zwischenahner Meer, a shallow eutrophic lake in Northern Germany, were assessed by different techniques. The fraction of metabolically active cells was measured by the CTC reduction method. At three sampling times, numbers of CTC-reducing cells represented only a minor fraction (≤8%) of the total cell count. Only a slight stimulation of CTC reduction was observed upon the addition of single carbon substrates or substrate mixtures. A medium mimicking the low natural ion concentrations in freshwater was devised and used for the cultivation of bacteria in most probable number (MPN) series and on membrane filters. Similar to the number of CTC-reducing cells, the number of culturable cells as determined in MPN series never exceeded 7% of the total cell count with any of the carbon substrates tested. This indicated that the type of carbon substrate was not the major determinant of the rather low culturability. However, we observed a significant inhibition of bacterial growth in MPN series in which the typical R2A medium was used, or when phosphate buffer instead of HEPES was employed. In contrast to the low numbers of CTC-reducing cells and the low MPN values, up to 58% of the bacterial cells could divide on membrane filters incubated on top of the same type of medium that had been used in the MPN series. It is concluded that most of the bacteria in Zwischenahner Meer are able to grow and divide, but do not reach high cell densities even in improved culture media. Therefore, the majority of bacteria may be classified as viable but nonculturable, but would not be detected by the CTC reduction method.
1 Introduction
Generally less than 1% of the total number of bacterial cells which are present in natural seawater, soil, or freshwater samples can be cultured by standard laboratory methods [1–3]. However, up to 50%[4] and in some instances even 90%[5] of the bacterial cells appear to be metabolically active when assessed by the direct viable count technique [6], by microautoradiography with radiolabelled substrates [3,4,7], or by monitoring the presence of active electron transport systems in the cells with tetrazolium salts [8]. As a further complication, not all bacterial cells which are detected by epifluorescence microscopy seem to contain a nucleoid and might even represent ghosts [9]. The results obtained with these various methods are often not comparable. As a consequence, there is no accepted standard method to assess the fraction of metabolically active cells in natural samples.
Measurements of the genetic diversity of bacteria in soil or marine sediment using the reassociation kinetics of their genomic DNA indicated the presence of 4000–13 000 different bacterial genomes [10–12], exceeding the number of bacterial species currently listed in the Approved List of Bacterial Names. A recent estimate of half a million species present in 30 g of forest soil [13] is even significantly higher. Further support for a high diversity of so far uncultured bacterial species comes from the detection of novel 16S rRNA gene sequences in environmental samples [14–18].
It has been suggested that most of the bacterial species are nonplatable because they are adapted to low nutrient concentrations and reach only low maximum growth rates (K-selected) [2,10]. The physiology and ecological role of these unknown bacterial species in most cases can only be assessed after their isolation in pure culture. It is therefore mandatory to investigate the causes of ‘nonculturability’ of bacteria in natural samples and to develop new strategies for their cultivation. Recent evidence indicates that at least in some environments up to 70% of the cells in principle may be culturable [2,19–22].
The aim of the present investigation was to assess and compare the fraction of metabolically active cells, those capable of cell division, and the fraction of culturable bacterial cells in a natural microbial community. These parameters were then used to systematically improve culturability. In addition, we established defined growth media to replace the often used complex media (e.g., R2A [23]), or autoclaved sitewater [2,19].
2 Materials and methods
2.1 Sampling site and sample processing
Water samples were obtained from Zwischenahner Meer, a eutrophic lake in northern Germany (53°12′N, 8°0′E, Bad Zwischenahn, Niedersachsen, Germany). The lake has a surface area of 26 ha, a mean depth of 3.3 m, and a maximum depth of 5.0 m. Chlorophyll a concentrations range between 13.7 and 63.4 μg l−1[24]. The sampling site was located at the head of a pier 20 m from the east shore. On 15 May 1996, 20 l of water were collected at 0.3 m depth. The natural bacterial community was concentrated over a 0.16 μm pore size filter by tangential flow filtration (ProVario-3, Filtron, Karlstein, Germany) and subsequent centrifugation as described previously [25]. The pellet was resuspended in sterile Ficoll 400 (Pharmacia Biotech, Freiburg, Germany) and stored in liquid nitrogen. This sample served as a source of cells for most of the experiments such that the results were fully comparable. A sample obtained on 17 September 1996 was treated in the same manner. For growth experiments stored cells were washed and resuspended in synthetic freshwater (SF, see below) and the cell density of the suspension determined by staining with 4′,6-diamidino-2-phenylindole (DAPI) [26]. Samples obtained in November 1996 were employed directly (without concentration and storage in liquid nitrogen) in physiological and growth experiments. Additional water samples were obtained on 23 October 1997 (Jaspers and Overmann, in preparation) and used directly in the filter experiments. The water temperature on the four sampling dates was very similar (10.0–14.2°C).
2.2 Fractionation of DOC
Two fractions of natural dissolved organic matter (DOC), <1 kDa and 1–10 kDa, were recovered from the filtrate of the tangential flow filtration of the May water samples. We used an Amicon 8050 ultrafiltration cell (Witten, Germany) equipped with <10-kDa and <1-kDa membranes. This resulted in a concentrated fraction of DOC with a molecular mass of 1–10 kDa (DOC1–10kDa). After separation the DOC fractions were stored at −20°C. Their fluorescence properties were analyzed using a Shimadzu RF-150 spectrofluorophotometer (Duisburg, Germany). A 4-methylumbelliferone (MUF) standard (250 nM, Sigma, Deisenhofen, Germany) was used for internal calibration. The carbon concentration of the different fractions was determined using a CHNS-O elemental analyzer EA 1108 (Carlo Erba Instruments).
2.3 Epifluorescence microscopy
Total cell numbers in natural samples were determined after staining with DAPI [26] using a Zeiss Axiolab epifluorescence microscope equipped with a 50 W/AC HBO lamp and filter set No. 01 (BP 365 nm, FT 395 nm, LP 397 nm). At least 20 fields or 500 cells were examined.
Bacterial growth in wells of microtiter plates was detected by acridine orange (AO) staining [27]. Samples of 10 μl volume were pipetted into 5 mm diameter wells of teflon-coated microscope slides (Menzel, Braunschweig, Germany). In order to prevent clumping, sterile Tween 20 was added to a final concentration of 0.005%. Afterwards samples were dried at 45°C by placing the slides on a thermoblock. This procedure resulted in an even distribution of cells over the whole well area. The dried slides were stained for 2 min in sterile AO solution (25 μg ml−1), rinsed with double distilled water, and dried again. Samples were embedded in immersion oil for examination with the Zeiss epifluorescence filter set 09 (450–490 nm, FT 510 nm, LP 520 nm). In negative controls, we observed a maximum of 0.2 bacterial cells per microscopic field (100×100 μm). Therefore a sample was scored positive if cell numbers of ≥1 cell per microscopic field were observed, corresponding to 800 cells per subsample (i.e., per well; see below).
2.4 CTC reduction assay
The percentage of respiring bacteria in natural samples was determined by staining with the fluorescent electron acceptor 5-cyano-2,3-ditolyl tetrazolium chloride (CTC [8]). In this assay, the reduction of the water soluble tetrazolium salt results in the precipitation of the fluorescent formazan within the cells.
We assessed the effect of 11 different carbon substrates or substrate mixtures on bacterial CTC reduction for water samples collected in May, September, and November 1996. The substrate mixtures comprised: a fatty acid mixture of formate, acetate, propionate and butyrate (200 μM each); an amino acid mixture of alanine, arginine, asparagine, isoleucine, cysteine, tyrosine, glutamine (200 μM each); a mixture of the purine and pyrimidine bases adenine, uracil, guanine and cytosine (200 μM each); and a mixture YPG of yeast extract (0.0072% final concentration), peptone (0.0036%) and glucose (200 μM).
2.5 Cultivation methods
2.5.1 Media
A new synthetic freshwater medium (SF) with low chloride content was developed for the cultivation of bacteria from natural lake water samples. SF medium is based on the average composition of freshwater [29] and contains the following components (in mg l−1 of double distilled water): NH4Cl, 0.53; KH2PO4, 1.4; KNO3, 10.1; MgSO4, 49.3; CaCl2 14.7; CaCO3, 25.0; NaHCO3, 25.2; trace element solution SL 10 [30], 1.0 ml. The medium was prepared from two different solutions. The first contained the carbonates (CaCO3 and NaHCO3) dissolved in 989 ml CO2-saturated double-distilled water. The remaining components were prepared as a 100-fold basal salts stock solution. This stock solution, trace elements, and substrates were added aseptically to the carbonate solution after autoclaving. The pH was adjusted to 7.5 by aseptically gassing the medium with N2 to reduce the CO2 content. Alternatively, one of the following buffers was added (pH 7.5, 10 mM final concentration): KH2PO4/K2HPO4 buffer, 4-morpholinopropanesulfonic acid (MOPS) buffer, or 4-(2-hydroxyethyl)-1-piperazine ethanesulfonic acid (HEPES) buffer. Sterile stock solutions of carbon substrates were added to the medium to a final concentration of 200 μM.
Parallel growth experiments were set up in R2A medium [23] containing yeast extract (0.5 g l−1), peptone (0.5 g l−1), glucose (0.5 g l−1), starch (0.5 g l−1), sodium pyruvate (0.3 g l−1), KH2PO4 (0.3 g l−1), and MgSO4·7H2O (0.05 g l−1). The pH was set to 7.2. Because amino acid additions of >5 mg C l−1 (R2A contains 270 mg casamino acid C l−1) have been found to inhibit the growth of oligobacteria [19], and for a better comparability with growth experiments in SF medium, we omitted casamino acids from the R2A medium. As a second parallel, YPG medium containing yeast extract (0.2% final concentration), peptone (0.1%) and glucose (0.2%) in SF was tested.
2.5.2 Cultivation in microtiter plates
Culturability of heterotrophic bacteria was assessed by a most probable number (MPN) method in microtiter plates. Tenfold serial dilutions were set up and incubated in polystyrene microtiter plates (Greiner, Frickenhausen, Germany) with a sample volume of 200 μl. Each MPN series comprised seven dilutions and six parallels. The plates were covered with sterile adhesive cellulose acetate plate sealers (Dynatech, Denkendorf, Germany) and incubated in a constant temperature room at 20°C in the dark.
Based on initial experiments which yielded similar MPN counts after incubation times of either 12 days or 4 weeks, a standard incubation period of 14 days was chosen. Afterwards, bacterial growth in the wells was detected by AO staining of 10 μl subsamples (see above). The detection limit for bacterial growth of this method was 800 cells per subsample or 8×10⁴ cells ml−1. Our detection limit is in the same range as that of another study of the culturability of natural populations of bacteria [2]. The most probable number was calculated using the computer program of Klee [31]. As a negative control six wells on each microtiter plate were incubated without inoculum. Culturability was calculated as the ratio of MPN counts to total cell numbers of the inoculum as determined by DAPI staining. To test for significant differences between two MPN counts, the t values were calculated as outlined in Jones [32] and compared to tabulated to values of Student's t-distribution.
2.5.3 Filter method
As a second measure of culturability, bacteria from natural samples were collected onto black polycarbonate filters (0.2 μm pore size), incubated under different conditions, and the number of divided cells recorded by epifluorescence microscopy after termination of the growth experiment [33]. In order to prevent active or passive movement of the cells after filtration, filters were covered with a drop of high viscosity silica oil (DC200, Fluka, Deisenhofen, Germany) and a sterile coverslip. The filters were then placed on the surface of sterile SF (buffered with HEPES) in glass petri dishes. As substrate, natural DOC of the size fraction 1–10 kDa was added to a final concentration of 15 mg ml−1. In a second set of experiments, water samples were obtained in October, 1997, and employed directly in the viability measurements without intermittent storage in liquid nitrogen. In this case, a control (SF medium without organic carbon substrate) and four parallels containing different substrates or substrate mixtures (200 μM glucose; the amino acid mixture, and the fatty acid mixture both described above; a combination of all substrates plus natural DOC) were tested to investigate the effectiveness of different carbon compounds for the stimulation of cell division. Filters were incubated for up to 10 days at 20°C in the dark. To determine the number of cells that had completed one or more divisions during the incubation interval, the filters were placed on DAPI staining solution (0.2 μg ml−1 in 50% ethanol [v/v]). The high concentration of 50% ethanol in the staining solution was found to be crucial for a successful staining of the bacterial cells on filters from below. After 30 min the filters were transferred to a tissue to remove excess staining solution and then mounted in immersion oil on a glass slide. The percentage of divided cells (D) was determined by the ratio of the number of microcolonies of ≥2 cells (nM) to the number of total cells (ntot). D was corrected for the fraction of dividing and divided cells in the original sample before incubation. A microcolony was defined as a tight association of at least two cells and it was assumed that each microcolony had developed from a single cell.
3 Results
3.1 Optimization of the growth medium
The basal SF medium contained only 550 μM hydrogen carbonate buffer, which was not sufficient to maintain a stable pH during prolonged incubation, or in densely growing bacterial cultures. Consequently, an additional buffer system was needed. Potassium phosphate, HEPES, and MOPS (all 10 mM final concentration) were tested in MPN series to assess the culturability of the natural bacterial community from Zwischenahner Meer. Natural DOC was added as a carbon and energy source. Under these conditions, the pH of all MPN series, including the control without additional buffer, remained stable at pH 7.5. The highest MPN counts were observed in SF medium buffered with HEPES, which were significantly higher than those in medium containing phosphate (culturability 0.8 versus 6.8%; Fig. 1).
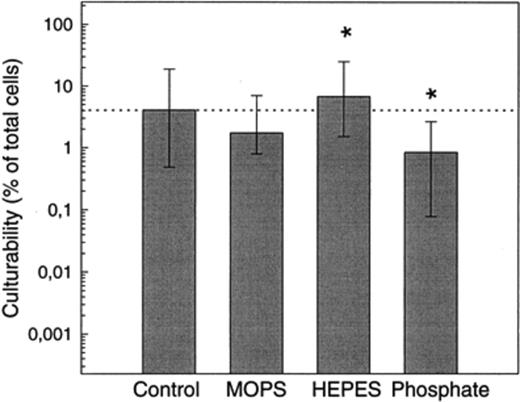
Effect of different buffers (final concentration 10 mM each) on the culturability of bacteria in May samples from Zwischenahner Meer. MPN series were set up in SF with natural DOC (1–10 kDa, 15 mg ml−1) as carbon and energy source. Error bars indicate 95% confidence intervals. Control: no buffer added. Asterisks indicate the two MPN values which were significantly different from each other at a 99% significance level.
Secondly, growth in HEPES-buffered SF medium was compared to that in modified R2A medium or YPG medium. MPN counts in SF media supplemented with low concentrations of glucose, or two different concentrations of yeast extract/peptone/glucose (YPG) were significantly higher than numbers in R2A medium (Fig. 2). The concentration of YPG in the medium had no significant effect on MPN counts.
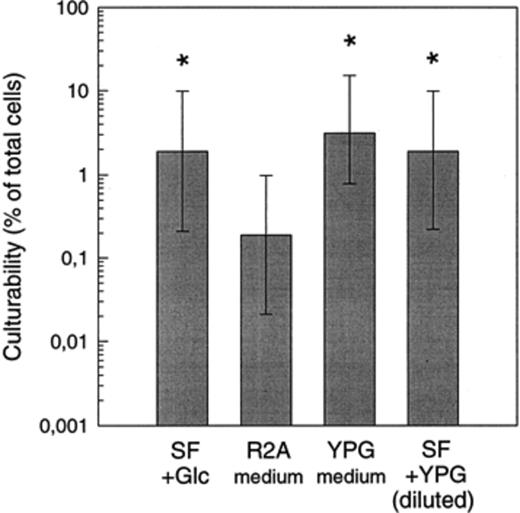
Effect of medium composition on the culturability of bacteria from Zwischenahner Meer (May sample). SF, synthetic freshwater buffered with HEPES. YPG medium containing yeast extract (0.2%), peptone (0.1%) and glucose (0.2%). SF+YPG, synthetic freshwater containing yeast extract, peptone, glucose at low concentrations (see Section 2). Asterisks denote values which differ significantly from culturability in R2A (P<0.01).
Based on these results, HEPES-buffered SF medium was employed in all following growth experiments.
3.2 Utilization of different carbon substrates
Utilization of carbon sources was tested in short term respiration and MPN experiments. Besides defined substrates, concentrated DOC of a molecular mass between 1 and 10 kDa (DOC1–10kDa) was employed. This fraction contributed 35% of the total DOC (21 mg l−1) of Zwischenahner Meer lake water (Table 1).
Carbon content and relative fluorescence intensity of different DOC fractions from Zwischenahner Meer separated by consecutive ultrafiltration through 10-kDa and 1-kDa membranes
| Fraction | Carbon contenta [mg·l−1] | Relative fluorescenceb [FI] |
| DOC<10kDa | 20.88±2.24 | 473±36 |
| DOC<1kDa | 13.55±0.91 | 125±3 |
| DOC<10kDa−DOC<1kDa | 7.33±3.23 | 236c |
| conc. DOC1–10kDad | 93.43±11.27 | 3004±144 |
| Fraction | Carbon contenta [mg·l−1] | Relative fluorescenceb [FI] |
| DOC<10kDa | 20.88±2.24 | 473±36 |
| DOC<1kDa | 13.55±0.91 | 125±3 |
| DOC<10kDa−DOC<1kDa | 7.33±3.23 | 236c |
| conc. DOC1–10kDad | 93.43±11.27 | 3004±144 |
aMean and range of two parallels.
bCalculated from three different dilutions. Excitation: 320 nm, emission: 440 nm.
cFluorescence calculated from that of DOC1–10kDa concentrate and dilution factor.
dDOC<10kDa concentrated by ultrafiltration on <1 kDa membranes (concentration factor=12.7).
In May, September and November samples, the percentage of respiring cells was determined after addition of 11 different substrates or substrate mixtures in order to find suitable substrates for the subsequent cultivation. Samples without substrate addition or fixed with glutaraldehyde (final concentration 2%) served as controls.
Depending on the substrate added the number of CTC-reducing cells in water samples ranged from 0.1% to 8.1% (Fig. 3Fig. 4). The amino acids mixture and diluted YPG consistently increased the numbers of CTC-reducing cells as compared to the unsupplemented controls (Fig. 4). The addition of glucose, glycolate, salicylate, the AUGC mixture, and the fatty acid mixture resulted in variable responses. The addition of glucose increased the number of CTC-positive cells in May and November. Glycolate stimulated CTC reduction only in November. Salicylate inhibited CTC reduction in May but significantly increased the number of CTC-reducing cells in September. The mixture of fatty acids acted inhibiting in May and September, but stimulating in November. The addition of natural DOC did not yield significantly higher counts than those obtained with some of the artificial substrates.
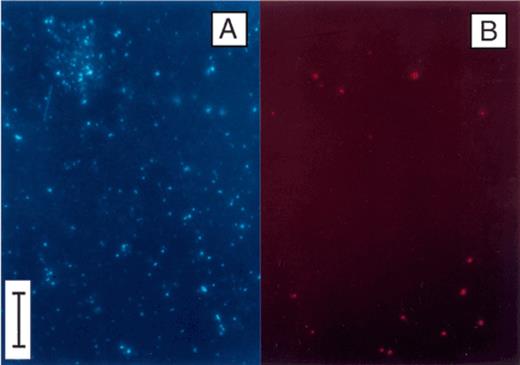
Epifluorescence photomicrographs of bacterial cells collected at 0.3 m depth in Zwischenahner Meer on 15 May 1996. The sample was incubated with CTC, and subsequently counterstained with DAPI. A. DAPI fluorescence (filter set No. 01). B. Same microscopic field showing red fluorescence of CTC-reducing cells (filter set No. 15). Bar, 10 μm.
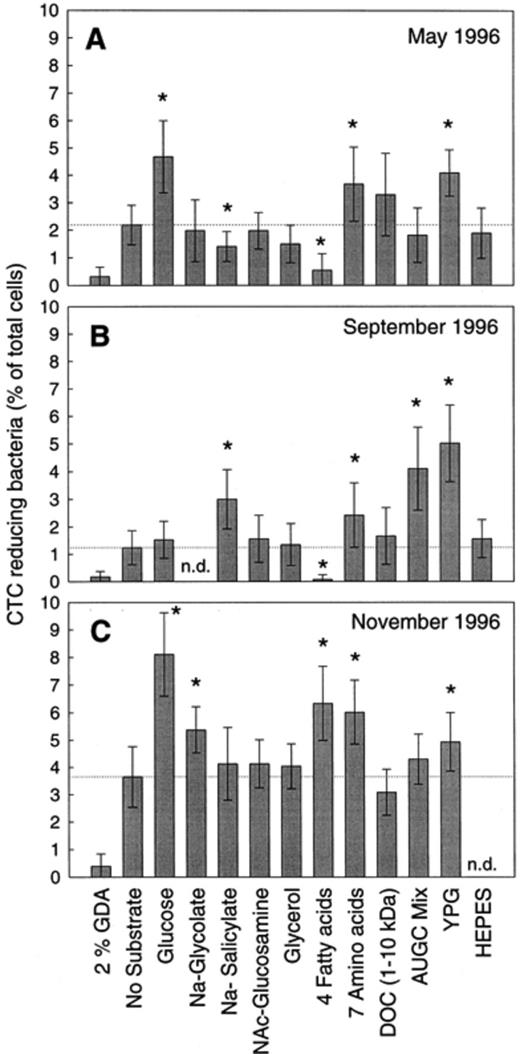
Percentage of CTC-reducing bacteria of the Zwischenahner Meer in the May (A), September (B), and November samples (C) after addition of different substrates. Error bars indicate the S.D. of cell counts (n= 15). Asterisks indicate significant differences from control without substrates (P<0.01). GDA, glutaraldehyde; four fatty acids: mixture of formate, acetate, propionate and butyrate (200 μM each), seven amino acids: alanine, arginine, asparagine, isoleucine, cysteine, tyrosine, glutamine (200 μm each); DOC, DOC1–10kDa at a final concentration of 15 mg l−1; AUGC mix: mixture of adenine, uracil, guanine and cytosine (200 μM each); YPG: yeast extract (0.0072%), peptone (0.0036%) and glucose (0.0072%). n.d., not determined.
The measurements of respiratory activity were short-term experiments and therefore did not require additional buffers besides carbonate. Therefore the effect of HEPES on respiratory activity was assessed separately in the May and September samples. The addition of HEPES (10 mM) did not result in a significant change in the number of CTC-reducing cells (Fig. 4A,B).
In the November sample glucose and the fatty acid mixture most effectively stimulated CTC reduction. Both substrates were tested in a subsequent MPN experiment using the same water sample as inoculum (Fig. 5). With glucose 5.6% of the cells were culturable, as compared to the 8.1% which exhibited respiratory activity. The mixture of fatty acids yielded 1.3% of culturable cells, while 6.3% reduced CTC.
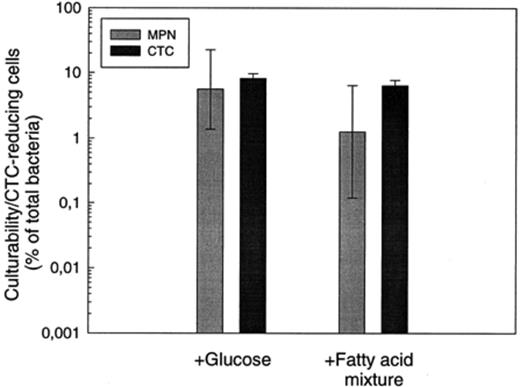
Comparison of the fractions of CTC-reducing bacteria and culturable cells in November samples from the Zwischenahner Meer. Glucose (200 μM) or a mixture of four fatty acids (formate, acetate, propionate and butyrate 200 μM each) were added as carbon and energy source. Error bars indicate standard deviation for CTC values and 95% confidence intervals for MPN values.
3.3 Viability and culturability assessed by different methods
The fraction of viable cells which could be detected either by staining with CTC or by the MPN method combined with AO counting was consistently low (<9% of the total number of bacterial cells). By comparison, the percentage of culturable cells was even four orders of magnitude lower when the growth in MPN series was assessed by turbidity measurements (Table 2).
Percentage of active or culturable cells in water of Zwischenahner Meer (May sample) assessed by different methods
| Method | Substrate | Active or culturable cells (% of total) | S.D. or 95% confidence interval |
| MPN (turbidity)a | YPG | 0.0001 | 0.00002–0.0005 |
| MPN (AO counting)b | YPG | 3.1 | 0.17–10.3 |
| MPN (AO counting) | DOC1–10kDac | 6.8 | 1.5–25.1 |
| CTC reduction | DOC1–10kDa | 3.3 | ±1.5 |
| Filter method | DOC1–10kDa | 58.3 | ±23.1 |
a10-ml samples grown in tubes, growth measured as turbidity at 436 nm.
bGrowth in 200-μl samples on microtiter plates, growth detected after acridine orange staining by epifluorescence counting.
cFinal concentration 15 mg l−1.
As a third approach, the fraction of viable cells was quantified by the filter method. This method allows one to monitor the division and thus viability of each individual cell in the bacterial community. The number of cells dividing on polycarbonate filters was determined using the same growth medium as in the MPN series and CTC reduction experiments (SF with 15 mg DOC1–10kDa l−1 as a carbon and energy source), and cells collected in May 1996.
After 10 days of incubation 58% of the cells present on the polycarbonate filter had divided at least once (Fig. 6,Table 2). Two parallels yielded the same results. With the same batch of bacterial cells and the same growth medium, the percentage of bacteria able to reduce CTC as well as the number of cells culturable in MPN experiments were one order of magnitude lower (Table 2).
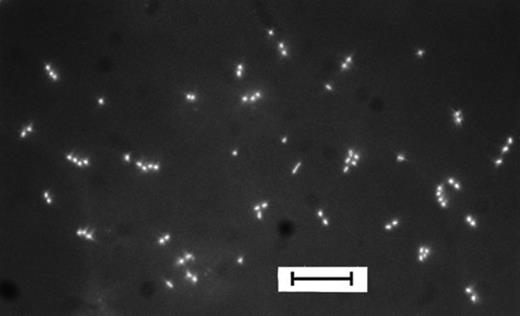
DAPI-stained cells from Zwischenahner Meer (May sample) dividing on a membrane filter which was incubated for 10 days on SF supplied with natural DOC (DOC1–10 kDa). Bar, 10 μm.
However, these high viability values were obtained for cells which were sampled in May and had been stored in liquid nitrogen. In order to confirm that the high percentage of dividing cells was not an artifact caused by storage at low temperature, the filter experiment was repeated with fresh samples obtained in October 1997 (Jaspers and Overmann, in preparation). In this case, cells of the natural bacterioplankton community were directly filtered onto membrane filters and subsequently incubated. In addition, a range of defined carbon substrates was used besides natural DOC (see Section 2). Compared to the control, filters incubated on SF medium supplemented with glucose did not exhibit a higher percentage of dividing cells (2.5 versus 3.3%). Addition of the amino acid mixture to SF medium stimulated the division of 12.9% of the cells. However, the highest fraction of dividing cells was detected on SF medium containing the fatty acid mixture (42.2%) or a mixture of all compounds, including natural DOC (53.3%). These latter results thus fully confirmed those obtained for the May samples. At least in our two independent trials it was therefore clearly demonstrated that the viability obtained on membrane filters can indeed exceed 50% of the total cell count.
4 Discussion
In the present work different approaches were taken to assess and improve the culturability of chemoheterotrophic bacteria from a eutrophic lake. Besides established techniques, a medium mimicking the natural ion concentrations and a method to monitor division of single cells were applied.
4.1 CTC reduction as a measure of viability
Because the number of CTC-reducing cells exceeded plate counts by four orders of magnitude in some environmental samples [8], it has been assumed that the CTC reduction method provides a more sensitive indicator of viability than the plate count method. In Zwischenahner Meer, however, the maximum relative numbers of CTC-reducing cells (8% of the total cell count) were 10 times lower than the values detected in groundwater and drinking water (up to 88%[8,34]). Our low values were rather unexpected for such a eutrophic environment, since in some other aquatic systems the proportion of bacteria with active electron transport systems – at least in summer – correlated positively with the trophic state [35,36].
A recent comparison of the different measures of bacterial viability demonstrated that the CTC reduction method yields much lower numbers than microautoradiography or in situ hybridization with 16S rRNA-targeted molecular probes [4]. In Zwischenahner Meer, the fraction of viable cells as determined by the filter method was 18 times higher than the relative number of CTC-reducing cells. Our study demonstrates that the CTC reduction method can lead to a serious underestimation of the number of bacterial cells which are capable to divide at least once or twice. Further support for this conclusion comes from the low fraction of CTC-reducing cells that has also been reported for bacteria from drinking water samples or from soil [34,37]. One major reason for these low counts of CTC-reducing bacteria may be the toxicity of CTC which inhibits glucose uptake and respiration, thymidine incorporation, and growth on agar plates [3].
We observed only a slight stimulation of CTC reduction after the addition of various carbon substrates to samples from Zwischenahner Meer. This is in contrast to results from other environments, where the addition of complex substrates led to a 10-100-fold increase in the number of CTC-reducing cells [8], indicating a limitation of bacterial respiration by carbon substrates.
4.2 Influence of cultivation media
A typical medium used for effective cultivation of bacteria from aquatic environments is R2A [23]. This complex medium has been used successfully for growth of a high fraction of bacterial cells in seawater or wastewater [8], and for the isolation the dominating bacterial strains from municipal drinking water [21]. In our synthetic freshwater medium MPN counts were higher than in R2A medium. Most likely, this was not caused by the nature or concentration of the carbon substrates, although complex substrates like peptone and yeast extract are known to lower the culturability of bacterial cells [38]. In our case, however, culturability in the presence of YPG at two concentrations (Fig. 2) did not differ from that with glucose as a single growth substrate. On the other hand, addition of phosphate buffer resulted in a significant decrease in culturability as compared to HEPES-buffered SF medium. This observation compares well with the fact that addition of phosphate to starved cultures of Enterobacter aerogenes can lead to substrate-accelerated death [39]. Therefore it appears plausible that the high phosphate content of the R2A medium has an inhibitory effect on bacterial growth.
Because glucose, YPG, the fatty acid mixture, and DOC1–10kDa stimulated CTC reduction, it was tested whether these substrates also increased bacterial MPN counts. However, culturability in these latter experiments did never exceed 7% even after an incubation period of 4 weeks. We conclude that the type of carbon substrate used in the MPN growth experiments was not the major determinant of the rather low culturability of bacterial cells.
4.3 Bacterial cell division as a measure of viability
Of all methods applied, the membrane filter incubation proved to be most efficient. In contrast to the results of the MPN growth experiments, almost 60% of the bacteria from Zwischenahner Meer could divide at least once or twice when incubated on the filters, and thus were in a viable state. While all cells which complete only one cell division can be detected by the filter method, the detection limit of the MPN method (8×10⁴ cells ml−1) would require 16 generations until growth of a single cell would be detectable in the well of a microtiter plate. This indicates either that bacteria divided very slowly and could not reach a sufficient population density during the incubation time of 4 weeks, or alternatively, that bacterial cells were only capable of performing very few division cycles after which growth ceased due to unknown factors.
Using MPN series and a similar detection limit of bacterial growth, an unusually high culturability of up to 60%[19] or 100%[40] has been reported for marine water samples. It remains to be elucidated why the MPN counts of samples from Zwischenahner Meer are much lower, while on membrane filters up to 60% of the cells were viable. Cells which stop growing after a few divisions may be classified as viable but nonculturable (VBNC, [37]). In drinking water, up to 65% of the bacteria appeared to be in this state [21].
Summarizing, it is concluded that culturability is not a fixed property of a cell, but is strongly dependent on the growth conditions set. The term might reflect the ability of the microbiologist to cultivate a bacterium rather than the ability of a cell to grow. Possibly specific stimuli for the transition from the VBNC to the culturable state (e.g. physical stimuli, supplines, or positive cell-cell interactions [41]) or scavenging of toxic oxygen radicals at low cell densities [42] are critical for the successful cultivation of chemoheterotrophic bacteria from environments like Zwischenahner Meer.
Acknowledgements
This study was supported by a grant from the Bundesministerium für Bildung, Wissenschaft, Forschung und Technologie (Grant 0311098).
References
Author notes
Present address: Institut für medizinische Mikrobiologie und Immunologie, Universität Hamburg, Martinistr. 52, D-20246 Hamburg, Germany.
