


Abstract
The effect of the passage through the gut of the earthworm Lumbricus terrestris L. on fungi and bacteria ingested with decomposing leaves of Taraxacum officinale and with soil was quantified using image analysis tools. Both leaf and soil material were labeled with fluorescent latex microbeads to allow a quantification of the food sources in the fore-, mid-, and hindgut of the earthworms. The content of leaf material in the gut varied in a range between 4 and 59% of the total gut content in different earthworms and the different parts of the intestine of individual animals. Filamentous fungi in the gut compartments were found to originate mainly from leaf material (7700±1800 μg (g leaf (dry wt.))−1), however, the major part was disrupted before arriving in the intestine. Remaining hyphae in the foregut with a biomass of up to 900±150 μg (g gut content (dry wt.))−1 were completely digested during passage through the earthworm gut. Spores of fungi were not detected in our studies. Bacterial cell numbers in the gut compartments ranged from 63±5×10⁸ to 327±16×108 (g gut content (dry wt.))−1 and were significantly higher than the numbers found in the soil (50±1×10⁸ cells (g soil (dry wt.))−1). Cell numbers usually increased from fore- to hindgut. This increase was not correlated to contents of organic material and only partially due to a multiplication of bacterial cells. Numbers of dividing cells accounted in total for approximately 12% of all bacteria, increasing significantly from fore- to hindgut, counts were from 10±1×10⁸ to 25±2×10⁸ (g gut content (dry wt.))−1, respectively. Average cell volumes of bacteria calculated from cell size distributions in leaf and soil material differed significantly, being 0.197 and 0.063 μm3, respectively. In the gut compartments, average cell volumes ranged from 0.043 to 0.070 μm3, which may indicate the disruption of large cells originating from the leaves before arriving in the foregut.
1 Introduction
Decomposition of plant material is assumed to be mainly mediated by microorganisms, such as bacteria and fungi [1]. The rate and extent of the decomposition depends on the chemical composition of the material, on a number of environmental factors, and on the microbial community [2],[3]. The activity of the decomposing microorganisms is accelerated by the activity of the soil fauna. Anecic earthworm species, such as Lumbricus terrestris L., for example, remove partially decomposed plant material from the soil surface and transport it to the subsurface layers. Plant material is fragmented by ingestion and eventually mixed with soil which is passed through the intestine and finally excreted as cast [4]. Earthworms therefore play a major role in the mixing of soil, in improving soil aeration, and in increasing water-holding capacity [1],[5].
Ingestion and passage through the intestine of earthworms also affects microorganisms that are associated with plant material and soil. It has been suggested that microorganisms provide a source of nutrients for earthworms with fungi as a major and bacteria as a minor source [6]. Filamentous fungi, for example, have been shown to be digested by earthworms [7–9], although other studies report increased numbers of fungi in the cast after passage through the intestine [10]. For bacteria, a few studies demonstrate a decrease or no consistent change in bacterial numbers during gut transit [10],[11]. However, more often an increase in total number of bacteria is observed [6],[12] and also higher numbers of bacteria in linings and casts compared to surrounding bulk soil [6,12–15].
Most of these studies are based on growth-dependent detection methods which might be impeded by the fact that many microorganisms are difficult to isolate or even resist cultivation. Growth-dependent detection protocols can therefore be extremely selective and often underestimate numbers of microorganisms and diversity of microbial communities [16–18]. Epifluorescence microscopy is now generally acknowledged to be the best method available for quantification of microorganisms in all habitats [19]. Quantification of total microbial communities involves staining the microorganisms in the sample with fluorochromes, such as Calcofluor M2R, fluorescein isothiocyanate (FITC), acridine orange, 4′,6-diamidino-2-phenylindole (DAPI) or europium chelate (see [20] for review). Quantification of specific populations is currently achieved by the fluorescent antibody technique in which antibody/fluorochrome conjugates bind to cells or cell components of the target organism (see [21] for review), and by the in situ hybridization technique in which fluorescent oligonucleotide probes hybridize to rRNA sequences in fixed whole cells (see [22] for review).
For the quantification of stained fungi and bacteria in aquatic and terrestrial environments, automated image analysis programs have become more and more important tools because criteria for the quantification can be defined and standardized and size measurements be used to estimate microbial biomasses [23–25]. Automated image analysis, however, depends on the availability of high-quality images. These may most reliably be obtained from heterogeneous environmental samples by advanced detection technology, e.g. by confocal laser scanning microscopy [24]. In a previous study, we obtained high-quality images also by the optimization of the sample preparation ensuring an equal dispersion of the target cells in thin layers [23], by the use of high contrast fluorochromes and by the definition and standardization of specific criteria for the automated image analysis program [26].
The aim of this study was to quantify the effect of the passage through the intestine of the earthworm Lumbricus terrestris L. on filamentous fungi and bacteria in soil and in decomposing leaves of Taraxacum officinale that were used as food source. Both soil and leaves were labeled with fluorescent latex microbeads of different sizes before feeding the animals to allow a quantification of the food source in the intestine. Filamentous fungi were quantified by image analysis after staining with Calcofluor M2R and after in situ hybridization with Cy3-labeled oligonucleotide probes. For the quantification of bacteria and the determination of bacterial biomass, an image analysis program was developed based on color differentiation to enable the differentiation of DAPI-stained bacteria from the heterogeneous background of samples of leaves, soil, and the earthworm intestine.
2 Materials and methods
2.1 Labeling of soil and leaves with fluorescent beads
Surface samples down to a depth of 10 cm from the pristine forest soil Hau (Birmensdorf, Switzerland, a silty clay with 5.6% organic material; vegetation, Aro-Fagetum, [27]) with a water content of about 30% were sieved (<4 mm) and labeled with fluorescent yellow-green latex microbeads with a diameter of 0.3 μm (surfactant free, carboxyl polystyrene latex, Interfacial Dynamics, Portland, OR, USA). An even distribution of beads in soil was achieved by spraying 25 ml of a 0.04% (w/v) bead in water solution onto a thin layer of 500 g of soil followed by careful mixing.
Green leaves of Taraxacum officinale were harvested from plants in fall. Leaves were dried under vacuum (25 mbar and 40°C) for 24 h and stored at −20°C. To increase microbial biomass, leaf pieces (area between 300 and 700 mm2) without big leaf ribs (10.5 mm in diameter) were incubated on glass fiber filters soaked with 3 ml of deionized water in Petri dishes for 6 days at 20°C and 90–100% relative humidity in the dark [28]. The glass fiber filters with the leaf pieces were subsequently placed in a solution of 0.0057% (w/v) fluorescent yellow-green latex microbeads with a diameter of 0.2 μm (surfactant free, carboxyl polystyrene latex, Interfacial Dynamics) for 30 min at room temperature. Thereafter, they were air-dried for 15 min at room temperature. The area of the leaf pieces was related to the dry weight, by measuring leaf areas of 15 leaf pieces of scanned leaves by image analysis (OneScanner, Apple) [23] and subsequently determining leaf dry weight after drying at 105°C for 24 h.
2.2 Microcosms
Individuals of the earthworm L. terrestris were retrieved from the original soil Hau using a solution of 0.1% formaldehyde [29]. They were rinsed immediately in water and kept in aerated (moist air) PVC-boxes (35 cm (l)×27 cm (w)×22.5 cm (h)) at 10°C in soil of the field site and fed with leaves of T. officinale. Experiments were performed at 15°C in the dark in microcosms consisting of Plexiglas tubes (with a diameter of 14 mm and a height of 300 mm) which were closed on the bottom and which contained one individual earthworm [28]. Tubes were filled with 50 g of soil labeled with fluorescent microbeads. A Petri dish (diameter 8.5 cm, with a hole in the center) was lined with moistened paper (Schleicher and Schuell 595) which was covered with a nylon tissue (mesh size 300 μm). The Petri dish was fixed on the top of the tube to facilitate controlled feeding of earthworms [30]. The animals were fed daily with leaf pieces labeled with fluorescent microbeads (16±4 mg (dry wt.) g−1 of earthworm live weight day−1). This amount was about 70% of the average consumption of L. terrestris when food was offered ad libitum to ensure immediate and complete consumption of the leaves. The feeding experiment lasted 4 days. Earthworm microcosms that contained withdrawn leaves in the burrows at the end of the experiment were omitted from the study.
2.3 Sample preparation
One day after the last feeding, the animals were killed in 4% paraformaldehyde at 4°C, washed in water and dissected from the ventral side. The intestine was divided into three parts, the fore-, mid- and hindgut. Subsamples of the gut sections (approximately 0.5–1.0 mg fresh weight) as well as soil samples and leaf pieces were fixed in 4% paraformaldehyde in phosphate-buffered saline (PBS) [31] for 16 h. Fixed samples were subsequently washed twice in PBS. Afterwards, subsamples of the gut sections were shaken in 5 ml of 0.1% pyrophosphate at 115 rpm at room temperature for 1 h. After removal of the intestinal wall, the suspensions were stored in 50% ethanol in PBS at −20°C [12]. Soil samples were stored in 50% ethanol in PBS at −20°C at a concentration of 50 mg of soil (dry wt.) ml−1 and leaf pieces in 5 ml of 50% ethanol in PBS [31].
Subsamples of the gut sections were dispersed in 0.1% sodium pyrophosphate in PBS at a final concentration of approximately 1–1.5 mg (dry wt.) ml−1. Soil subsamples of 25 μl (containing the equivalent of 1 mg of soil (dry wt.)) were dispersed in 975 μl of 0.1% sodium pyrophosphate in PBS. Leaf pieces were transferred into 0.5 ml of 0.1% sodium pyrophosphate in PBS, ground in a mortar, and an additional 1.5 ml of 0.1% sodium pyrophosphate in PBS was added. Subsamples of the gut sections, soil samples and leaf suspensions were homogenized with a sonicator with a 2-mm-diameter probe (Sonicator B-12, Branson, Danbury, CT) at 90 W for 1 min [28]. Thereafter, leaf suspensions were centrifuged at 5000×g for 15 min and the supernatant was partially discarded to a residue of approximately 400–800 μl. All suspensions were finally supplemented with the detergent NP40 (Fluka, Buchs, Switzerland) to a final concentration of 0.01%.
2.4 Quantification of the food source
The amount of leaf material in the samples was correlated to the number of microbeads. The correlations were evaluated on mixtures of microbead-labeled, ground leaves and microbead-labeled soil samples which were suspended in ratios of 0/100, 20/80, 40/60, 60/40, and 100/0 (dry wt.) in 0.1% sodium pyrophosphate in PBS and homogenized with a sonifier with a 2 mm diameter probe (Sonifier B-12, Branson) at 90 W for 1 min. Homogenized subsamples of 10 μl (n= 3) were spotted onto gelatin-coated slides (0.1% gelatin, 0.01% KCr(SO4)2) and microbeads were counted with a Zeiss Axiophot microscope fitted for epifluorescence with a high-pressure mercury bulb (50 W) and filter set 09 (Zeiss; G450-490, FT510, LP520) at 400× magnification (Zeiss Plan-Neofluar 40×/1.30 oil). Ratios between numbers of beads in the fore-, mid-, and hindgut of different individuals of L. terrestris were then used to calculate the contents of leaf material in the intestine.
2.5 Analysis of fungi
Fungi were stained for 60 min with a 2 mg ml−1 solution of Calcofluor M2R [23],[32] after dehydration in 10-μl aliquots of leaf (n= 10), soil (n= 10), and gut samples (n= 3) spotted onto gelatin-coated slides. Preparations were subsequently washed with distilled water and air-dried. In situ hybridizations with Cy3-labeled oligonucleotide probe EUK516 targeting all members of the Domain Eukarya [33] were performed in 9 μl of hybridization buffer (0.9 M NaCl, 20 mM Tris/HCl, 5 mM EDTA, 0.01% SDS, pH 7.2) in the presence of 20% formamide, and 1 μl of the probe (25 ng μl−1) at 42°C for 2 h [34]. After hybridization, the slides were washed in hybridization buffer at 48°C for 15 min, subsequently rinsed with distilled water, and air-dried. Slides were mounted with Citifluor solution and the preparations were examined with a Zeiss Axiophot microscope fitted for epifluorescence with a high-pressure mercury bulb (50 W) at 400× magnification (Zeiss Plan-Neofluar 40×/1.30 oil). Fungi stained by Calcofluor M2R were analyzed with filter set 02 (Zeiss; G365, FT395, LP420), whereas binding of Cy3-labeled probes was detected with filter set HQ-Cy3 (AHF Analysentechnik, Tübingen, Germany; G535/50, FT565, BP610/75).
The images were captured (exposure time 1.44 s) via a cooled CCD 3-chip color video camera C5810 (Hamamatsu Photonics) connected via a SCSI card to a Macintosh computer (Apple Power PC 9500/200) by the software U6341 (Hamamatsu Photonics) with a resolution of 992×672 pixels (RGB, 24 bit) and stored on the hard disk. Fungal biomass was determined following our image analysis protocol described previously [23], except in the first step, in which RGB-signals were converted into a gray scale image. Image analysis involved measurements of both lengths and diameters of the fungal hyphae after staining with Calcofluor M2R and after in situ hybridization with the Cy3-labeled oligonucleotide probe EUK516. The fungal biomass was calculated as B=L (d/2)2πr, where L and d were the length and the diameter of fungal hyphae, respectively, and r= 0.32 mg mm−3 was considered to be the density of fungal hyphae [35][36].
2.6 Analysis of bacteria
Ten-microliter aliquots of leaf (n= 10), soil (n= 10), and gut samples (n= 3) were spotted onto gelatin-coated slides. The preparations were allowed to air dry and subsequently dehydrated in 50, 80 and 96% of ethanol for 3 min each [33]. Bacteria were stained with a 1 μg ml−1 solution of the DNA specific dye DAPI (Sigma, Buchs, Switzerland) by incubation for 20 min at 37°C. Preparations were subsequently washed in buffer containing 10 mM Tris/HCl, pH 7.2, 5 mM EDTA, 0.01% SDS, and 0.9 M NaCl for 15 min at 48°C, washed with distilled water, and air-dried [31]. Slides were mounted with Citifluor solution and the preparations were examined with a Zeiss Axiophot microscope fitted for epifluorescence with a high-pressure mercury bulb (50 W) and filter set 02 (Zeiss; G365, FT395, LP420) at 400× magnification (Zeiss Plan-Neofluar 40×/1.30 oil).
Bacteria were analyzed in 21 images per sample with up to 400 cells per image. To enhance the contrast, the range of the color depth detected by the camera was expanded to the available 24 bit and the RGB image was separated by color channels (automated batch-function of Adobe Photoshop 4.0). The analysis consisted of three pathways, that were: (1) the detection of all objects; (2) the detection of debris (for example, soil minerals and organic material); and (3) the detection of DAPI-halos (Fig. 1). All pathways were subdivided into three major steps, that were: (1) the gray scale image processing; (2) the thresholding/binarization; and (3) the binary image processing.
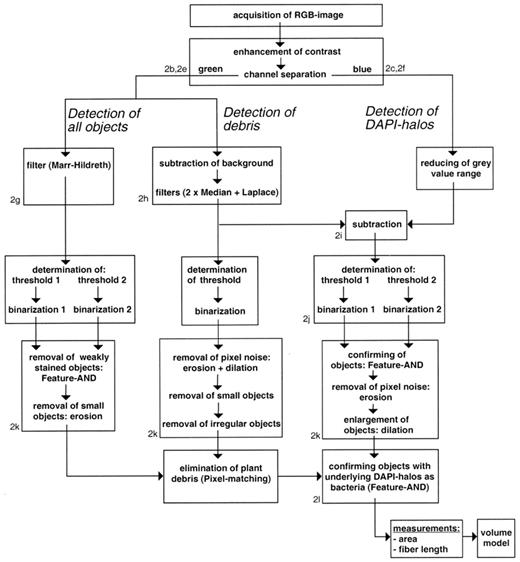
Flow chart of the image processing procedure for the analysis of bacteria. 2a–2l refer to the images presented in Fig. 2.
As for the recognition of fungi, it was essential for the quantification of bacteria to capture RGB-images. Bacteria were analyzed using an image analysis procedure based on the software Prism [37] and the image analysis tools described by Russ [26] to process the green and blue channels. While DAPI-stained cells in the captured image (Fig. 2a,d) could be recognized as distinct objects in the green channel (Fig. 2 b,e), they were indistinct and oversized in the blue channel (Fig. 2c,f). Since debris present as green or yellow particles generally showed less blue signal than bacteria, this criterion was used by the image analysis procedure to differentiate between bacteria and debris, when a differentiation based on morphological properties was not possible.
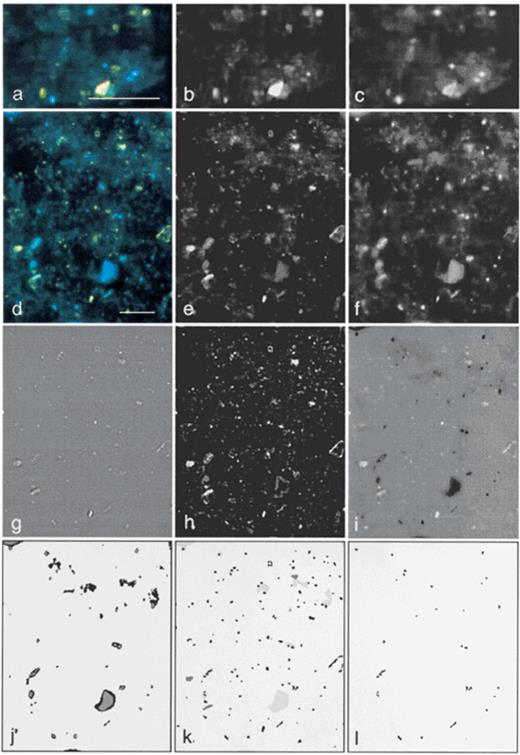
Different stages during image processing of a foregut sample of L. terrestris. High magnification views of the RGB image (a), the green channel of the RGB image (b), and the blue channel of the RGB image (c). Low magnification views (320×400 pixels) of an RGB image (d), the green channel of the RGB image (e), the blue channel of the RGB image (f), the green channel after Marr–Hildreth procedure (g); the green channel after background subtraction (h); subtraction of preprocessed images from blue and green channel (i) and the detection of DAPI-halos after binarizations (j); the combined binary image (k) showing: (1) all objects (black objects, binarization of g); (2) debris (dark gray objects, binarization of h); and (3) DAPI-halos (light gray objects); and the detection of bacteria after deletion of all non-bacterial objects (l). Scale bar: 10 μm.
For the detection of all objects, in principle, the setting of a threshold in the green channel could be used to separate the objects present in the image (brighter than the threshold value) from the background (darker than the threshold value). However, due to e.g. autofluorescence effects or inhomogeneous illumination, neither bacteria (and other particles) nor the background had a consistent brightness over the whole image area. Therefore, a reliable differentiation between objects (bacteria and other particles) and background required a special gray value transformation, the Marr–Hildreth filter (Difference of Gaussians; Ò1=1.0, Ò2=0.625) [26][38] which was used to achieve a homogeneous background and to quench large areas of fluorescence (Fig. 2g). For the calculation of the threshold, no general solution was available, since it was highly dependent on the sort and quality of the image that had to be analyzed [39]. For our images, we used a procedure that calculated the threshold range automatically by setting the lower limit to white (gray value 0) and a preliminary upper limit to gray, representing the average background which varied in the different images. The definitive upper limit was calculated by subtracting a gray value offset since the resulting gray value was found to correlate to the threshold manually determined in 20 images from each source (leaves, soil, and gut material). This step allowed automatic calculation of thresholds and to perform binarizations. Two thresholds, differing slightly by two gray values were set, followed by binarizations that resulted in two binary images. Both images were combined by a Feature-AND operation, confirming only those objects in the first image that shared at least one pixel with an object from the second image [37], enabling the removal of small and weakly stained objects. After the omission of small and weakly stained objects, the binarized image (Fig. 2k, black objects), however, not only contained bacteria, but also a lot of other, often yellow stained particles and debris.
For the differentiation of bacteria and debris, two additional procedures were necessary: (1) the detection of debris; and (2) the detection of DAPI-halos (Fig. 1). Both procedures were based on a processed image of: (1) the blue channel (Fig. 2c,f) after cutting the darkest part of the background; and (2) the green channel which had sharper structures and a more homogeneous background than the original (Fig. 2h). The detection of debris focused on the identification of large objects with an area of >2.2 μm2 with small furrowed and regular boundaries (formfactor >0.4) after preprocessing and binarization of the green channel [37](Fig. 2k, dark gray objects).
The most reliable indicator for bacteria was the halo-ring of the DAPI-fluorescence (Fig. 2a–c). This property was used to distinguish a major part of the bacteria from other particles. First, the gray value range of the blue channel was reduced to 0–225 to eliminate non-essential and disturbing background. Thereafter, the processed blue channel was subtracted from the processed green channel (Fig. 2i) which enabled the calculation of thresholds to separate the DAPI-halos from the background. The threshold was found by preliminary setting to 165 and performing an iterative decreasing or increasing of the threshold, until the area of the pixels contained in the threshold range was between 0.7 and 3% of the image area. Due to the big gray value range the DAPI-halo occurred in the processed image (Fig. 2i), two different thresholds were set. Objects detected by the larger threshold range (Fig. 2j, black pixels) were only accepted when confirmed by the smaller threshold range (Fig. 2j, gray pixels). This allowed the exclusion of blue signals which were too weak to represent DAPI-halos originating from bacteria (Fig. 2j, e.g. upper left part). Afterwards, two different binarizations, set at thresholds differing by 12 gray values (each followed by an erosion operation with a coefficient of 7 to remove pixel noise) were performed, confirming each other in the recognition of clearly visible DAPI-halos. After combining both binary images by a Feature-AND operation, objects were enlarged with a dilation operation with a coefficient of 2.
Finally, the objects detected by the left pathway (Fig. 2k, black objects) were combined with the detected DAPI-halos (Fig. 2k, light gray objects) by a Feature AND operation to identify objects as bacteria (Fig. 2l). In soil and in material from the gut of L. terrestris, non-bacterial particles were present in large amounts. When located in the direct vicinity of bacteria they were erroneously recognized as bacteria when touching or covering a DAPI-halo. Therefore, all images were checked and ‘false’ bacteria were deleted manually by click and drag operation in the resulting binary image after image processing.
Following this procedure, cell numbers and cell sizes, based on measurements of area and perimeter for each bacterium or bacterial agglomerate, were determined. After subsequent determination of fiber length and width [37], biovolumes were calculated [24] and divided up into 24 size classes ranging from 0 to 0.48 μm3.
3 Results and discussion
3.1 Quantification of the food source
Fluorescent latex beads with very defined sizes and intensive fluorescence have already been used for the evaluation of biovolumes of e.g. bacterioplankton [39], for the estimation of feeding activities of e.g. protozoa and oligochaetes [40],[41],[42] or for the modeling of retention times of bacteria in the gut of woodlice [43]. In our study microbeads with a diameter of 0.2 or 0.3 μm could reliably be differentiated by size. Numbers of microbeads in the original leaf samples were 145±6×10⁷ beads (g leaf (dry wt.))−1 and in the soil 107±4×10⁷ beads (g soil (dry wt.))−1. In mixtures of labeled leaf and soil material, the amount of leaf and soil material also correlated to the numbers of microbeads (Fig. 3). The high correlation between the amount of leaf or soil material and microbeads with a diameter of 0.2 or 0.3 μm is indicated by R-values of 0.992 and 0.981, respectively.
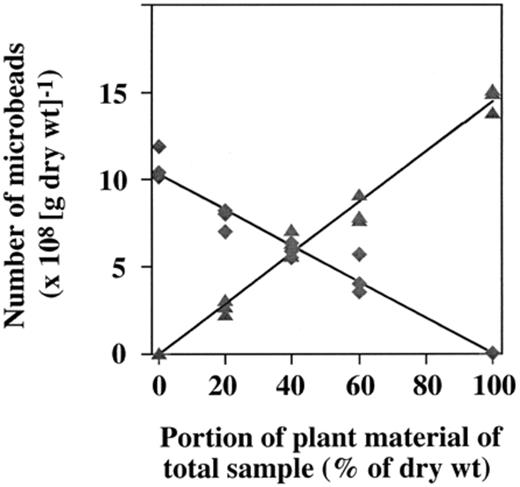
Number of microbeads with a diameter of 0.2 μm (—▲—; Y=−4621+1.45×10⁶X; R= 0.992) and 0.3 μm (—♦—; Y= 1.028−1.032×10⁶X; R= 0.981) as a function of different amounts of leaf and soil material.
In the earthworms, ratios between beads of both sizes (0.2 and 0.3 μm) and consequently the amounts of leaf and soil material differed significantly between individuals and also in different gut compartments of the individuals, the fore-, mid-, and hindgut, respectively (Fig. 4a). The number of beads was used to determine percentages of leaf material in the intestine. With approximately 5 and 10% of leaf material individuals F and A showed no significant differences in the contents throughout the whole intestine (Fig. 4b). Earthworms B and D exhibited increasing amounts of leaf material from fore- to hindgut with approximately 5–30% and 10–30%, while earthworms C, E and G had decreasing amounts of leaf material from fore- to hindgut with approximately 60 to 5%, 55 to 5% and 25 to 15% (Fig. 4b). The considerably high variability in contents of the food source between individual earthworms was attributed to the different behavior of the earthworms (time and amounts of feeding), although an accumulation of beads by retention due to the internal structure of the gut could not be excluded [43]. Such retention, however, should not influence the ratio between beads with only slightly different sizes (0.2 and 0.3 μm diameter, respectively). The correlation between bead sizes and the contents of leaf and soil material is therefore still valid.
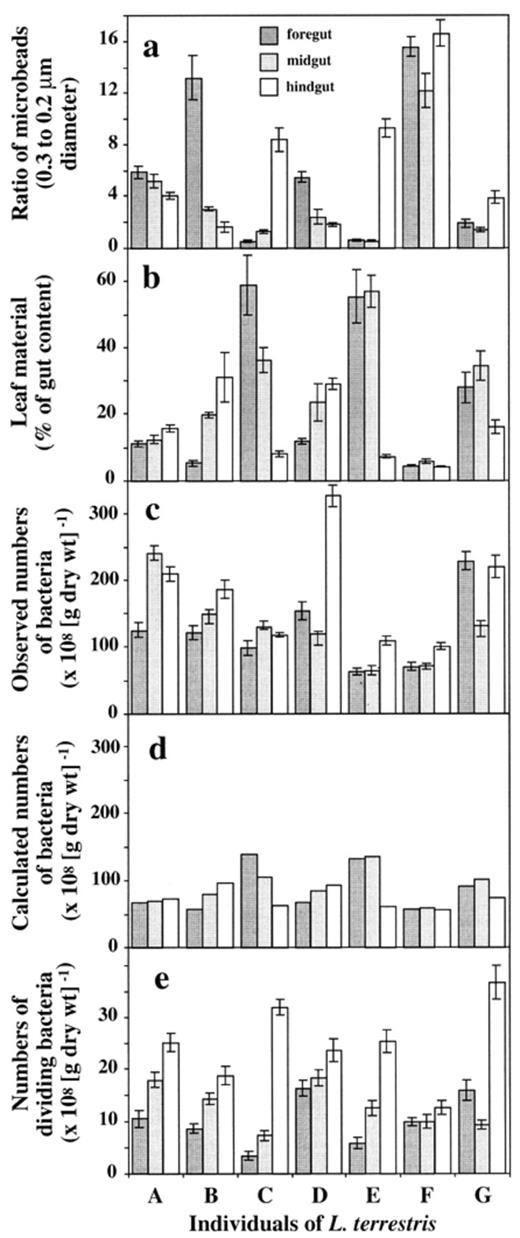
Ratios of microbeads (0.2 and 0.3 μm) (a), the amount of leaf material (b), the determined number of bacteria (c), the theoretically expected numbers of bacteria based on the amount of leaf material (d), and the number of dividing bacteria (e) in the fore-, mid-, and hindgut of seven individuals of L. terrestris (A–G), 24 h after feeding.
3.2 Analysis of fungi
For the recognition of fungi and their differentiation from leaf and soil material, it was essential to capture RGB images providing full-color information of the sample. Filamentous fungi were only detected in large amounts in leaf material where they accounted for a median length of 5760±1330 m (g leaf (dry wt.))−1. In addition to their presence on leaf material, filamentous fungi were only detected in larger amounts in the foregut of individuals B and C accounting for lengths of 190±130 and 670±200 m (g gut content (dry wt.))−1, respectively. In soil and in all remaining gut compartments of the earthworms investigated, hyphal lengths were usually less than 1% of the hyphal lengths found in leaf material. These results indicated a disruption of filamentous fungi originating from leaf material during passage through the crop and gizzard of the earthworm, confirming previous reports of a major digestion of fungal hyphae in the anterior part of the gut [44]. Remaining hyphae in the foregut might then further be disrupted during passage through the earthworm gut resulting in the complete digestion of filamentous fungi during gut transit in earthworms [45]. Spores of fungi which were reported to survive gut passage [46],[47] were not detected in our studies. This failure might be due to the absence of spores on leaf material that was incubated under conditions favoring vegetative growth of fungi or be caused by cell wall components which rendered spores impermeable for probes used for in situ hybridization.
Hyphal lengths reflected fungal biomass though the accurate determination of biomass was influenced by the staining protocol. Calcofluor M2R was shown to be a more even stain for hyphae compared to other fluorescent dyes [48]. However, Calcofluor M2R also stained cellulose which hindered reliable detection of fungi especially in leaf material (Fig. 5). Previous studies had shown that these problems could be circumvented by depolymerization of cellulose by cellulases before staining [23]. An alternative to depolymerization of cellulose was based on in situ hybridization with Cy3-labeled oligonucleotide probe EUK516 (Fig. 5). In situ hybridization with probe EUK516 targeting rRNA in the cells resulted in accurate measurements of hyphal length; however, width measurements and consequently biomass estimates were generally lower than measurements after staining with Calcofluor M2R. This was caused by the failure of in situ hybridization to visualize cell walls which were then consequently not included into measurements. The estimated fungal biomass, which is dependent upon the square of the fungal diameter, was therefore 2.2–2.3 times smaller after in situ hybridization than after a combined approach based on the determination of hyphal length by in situ hybridization and of width by measuring selected Calcofluor M2R-stained hyphae. On leaf material, fungal biomass determined after in situ hybridization accounted for 3500±800 μg (g leaf (dry wt.))−1 whereas that determined after staining with Calcofluor M2R was 7700±1800 μg (g leaf (dry wt.))−1. Similar ratios were found in the foregut of earthworms B and C with 110±80 and 410±70 μg (g gut content (dry wt.))−1 after in situ hybridization and 250±170 and 900±150 μg (g gut content (dry wt.))−1 after staining with Calcofluor, respectively.
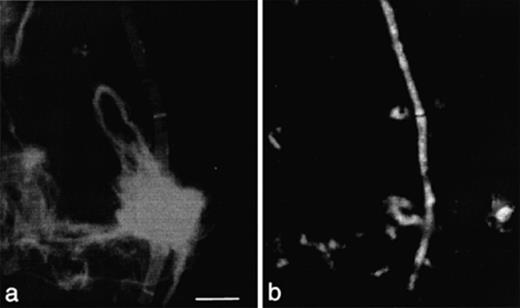
Detection of filamentous fungi in leaf material after staining with Calcofluor M2R (a) and after in situ hybridization with Cy3-labeled oligonucleotide probe EUK516 (b). Scale bar: 10 μm.
3.3 Analysis of bacteria
3.3.1 Bacterial numbers
Bacterial numbers in leaves were 216±12×108 cells (g leaf (dry wt.))−1 and in soil 50±1×10⁸ cells (g soil (dry wt.))−1. Numbers of bacteria in the gut compartments ranged from 63±5×10⁸ (g gut content (dry wt.))−1 to 327±16 108 (g gut content (dry wt.))−1 (Fig. 4c). They were comparable to the numbers found in the leaf material and generally higher than the numbers found in the soil (Fig. 4c). Bacterial numbers generally increased from fore- to hindgut which is consistent with earlier studies [6],[10],[12]. The increase was independent of the content of leaf material in the gut. In earthworm B, for example, where the amount of leaf material increased from fore- to hindgut, bacterial numbers also increased from 121±10×108 to 186±13×108 (g gut content (dry wt.))−1, respectively. In earthworm F that had only small amounts of leaf material in all three gut compartments, a slight increase in bacterial numbers from 70±6×10⁸ (g gut content (dry wt.))−1 in the foregut to 101±5×10⁸ (g gut content (dry wt.))−1 in the hindgut was determined. A slight increase in bacterial numbers towards the hindgut was also obtained for earthworm C where the amount of leaf material decreased from fore- to hindgut.
Based on the observed amount of leaf and soil material in the gut compartments, on the bacterial numbers found in the leaves and soil, and under the assumption that: (1) by ingestion and transport to the foregut, no bacterial growth or loss occurred; and (2) all bacteria in the foregut were originating from either leaf or soil material, theoretical numbers of bacteria were calculated in fore-, mid-, and hindgut (Fig. 4d). The comparison between observed and calculated numbers showed that in the foregut, the observed numbers were higher than theoretical values when the amount of leaf material was small (individuals A, B, D, F and G), and lower than expected in the foregut with large amounts of leaf material (individuals C and E) (Fig. 4d). This result suggested differential effects of passage through crop and gizzard of the earthworm on bacteria in leaf and soil material.
It has been speculated that the increase of bacterial numbers towards the end of the earthworm gut could be due to growth of bacterial cells or to an activation of dormant cells during gut passage [49],[50]. A part of this increase might be attributed to the multiplication of bacteria. Numbers of dividing cells accounted in total for approximately 12% of all bacteria, increasing significantly from fore- to hindgut with 10±1×10⁸ (g gut content (dry wt.))−1 (mean of all seven foreguts) to 25±2×10⁸ (g gut content (dry wt.))−1 (mean of all seven hindguts) (Fig. 4e). However, numbers of dividing cells did not explain the large discrepancies in bacterial numbers between observed and calculated values.
3.3.2 Bacterial cell size distribution
The ratio between bacterial numbers in leaf and soil material was 4.3 and much lower than the ratios between bacterial volumes or biomasses which were 18. This ratio was based on the estimated total bacterial biomasses of 1500±100 μg C (g leaf (dry wt.))−1 for leaves and 83±6 μg C (g soil (dry wt.))−1 for soil. The different ratios were caused by large differences in cell size distributions of the bacteria in leaf and soil material (Fig. 6). With a mean cell volume of 0.197 μm3, bacteria on the leaves were much larger than those in the soil where the mean cell volume was 0.063 μm3. Soil is normally a poor nutritional environment for bacteria compared to decomposing leaves in our experiments where decomposition was initiated under favorable laboratory conditions. Bacteria may adapt to the nutrient-limited soil environment by the formation of resting or dormant cells, such as dwarf cells, cysts or spores, which are usually much smaller in size than cells growing under optimal conditions [51],[52]. In soil, for example, about 70% of the bacterial community may be represented by dwarf cells with a diameter of less than 0.3 μm [53].
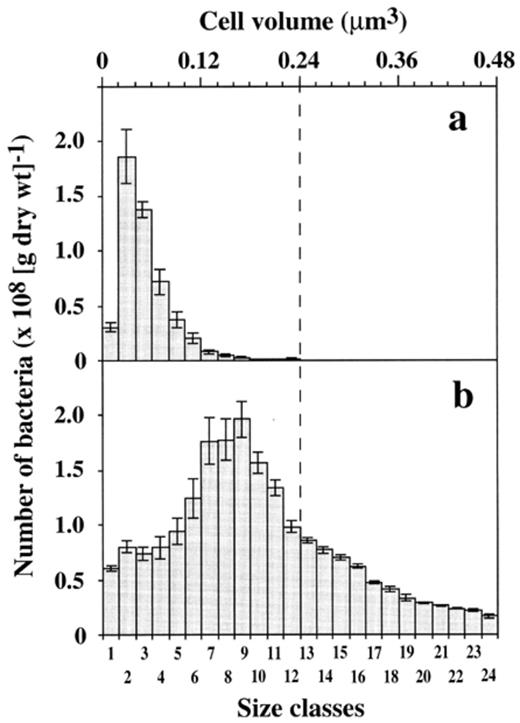
Size distribution of DAPI-stained bacteria in soil (a) and leaf material (b). Scales for cell volumes as well as for size classes apply for both soil and leaf material.
In our study, the total average cell volume of bacteria in the fore-, mid-, and hindgut of all earthworms A–G (all gut compartments of all individuals) was 0.050 μm3 which was comparable to size ranges of bacteria in soil (0.063 μm3). It is much smaller than the mean cell volume of bacteria on the leaves (0.197 μm3), suggesting a disruption of larger cells originating from leaf material. This suggestion was supported by size distributions of bacteria in the gut compartments which reflected the size distribution of bacteria in soil rather than that on leaves. Size distributions of bacteria in the gut compartments did not increase when the contents of leaf material increased. In earthworm B, for example, where the amount of leaf material increased from fore- to hindgut, the total average cell volume for all three gut compartments was 0.050 μm3. Similar results were obtained on individual F that had only small amounts of leaf material in all three gut compartments. With a total average cell volume of 0.043 μm3 in all three gut compartments, this earthworm showed no significant shift in the bacterial sizes between fore- and hindgut. Only in individual C, a shift from larger bacteria with a mean volume of 0.070 μm3 in the foregut to smaller bacteria with a mean volume of 0.044 μm3 in the hindgut was observed (Fig. 7), which was consistent with the decreasing amount of leaf material from fore- to hindgut (Fig. 4b). Based on cell size distributions of bacteria in soil and leaves (Fig. 6), calculated cell size distributions for this earthworm (C), however, displayed a much broader range of cell sizes with many cells in larger size classes (Fig. 7), again suggesting a disruption of larger cells after ingestion by the earthworm.
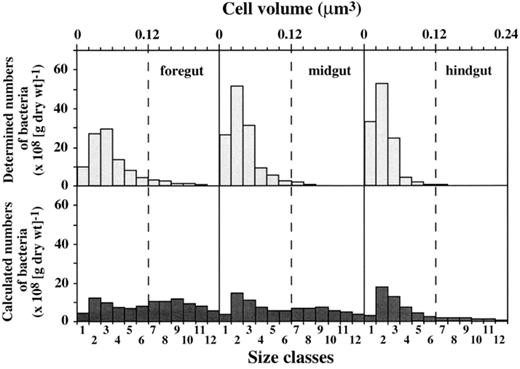
Size distributions of observed and calculated bacteria in fore-, mid-, and hindgut of individual C of L. terrestris. Scales for cell volumes as well as for size classes apply for both observed and calculated numbers of bacteria.
The shift in bacterial cell size distribution from large to smaller cells after ingestion, mixing and comminution of the leaf and soil material might be the result of a mechanical disintegration of bacteria by shearing forces during passage through crop and gizzard [4]. Shearing forces resulting in disintegration might be more pronounced on large, vegetative cells of bacteria than on smaller, dormant stages. Numbers of bacteria determined in the foregut might, therefore, be smaller than theoretical values in samples with high amounts of leaf material (earthworms C and E).
Numbers of bacteria in the foregut might be higher than theoretical values in samples with small amounts of leaf material (individuals A, B, D, F and G) because dormant cells protected from digestion by additional cell wall constituents that also act as permeation barrier for stains or probes became detectable after removal of these constituents by shearing forces. Both assumptions, the digestion of vegetative cells as well as an activation of dormant cells, such as spores, have been shown to happen during gut passage [54].
These results showed the importance of considering cell sizes in addition to counts during the study of natural microbial populations. This was important when comparing fungi and bacteria in habitats where the nutrient situation varied considerably as in the case of decomposing leaves, soil and the earthworm gut. The analysis of the different habitats showed that, for example, the same bacterial numbers could account for completely different biomasses.
Acknowledgements
This work was supported by grants from SANDOZ AGRO SA, Basle, the Swiss National Science Foundation (Priority Program Biotechnology), and the Swiss Federal Office of Environment, Forests and Landscape (BUWAL).
References
