


Abstract
Nitrate is known to suppress CH4 production in anoxic soil. Three hypotheses have been proposed to explain the mechanism: redox shift; competition for methanogenic substrates by denitrifying bacteria; or inhibition by toxic denitrification intermediates (nitrite, NO, N2O). Since recent studies have shown that methanogens and methanogenesis are not necessarily prevented in being active under positive redox potential, only the latter two hypotheses remain valid. In order to test which of the remaining two hypotheses better explains this suppression, we studied the effect of added electron donors (acetate, H2, propionate) on the suppression of CH4 production in rice soil. Addition of nitrate to a methanogenic rice soil slurry completely suppressed CH4 production. The addition of acetate, H2 or propionate in the absence of nitrate stimulated CH4 production. However, when they were added together with nitrate, CH4 production was also suppressed, although the complete suppression of methanogenesis was shortened. Thus, addition of electron donors could not prevent the inhibition of methanogenesis by nitrate. We conclude that the main mechanism involved in the suppression of CH4 production by nitrate is the inhibition of methanogenesis by denitrification intermediates rather than the competition between denitrifiers and methanogens for substrates. The duration of the suppression by nitrate was closely related to the ratio of electron donor to electron acceptor. The greater this ratio, the shorter the suppression, indicating that nitrate and its potentially toxic denitrification intermediates nitrite, NO and N2O were then faster reduced to non-toxic N2.
1 Introduction
A steady increase of the atmospheric CH4 concentration may have important consequences for the global climate [1]. Anoxic soils, such as rice paddies, are a major source of atmospheric CH4. They may account for as much as 20% of the global atmospheric CH4 budget [2–4]. With a growing world population and demand for rice, strategies to mitigate the increased CH4 emissions following the expansion of rice cultivation are needed for the future. In this perspective, since methanogenic archaea are responsible for CH4 production in rice fields, it is important to better understand the ecology of these microorganisms in their habitat. Under anaerobic and reduced conditions, methanogens produce CH4 from either the reduction of CO2 with H2 (hydrogenotrophic) or from the fermentation of acetate to CH4 and CO2 (aceticlastic) [5]. In nature, the latter mechanism accounts for about two-thirds of the CH4 emitted [6]. Under steady-state conditions in anoxic rice fields, the aceticlastic pathway is dominant and accounts for about 75–80% of the total CH4 emitted [7,8].
In anoxic rice paddy soil, the addition of NO−3, Fe3+, and SO2−4 lead to suppression of CH4 production [9]. It was found that methanogens were out-competed by anaerobic bacteria using either SO2−4 or Fe3+ as terminal electron acceptor for H2, a common methanogenic substrate [9,10]. Sulfate-reducing bacteria in freshwater sediment were found to have a lower half-saturation constant and threshold for H2 uptake than methanogens, leading to a lower H2 partial pressure when sulfate is available thus preventing activity of methanogens [11,12]. A similar competitive mechanism for acetate between sulfate-reducing bacteria and methanogens has also been reported [13,14]. Other studies in freshwater sediment have found that ferric iron-reducing bacteria also out-compete sulfate-reducing bacteria and methanogens for H2 and acetate [15].
The case of suppression of CH4 production by nitrate has not been as thoroughly studied as that by sulfate. Nevertheless, three mechanisms for the suppression by nitrate have been postulated. The first hypothesis is that nitrate increases the redox potential, which prevents methanogens from being active [16]. However it was shown recently that high positive redox potentials (+420 mV) neither prevented the initiation of methanogenesis in anoxic paddy soil [8] nor the CH4 production in axenic cultures of Methanosarcina barkeri[17], and that CH4 production in an anaerobic sludge reactor was suppressed following the addition of nitrate despite maintaining the redox potential at −290 mV [18]. Similarly, experiments on salt marsh sediments with nitrate solutions and resazurin as a redox indicator, did not find any difference when the redox potential was maintained at negative values with cysteine [19]. Recently, in anoxic rice soil or on axenic cultures of Methanosarcina barkeri and Methanobacterium bryantii, no increase of the redox potential following the addition of nitrate, nitrite, NO, or N2O was observed during the suppression of CH4 production [7,20]. Therefore, we believe that this hypothesis is no longer valid and do not specifically address it in the present paper.
The second hypothesis is a competitive mechanism between denitrifying bacteria and methanogens for common substrates (acetate, H2) similarly to the mechanism found for the suppression of CH4 production by sulfate or ferric iron [16,21]. Addition of nitrate or of denitrification intermediates to methanogenic soil slurries was found to result in a decrease of the H2 partial pressure which may be interpreted as due to competition for H2 between denitrifiers and methanogens [7]. However, the acetate concentration in the soil slurries did not decrease following the addition of nitrate indicating that competition may not be the mechanism responsible for the inhibition of the aceticlastic methanogenesis [20]. Furthermore, in a salt marsh, CH4 production was suppressed by nitrate even if the H2 and CO2 were present in excess during the experiments [19].
The third hypothesis is that denitrification leads to accumulation of intermediates (nitrite, NO, N2O) that are toxic for methanogenic archaea. This hypothesis was formulated by Balderston and Payne [19] following a study of a salt marsh sediment. Indeed, denitrification intermediates were found to be toxic to axenic cultures of Methanobacterium thermoautotrophicum, Methanobacterium formicicum, Methanosarcina barkeri and Methanobacterium bryantii [19,20]. Therefore, it was proposed that toxic intermediates of denitrification were responsible for the inhibition of methanogenesis in anoxic rice soils [7].
We analyzed the effect of the addition of electron donors (acetate, H2, propionate) on the suppression of CH4 production by nitrate in a rice paddy soil. If the competitive model is the main mechanism for suppression of methanogenesis, addition of acetate or H2 should relieve, at least partially, the suppression of CH4 production. However, otherwise, if there is no relief of the suppression observed, one would have to conclude that toxicity rather than competition is the main mechanism involved. We used nitrate concentrations (<10 mM) that are realistic for rice field soil, especially regarding the commonly high rates of fertilizer application (200 kg N ha−1 equivalent to 143 μmol cm−2).
2 Materials and methods
2.1 Soil samples
The soil used in this work was sampled in 1995 from rice fields of the Rice Research Institute near Arborio, in the valley of the river Po, Italy. The soil texture was similar to the soil from Vercelli which has been described elsewhere [9,22]. The organic carbon content was 1.9% (w/w) as previously reported [8]. The soil was air-dried and stored at room temperature. The dry soil lumps were broken using a mechanical grinder, and sieved through a 0.5 mm mesh size. Soil slurries were prepared in 1-l screw-capped Erlenmeyer flasks (Ochs, Göttingen-Bovenden, Germany) with a soil:water ratio of 1 g dry weight (dry wt.) soil per 1 ml water. A total of 250 or 500 g soil (dry wt.) plus 250 or 500 ml sterile bi-distilled water was added to each flask. Each flask was closed with a latex stopper and a screw-cap fitted on top of it. The soil slurry was then sparged with N2 gas (15 min) using a Hungate needle method and statically incubated at 25°C. For each experiment, three flasks were prepared for gas determinations (CH4, N2O, NO) by gas chromatography (GC) and two flasks for liquid sampling (for details see [8]). Slurry samples (approximately 10 ml) were withdrawn by gravity through a side port located at the bottom of the flasks into a plastic test tube for determination of the pH and the redox potential as described elsewhere [8]. Pore water was also extracted from soil slurries in microcentrifuge tubes (1.5 ml) by microcentrifugation (14 000 rpm, 10 min). The supernatant was frozen until chemical analyses of the anions (NO−2, NO−3, SO2−4) by ionic chromatography and of the organic acids by high-pressure liquid chromatography (HPLC). Soil slurries were incubated either 20 or 37 days to allow for the complete reduction of nitrate, ferric iron, and sulfate, and ensure a linear rate of CH4 production.
2.2 Electron donor experiments
After the preincubation, soil slurries in the flasks used for the gas determinations were dispensed into 100-ml serum bottles, in 60-ml aliquots, in a glove box maintained under a N2 atmosphere (100%). The serum bottles were capped with black-butyl rubber stoppers sealed with aluminum crimps. A sterile solution of NaNO3 (0.1 M), which was made anoxic by flushing with N2, was added (2 ml) to slurries immediately after closing the flasks. Anoxic acetate and propionate solutions were prepared by neutralizing the free acids with NaOH (1 M) to pH 7.0 and then flushing the solution with N2 using a sterile needle. The acetate (1 M) and propionate (1 M) solutions were added (400 and 267 μl per bottle, respectively) to obtain final concentrations (10 and 6.7 mM, respectively) approximately giving a ratio of 4C:1N as proposed by Payne [23] for the study of carbon metabolism by denitrifiers. Pure H2 gas (30 ml) was added after previously withdrawing the same volume from the headspace with a syringe. For each treatment, two bottles were prepared for gas determinations (CH4, N2O, NO) by GC and two bottles were prepared for slurry sampling. The bottles were statically incubated at 25°C. Gas samples (1 ml) were taken with a gas-tight syringe after vigorously shaking the bottles by hand. Slurries were sampled using N2-flushed disposable syringes fitted with 16-gauge needles (Becton-Dickinson), microcentrifuged (14 000 rpm, 10 min) in two 1.5-ml microcentrifuge tubes for each replicate of each treatment. The supernatant was frozen in one 1.5-ml microcentrifuge tube for later determination of anions (NO−3, NO−2, SO2−4) by ion chromatography and another reaction tube for later determination of organic acids by HPLC.
2.3 Analytical methods
Gas concentrations were determined by gas chromatography [24]. Methane was measured on a Carlo Erba Instrument with a Porapak Q column, N2 as a carrier gas, and a flame ionization detector (FID) [8]. Hydrogen concentrations (<10 Pa) were measured on a reductive gas analyzer (RGD2) with a molecular sieve column and synthetic air as carrier gas [8]. Nitrous oxide was measured on a Carlo Erba Instrument with a Porapak Q column, He as carrier gas, and an electron capture detector (ECD) [25]. Nitric oxide was measured on a thermoelectron chemiluminescence NOx analyzer [26]. Under the experimental conditions used for these experiments, 1 kPa partial pressure of a gaseous compound was equivalent to a total of 25 μmol of this compound in the headspace of the flask.
Organic acids (acetate and propionate) concentrations in the pore water were measured by HPLC with a refractory index detector (Sykam, Gauting, Germany) [8]. Nitrate and nitrite concentrations in pore water were measured by HPLC, using a UV detector set at 218 nm.
2.4 Statistical analyses
Every experiment was performed in duplicate flasks. In order to allow a stoichiometric comparison between the various reactants and products measured in the course of these experiments, we calculated all the rates as μmol per flask per day. In our experimental soil microcosms, 1 μmol per flask per day was equivalent to 33 nmol per gram dry wt. per day. Rates of production of gases, or consumption of nitrate or electron donors were computed by linear regression through the linear portion of the plot [27] using Microsoft Excel 5.0 (Microsoft, Redmont, WA, USA). Non-linear regression was computed using Kaleidagraph (Synergy Software, Reading, PA, USA).
To compare concentrations of H2 or acetate during the suppression phases, one-way analyses of variance (ANOVA) [27] were computed for presence or absence of nitrate as the factor tested. To compare rates of CH4 production and rates of nitrate, acetate, H2, or propionate consumption, we performed two-way ANOVAs [27] with treatments and time as factors. Since the data were repeated measures, the ANOVAs were corrected using the Greenhouse–Greenberg method. When an overall ANOVA was significant, we compared the treatments using Scheffé test. The ANOVAs were computed using Statistica for Windows 5.1 (Statsoft, Tulsa, OK, USA).
3 Results
3.1 Soil slurries not supplemented with methanogenic precursors
The addition of nitrate to a methanogenic rice soil slurry completely stopped CH4 production (Fig. 1; Table 1). The suppression lasted for 14 days after the addition of the anoxic nitrate solution. In flasks with no added nitrate, the H2 partial pressure remained at about (mean±S.E.) 2.8±0.1 Pa (days 21–35) (Fig. 1). Following the addition of nitrate, the H2 concentration dropped to 0.8±0.1 Pa in the soil slurry microcosms during the suppression period. This was a significantly lower H2 concentration than in the control flasks (one-way ANOVA P<0.05) (Fig. 1). During this 14-day period, in soil slurries not supplemented with NaNO3, the acetate concentration remained at 67±2.6 μM (days 21–35). Addition of NaNO3 to this methanogenic soil slurry decreased the acetate concentration, but not significantly (P>0.05) to an average value of 55±2.8 μM (days 21–30). Propionate was not detected in these soil slurries, neither with nor without nitrate addition (detection limit=10 μM).
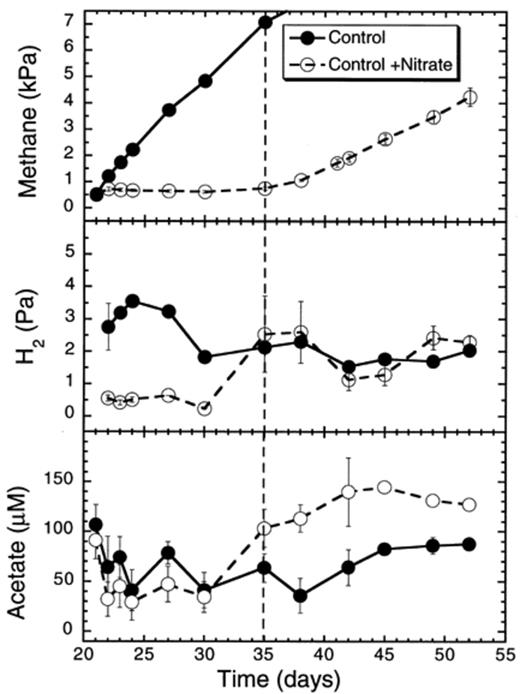
Effect of nitrate on CH4 and H2 partial pressures, and on acetate and propionate concentrations in rice soil slurries. Nitrate was added after 21 days of anaerobic incubation. The dashed line indicates the time when methanogenesis in the nitrate treatments resumed. Data points are average of duplicate flasks and error bars represent ±1 S.D.
Rates of methane production in slurries of a rice paddy soil after the addition of nitrate and acetate, H2, or propionate
| Treatments | CH4 production (μmol day−1) | Inhibition (days) | Inhibition (%) | Nitrate consumption (μmol day−1) | Acetate consumption (μmol day−1) | Hydrogen consumption (μmol day−1) | Propionate consumption (μmol day−1) |
| Control | 11.5b (0.3) | ||||||
| Control+nitrate | 0.0a (0.1) | 14 | 99.7 | 20.2a (3.6) | |||
| Acetate | 61.2c (2.9) | 34.4a (9.5) | |||||
| Acetate+nitrate | 0.3a (0.8) | 3 | 99.6 | 58.0b (4.3) | 62.9a (7.5) | ||
| Hydrogen | 14.9b (0.5) | 26.6a (17.2) | |||||
| Hydrogen+nitrate | 0.6a (0.2) | 9 | 96.2 | 25.4a (3.3) | 39.4a (9.6) | ||
| Propionate | 15.8b (0.6) | 8.1a (5.6) | |||||
| Propionate+nitrate | 1.2a (0.3) | 6 | 92.4 | 33.6ab (6.5) | 17.6a (4.8) |
Rates were calculated by linear regression using the data obtained between days 21–35 (control), days 21–24 (acetate), days 21–30 (H2), and days 21–27 (propionate) and are expressed in μmol per flask per day (1 μmol day−1=33 nmol day−1 g dry wt.−1). The standard errors of the regression coefficients are shown in brackets.
Different letters in a column indicate significant differences (P<0.05) based on a Scheffé comparison following univariate two-way ANOVA corrected with the Greenhouse–Geisser method for repeated measures.
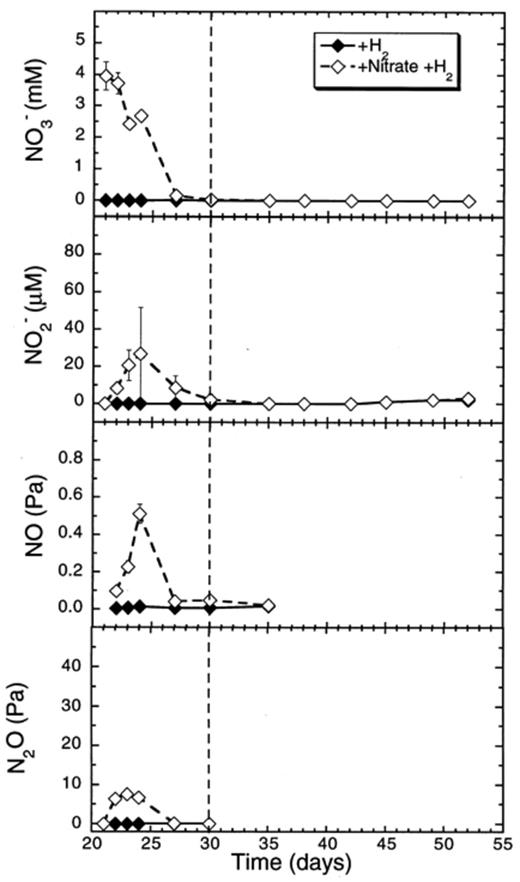
In soil slurries not amended with nitrate, neither nitrate nor denitrification intermediates (nitrite, NO, N2O) were detected (Fig. 2). In soil slurries to which nitrate was added, nitrate decreased at a rate of 20.2 μmol flask−1 day−1 (days 21–27) (Table 1). Nitrite, NO and N2O accumulated transiently to 35 μM day−1, 0.3 and 20 Pa, respectively, and were subsequently consumed again (Fig. 2). All the intermediates were completely reduced within the period during which CH4 production was suppressed.
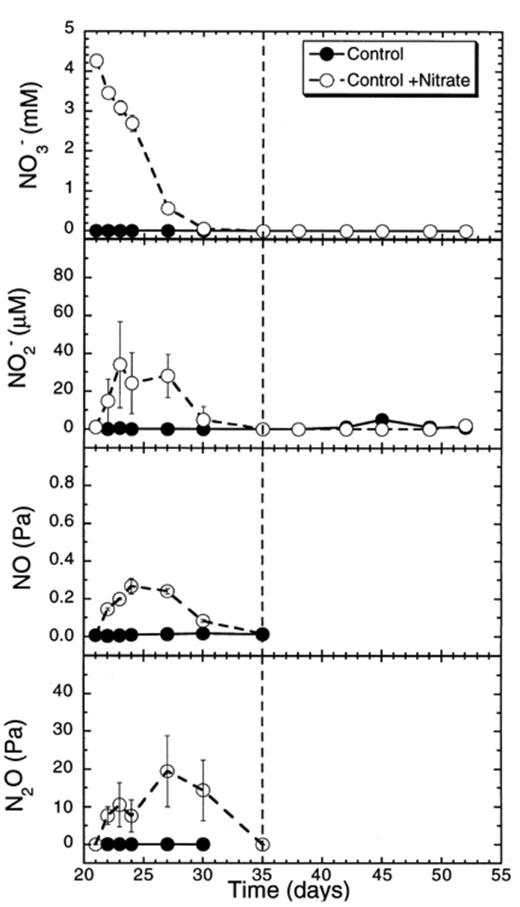
Concentrations of nitrate and of denitrification intermediates (NO−2, NO, N2O) in rice soil slurries supplemented and not supplemented with nitrate. The dashed line indicates the time when methanogenesis in the nitrate treatments resumed. Data points are average of duplicate flasks and error bars represent ±1 S.D.
3.2 Effect of acetate on nitrate suppression of methane production
Addition of acetate to a methanogenic rice soil slurry greatly stimulated CH4 production (61.2 μmol flask−1 day−1; days 21–24) when compared to the previous control (Fig. 3; Table 1). Added acetate was consumed at a rate of 34.4 μmol flask−1 day−1. It did not prevent the suppression of CH4 production following the addition of nitrate (Fig. 3). The period of suppression was decreased to only 3 days, which was nearly five times shorter than in the soil slurries not supplemented with acetate. During this suppression period, the H2 partial pressure in the flasks with acetate plus nitrate decreased significantly to 0.8–1.0 Pa on days 22–23 (one-way ANOVA P<0.05) when compared to flasks supplemented with only acetate (2.1±0 Pa). When the CH4 production resumed, we also observed an increase in the H2 partial pressure. The added acetate was initially consumed at rates of 34.4 μmol flask−1 day−1 and 62.9 μmol flask−1 day−1 (days 21–24) without or with added nitrate, respectively (Table 1). The difference in the rates was not statistically significant. Propionate transiently accumulated in soil slurries with and without a nitrate supplement. However the accumulation of propionate was greater (100 μM) and lasted longer (17 days) in the soil slurries with a nitrate addition than without it (60 μM, 9 days) (Fig. 3).
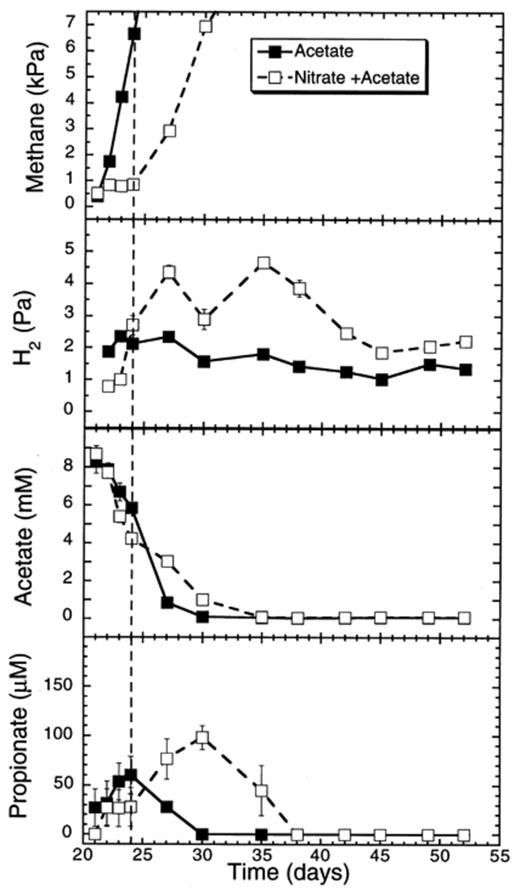
Effect of acetate additions on CH4 and H2 partial pressures, and on acetate and propionate concentrations in rice soil slurries supplemented and not supplemented with nitrate. The dashed line indicates the time when methanogenesis in the nitrate treatments resumed. Data points are average of duplicate flasks and error bars represent ±1 S.D.
Nitrate decreased much faster in soil slurries with added acetate (58.0 μmol flask−1 day−1) than in control slurries with no acetate supplement (Figs. 2 and 4). Again, nitrite, NO and N2O accumulated transiently. The period during which all the nitrogen oxides accumulated was much shorter in the presence than in the absence of additional acetate (Fig. 4). The maximum concentrations observed were 70 μM, 0.2 and 40 Pa, for nitrite, NO and N2O, respectively (Fig. 4). In general, the addition of acetate increased the overall rate of denitrification.

Effect of acetate additions to concentrations of nitrate and of denitrification intermediates (NO−2, NO, N2O) in rice soil slurries supplemented and not supplemented with nitrate. The dashed line indicates the time when methanogenesis in the nitrate treatments resumed. Data points are average of duplicate flasks and error bars represent ±1 S.D.
3.3 Effect of hydrogen on nitrate suppression of methane production
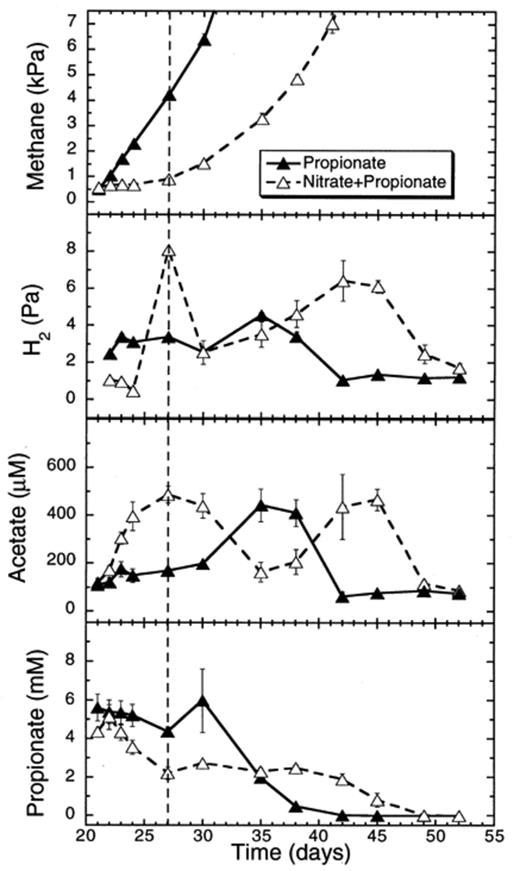
Addition of H2 alone slightly stimulated the CH4 production in anoxic rice soil slurries (Fig. 5) when compared to slurries with no electron donor supplement (Table 1). Nevertheless, H2 did not alleviate the suppression of CH4 production by nitrate (Table 1). The suppression lasted 9 days during which H2 stayed almost constant (Fig. 5). Subsequently, most of the H2 was consumed between days 10 and 15 after the addition of H2, irrespective of the presence or absence of nitrate (Fig. 5).
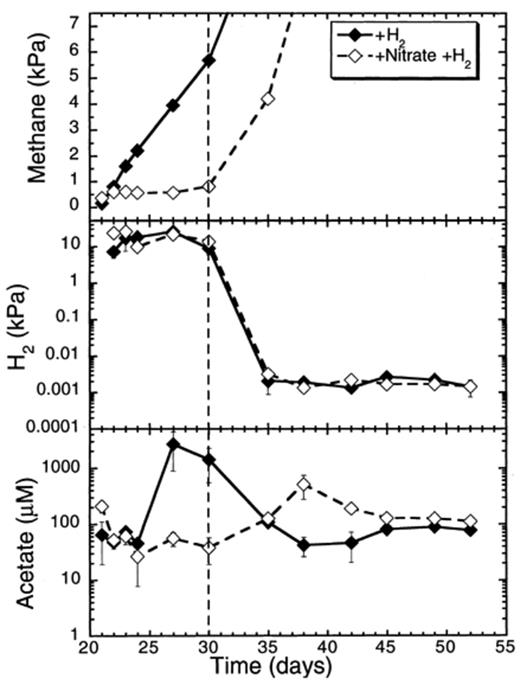
Effect of hydrogen additions on CH4 and H2 partial pressures, and on acetate concentrations in rice soil slurries supplemented and not supplemented with nitrate. The dashed line indicates the time when methanogenesis in the nitrate treatments resumed. Data points are average of duplicate flasks and error bars represent ±1 S.D.
Nitrate decreased at a rate of 25.4 μmol flask−1 day−1 (days 21–30) in slurries supplemented with H2 (Table 1). Nitrite accumulated up to 30 μM, while NO and N2O accumulated, respectively, up to 0.5 and 10 Pa (Fig. 6).
Effect of hydrogen additions to concentrations of nitrate and of denitrification intermediates (NO−2, NO, N2O) in rice soil slurries supplemented and not supplemented with nitrate. The dashed line indicates the time when methanogenesis in the nitrate treatments resumed. Data points are average of duplicate flasks and error bars represent ±1 SD.
3.4 Effect of propionate on nitrate suppression of methane production
The addition of propionate, a more distant methanogenic precursor slightly stimulated the rate of CH4 production in anoxic rice soil slurries (15.8 μmol flask−1 day−1) (Fig. 7; Table 1). However, propionate did not relieve the suppression of CH4 production following the addition of nitrate (Table 1). The suppression lasted 7 days. During this phase, the H2 partial pressure decreased to 0.5–1.0 Pa following the addition of nitrate, which was significantly (one-way ANOVA P<0.01) lower than the 3.1±0.0 Pa measured in the flasks to which no nitrate was added. When the methanogenesis resumed, the H2 partial pressure in nitrate-treated flasks returned to values similar to soil not supplemented with nitrate.
Effect of propionate additions on CH4 and H2 partial pressures, and on acetate and propionate concentrations in rice soil slurries supplemented and not supplemented with nitrate. The dashed line indicates the time when methanogenesis in the nitrate treatments resumed. Data points are average of duplicate flasks and error bars represent ±1 S.D.
When compared to control slurries, the addition of propionate (Fig. 7) slightly increased the acetate concentration to 144±4 μM (Fig. 1). Interestingly, the acetate concentration in soil slurries to which nitrate was added increased up to 500 μM during the suppression phase of methanogenesis (Fig. 7). When methanogenesis resumed, the acetate concentration decreased again to about 150 μM. However, acetate concentrations changed repeatedly in the propionate-treated soils, both in presence and absence of nitrate, for reasons that could not be identified (Fig. 7).
Propionate was consumed faster with added nitrate (17.6 μmol flask−1 day−1) than without it (8.1 μmol flask−1 day−1) between days 21 and 27, but the difference was not statistically significant (Table 1). After the depletion of nitrate, the propionate concentration stayed relatively constant (2.5 mM) until the 17th day of incubation when propionate consumption resumed (Fig. 7).
The added nitrate was consumed at a rate of 33.6 μmol flask−1 day−1 when propionate was added (Table 1). All the added nitrate was depleted within 6 days (Fig. 8). This period corresponded to the suppression of CH4 production and also to the initial consumption of propionate. During this phase, nitrite accumulated up to 150 μM, while NO accumulated up to 0.3 Pa, and N2O accumulated up to 80 Pa (Fig. 8).
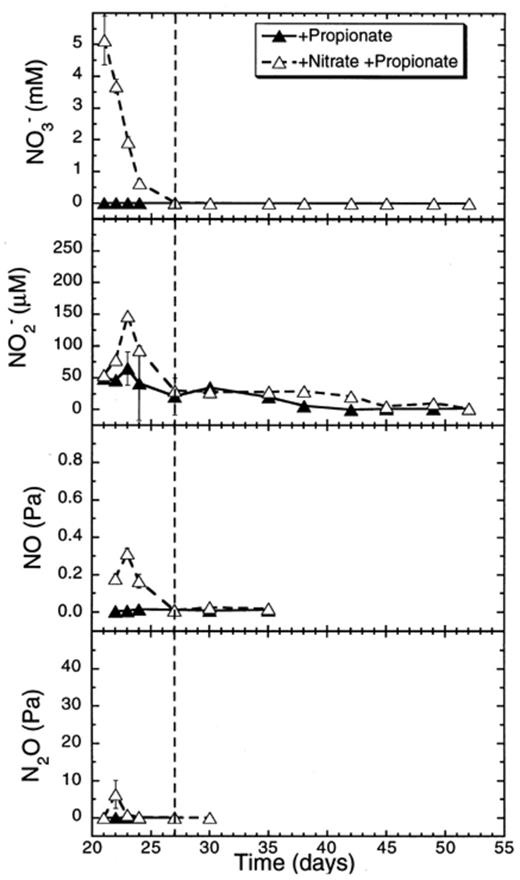
Effect of propionate additions to concentrations of nitrate and of denitrification intermediates (NO−2, NO, N2O) in rice soil slurries supplemented and not supplemented with nitrate. The dashed line indicates the time when methanogenesis in the nitrate treatments resumed. Data points are average of duplicate flasks and error bars represent ±1 S.D.
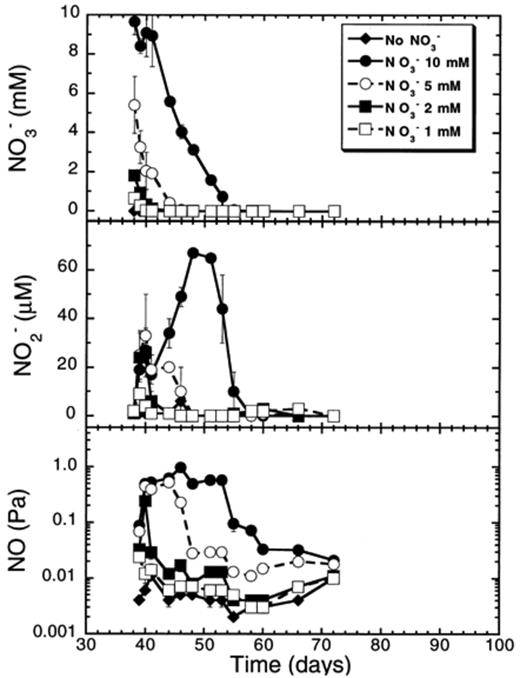
3.5 Effect of different concentrations of nitrate on methane production
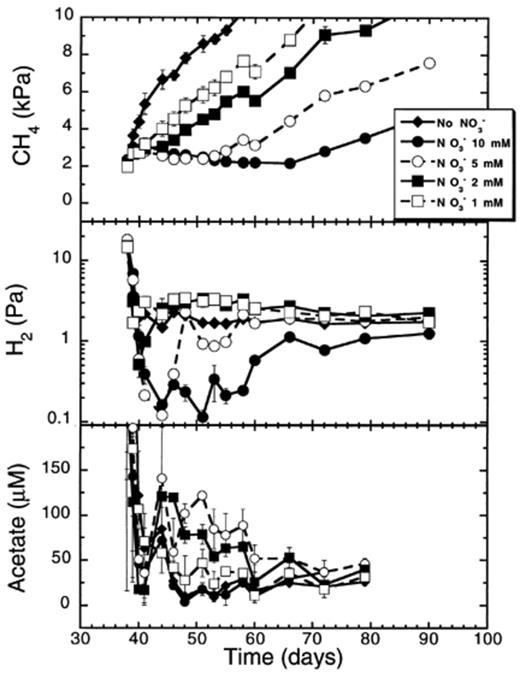
We also measured the effect of different nitrate concentrations on the suppression of CH4 production in anaerobic rice soil slurries (Fig. 9). Increasing the nitrate concentration led to a longer period of suppression and a decrease in the methane production rate after the complete reduction of nitrate, but not to higher rates of nitrate reduction above 2 mM nitrate (Fig. 9,Table 2). The length of the suppression period was significantly (P<0.05) and positively correlated (r= 0.999) to the NO−3 concentration applied. A linear regression of the period (in days) of suppression of CH4 production on the nitrate concentration applied indicated that for each millimole of nitrate added to the soil, CH4 production was suppressed for 2.8 days on average. Although the rates of CH4 production following the suppression phase were significantly (P<0.05) lower with increased nitrate concentrations, they were not significantly correlated (P>0.05) with increased nitrate concentrations (r=−0.86) (Table 2). However, a second order regression of these methane production rates on the nitrate concentration (y= 7.00–1.18x+0.08x2) was significant (r=−0.969, P<0.05).
Effect of various nitrate concentrations on CH4 and H2 partial pressures, and on acetate concentrations in rice soil slurries. Data points are average of duplicate flasks and error bars represent ±1 S.D.
Suppression of methanogenesis with increasing nitrate concentrations
| NO−3 concentration (mM) | Inhibition (days) | CH4 production (μmol day−1) | Inhibition (%) | Nitrate consumption (μmol day−1) |
| 0 | 0 | 7.4a (0.5) | 0.0 | 0.0a (0.0) |
| 1 | 2 | 5.8b (0.4) | 21.4 | 12.7b (2.1) [days 38–40] |
| 2 | 6 | 4.3c (0.3) | 41.8 | 22.7c (2.7) [days 38–40] |
| 5 | 14 | 3.5d (0.2) | 47.9 | 29.6c (7.5) [days 38–44] |
| 10 | 28 | 2.8e (0.3) | 62.3 | 25.2c (1.8) [days 38–55] |
The standard errors of the regression coefficients are shown in round brackets.
Rates calculated on the production occurring after methanogenesis had resumed.
Different letters in a column indicate significant differences (P<0.05) based on a Duncan test following a two-way ANOVA corrected by the method of Greenhouse–Geisser for repeated measures.
Immediately following the addition of nitrate to the methanogenic soil slurries, the H2 partial pressure dropped (Fig. 9). The H2 partial pressure decreased as low as 0.1 Pa when 5 or 10 mM nitrate was added. However, the H2 partial pressure remained low (below 1 Pa) for a much longer period when 10 mM was applied (28 days) than when 5 mM was applied (10 days). With the lowest nitrate concentrations (1 and 2 mM), the H2 partial pressure decreased only briefly below or at 1 Pa to return within few days back to about 2–3 Pa. Acetate concentrations varied between 10 and 100 μM without any pattern related to added nitrate concentrations.
Nitrate, nitrite, and NO concentrations were measured in the soil slurries (Fig. 10). The initial rates of nitrate reduction significantly increased with increased initial nitrate concentrations up to 2 mM (Table 2). At concentrations higher than 2 mM, the rates of nitrate reduction were not significantly different to each other. The relationship between the nitrate reduction rates and the nitrate concentrations is non-linear (y= 2.60+9.70x−0.75x2) with a significant (P<0.01) r= 0.973. Accumulation of nitrite and NO was higher in the soil to which higher nitrate concentrations were added. The period during which nitrite and NO accumulated was longer when higher nitrate concentrations were applied (Fig. 10).
Nitrate and denitrification intermediates (NO−2, NO) in rice soil slurries supplemented with various concentrations of nitrate. Data points are average of duplicate flasks and error bars represent ±1 S.D.
4 Discussion
4.1 Effect of nitrate on methanogenic precursors
As already mentioned, several hypotheses have been proposed to explain the mechanism of the suppression of CH4 production following the addition of nitrate. According to the competition hypothesis, the denitrifying bacteria would decrease the compensation point of H2 and acetate concentrations below the threshold value required by methanogens to be active [9,11,12]. Under steady-state conditions, we found that the H2 partial pressure significantly dropped from approximately 3 Pa to below 1 Pa no matter which concentration of nitrate was applied. A similar drop in the H2 partial pressure was also observed when acetate or propionate were added together with nitrate. In contrast, the addition of nitrate did not significantly decrease the acetate concentration. Acetate even increased during the suppression phase when propionate was added together with nitrate. Such an increase may be explained by increased production of acetate following degradation of propionate. These results, as well as those already reported elsewhere for another rice paddy soil [7], suggest that competition may be a mechanism involved in the suppression of the hydrogenotrophic methanogenesis, but is very unlikely involved in the suppression of the aceticlastic methanogenesis.
4.2 Effect of methanogenic precursors
Another approach to test whether the competition hypothesis is valid to explain the suppression of either methanogenic pathway in rice soil slurries is by measuring the effect of immediate (H2, acetate) methanogenic precursors on the suppression effect of nitrate. If competition for substrate is the main mechanism implicated, one should expect a partial relief in the suppression of CH4 production following the addition of either acetate or H2, and perhaps also of propionate, a precursor of H2 and acetate [28]. However, such experiments (Figs. 3 and 5 and 7) demonstrated that the addition of acetate, H2, or propionate, although stimulating methanogenesis in each case when added alone, did not relieve the suppression caused by the addition of nitrate. Although one might argue that a slight increase in the CH4 production was measured during the inhibition when H2 or propionate was added, this increase was very small and, furthermore, not statistically significant (Table 1). This is strong evidence that competition was not the main mechanism implicated in the suppression of the aceticlastic methanogenesis by nitrate. The same conclusion can be drawn for the hydrogenotrophic pathway, although the decrease of the H2 partial pressure in presence of nitrate (as already discussed in the previous section) seems to contradict this conclusion. However, methanogenesis might be inhibited by toxic denitrification intermediates anyway, while H2 is consumed by the denitrifying bacteria having a lower H2 threshold than the methanogens [29]. Added H2 was consumed faster in the presence than in the absence of nitrate, and nitrate was consumed faster in the presence than in the absence of exogenous H2 (Table 1), both surplus rates being stoichiometrically related (see below). In addition, the decrease of H2 partial pressure may be due to a decrease in the production of H2 by the same mechanism as methanogenesis is inhibited. It is possible that fermentative bacteria such as Clostridium spp. involved in the production of H2 may have been sensitive to the nitrogen oxides that were transiently released during the denitrification of nitrate. The production of H2 from a nitrogenase system of the diazotroph Clostridium pasteurianum was inhibited by both NO and nitrite, but not by CO [30]. Apparently NO inhibited the Fe–protein by disrupting the Fe4S4 cluster. Since hydrogenases implicated in H2 production from protons are also Fe–S proteins [31], it is likely that NO acted in a similar way on hydrogenases involved in the H2 production in soil.
4.3 Accumulation of denitrification intermediates and effect of the electron donors
Denitrification intermediates (NO2−, NO and N2O) all accumulated to different extents and for various durations in the methanogenic rice soil slurries following the addition of nitrate. It is known that methanogenic archaea are sensitive to nitrogen oxides either in axenic cultures or in sediment or rice soil [7,19,20]. Nitric oxide is especially toxic to bacterial cells by attacking Fe groups in enzymes [32]. A number of enzymes involved in the aceticlastic or the hydrogenotrophic pathway of methanogenic archaea contain Fe–S clusters or Fe hemes, such as the corrinoid of the CO dehydrogenase complex, the hydrogenases, and the cytochromes b1 and b2[5]. These enzymes may be susceptible to inhibition by NO or nitrite which may form metal–nitrosyl complexes [33]. Enzymes that are crucial for methanogens may also be inhibited by N2O [34] which is known to inactivate cobalamin-dependent enzymes. Based on these considerations, it is not surprising that methanogenesis resumed only after the complete reduction of all denitrification intermediates.
In our experiments, electron donors were in excess of the amount required for the complete reduction of the nitrate supplement since not all the added electron donors were consumed for the complete reduction of nitrate. The overall effect of added electron donors was to decrease the period during which denitrification intermediates accumulated. Since acetate is the most widely used carbon and energy source by denitrifiers [35], it was not unexpected that the addition of acetate was the most effective stimulant of denitrification followed by propionate and H2. If we consider the molar ratios of electron donors required to reduce 1 mol of nitrate, taking into account only the portion of the nitrate reduction rate above the one measured in the control soil, we found that 0.75 mol of acetate was required, compared to 2.46 mol of H2 and 0.71 mol of propionate. Assuming eight, two and six electrons for each molecule of acetate (oxidized to 2 CO2), H2 (oxidized to H2O) and propionate (oxidized to acetate+CO2), respectively, we found that 6.0, 4.9, and 4.3 electrons were required for the reduction of one molecule of nitrate by acetate, H2, and propionate, respectively. These values agree fairly well with the theoretical ratio of five electrons required to reduce one molecule of nitrate to 0.5 molecule of N2[36]. The rates of denitrification corresponded very well to the duration of the suppression of CH4 production. The faster the denitrification rate, the shorter the suppression phase of denitrification.
Contrary to the addition of methanogenic precursors, increasing the concentration of nitrate linearly increased the duration of the suppression phase. Higher nitrate concentrations lead also to significantly lower methane production rates after methanogenesis had resumed (Fig. 9). Such an observation is in agreement with the inhibition hypothesis. Nitrate reduction rates increased significantly up to 2 mM, but thereafter no significant increases in the reduction rates were observed. If we assume that heterotrophic bacterial populations (fermentative bacteria) acted as suppliers of these electron donors, it may be concluded that the denitrifiers depended on the same source of the electron donors H2, acetate, and propionate as the microbial community producing CH4 in the absence of nitrate. Such a dependence of the populations of denitrifying bacteria on anaerobic heterotrophic bacteria has already been proposed in an empirical study of freshwater sediment showing that the best predictive variable to explain the distribution of denitrification rates was the heterotrophic activity measured as CO2 production [37]. Thus, to explain the mechanism of the suppression of CH4 production in anoxic soil or sediment with respect to denitrifiers, it may be critical to consider the ratio between the electron acceptor pool and the electron donor pool.
In conclusion, the results presented here suggest that competition for substrate between denitrifiers and methanogens is not the main mechanism of suppression of methanogenesis. Instead, the inhibition by toxic denitrification intermediates better explains our experimental results. The ratio between electron acceptor and electron donor appears to be critical for the intensity of the inhibition of methanogenesis in anoxic rice soil and may be for methanogenic environments in general.
Acknowledgements
This study was part of the Sonderforschungsbereich 395 ‘Interaction, adaptation and catalytic capacity of terrestrial microorganisms’. We thank Roger Knowles and Ulrike Bosse for critically reading the manuscript.
References
Author notes
Present address: Biotechnology Research Institute, 6100 Royalmount Avenue, Montréal, Québec, Canada.
