


Abstract
Community assembly is influenced by environmental niche processes as well as stochastic processes that can be spatially dependent (e.g. dispersal limitation) or independent (e.g. priority effects). Here, we sampled senesced tree leaves as unit habitats to investigate fungal community assembly at two spatial scales: (i) small neighborhoods of overlapping leaves from differing tree species and (ii) forest stands of differing ecosystem types. Among forest stands, ecosystem type explained the most variation in community composition. Among adjacent leaves within stands, variability in fungal composition was surprisingly high. Leaf type was more important in stands with high soil fertility and dominated by differing tree mycorrhizal types (sugar maple vs. basswood or red oak), whereas distance decay was more important in oak-dominated forest stands with low soil fertility. Abundance of functional groups was explained by environmental factors, but predictors of taxonomic composition within differing functional groups were highly variable. These results suggest that fungal community assembly processes are clearest for functional group abundances and large spatial scales. Understanding fungal community assembly at smaller spatial scales will benefit from further study focusing on differences in drivers for different ecosystems and functional groups, as well as the importance of spatially independent factors such as priority effects.
Introduction
Processes that drive community assembly range from selection of species by local environmental conditions to stochastic variation in species colonization (Hanson et al. 2012). Although these broad groups of hypothesized mechanisms are often presented as alternatives, most communities will not be influenced by only environmental or stochastic factors, leaving community ecologists with the challenge of understanding where a community falls in this spectrum (Chase and Myers 2011, Zhou and Ning 2017). Despite their many key roles in ecosystem processes, understanding mechanisms of fungal community assembly has proven particularly challenging due to high levels of stochasticity (Powell et al. 2015, Bahram et al. 2016, Peguero et al. 2022).
Previous observations of fungal communities have indeed supported both environmental selection and stochastic processes (Peay et al. 2016), indicating that they may operate simultaneously or that their relative strengths may depend on other factors such as dispersal frequency and ecosystem characteristics. Saprotrophic fungal communities vary between forest stands dominated by differing tree species (Urbanova et al. 2015), in part due to contrasting senesced leaf litter chemistry (Schneider et al. 2012). This may also occur at the level of individual leaves, with fungal community composition depending upon leaf types (Aneja et al. 2006, Kurbatova et al. 2009, Zhang et al. 2020). However, stochastic mechanisms, that are independent of environmental factors, may also play an important role in fungal community assembly. Priority effects occur when initial colonists affect the performance of subsequent colonizers (Debray et al. 2022), and has been demonstrated in fungal community assembly in several environments (Kennedy et al. 2009, Fukami et al. 2010). If dispersal ranges are not limited (i.e. proximity to source populations does not affect the probability of dispersal), strong priority effects could result in simultaneous independence from environmental conditions and lack of spatial patterns. However, if dispersal ranges are limited, patchy spatial patterns can emerge that are independent of environmental conditions. For example, Feinstein and Blackwood (2013) examined fungal communities of individual leaves found together in 20 cm × 20 cm patches on the forest floor and discovered a distance–decay pattern independent of leaf type. Spatial patterns consistent with this scenario have also been found, at various spatial scales, in bulk soil fungal communities (Green et al. 2004, Zhao et al. 2019, Peguero et al. 2022) and in ectomycorrhizal and leaf endophytic communities (Peay et al. 2010, Bowman and Arnold 2021, Cook et al. 2022). Although it is clear that fungal communities are affected simultaneously by environmental niche relationships and stochastic processes, the drivers of this mixed community assembly process require further investigation.
One explanation for patterns in fungal community composition being consistent with multiple community assembly processes is that fungal communities are comprised of multiple functional groups. These groups are responsible for different biological interactions and ecosystem functions [i.e. necrotrophic and biotrophic plant pathogens, mycoparasites, mycorrhizae, endophytes, yeasts, wood degraders, and primary saprotrophs (nonwood plant tissue degraders)] (van der Heijden et al. 2008, Zanne et al. 2020). The different functional groups have distinct environmental requirements for growth and survival, which should result in strong environmental niche selection at the levels of whole functional groups (i.e. comparisons among functional groups) (Bahram et al. 2016, Schröter et al. 2019, Masumoto et al. 2023). For instance, fungi that can break down recalcitrant compounds (e.g. wood degraders) are expected to be more prevalent on plant material with a higher lignin content (Rajala et al. 2012). Yeasts are thought to be tolerant of desiccation and nutrient depletion and should, therefore, have higher relative abundance in environments characterized by these conditions (Treseder and Lennon 2015). In contrast, stochastic factors may be particularly strong within functional groups because species in the same functional group should have similar niche requirements. This functional equivalency may allow species within a functional group to vary independently from the environment, depending on their modes of dispersal, even while the overall abundance of the group is constrained (Schröter et al. 2019, Masumoto et al. 2023). We reasoned that groups that disperse and spread slowly (i.e. wood rot fungi and yeasts) or that have patchier distributions (mycorrhizal fungi) should be more influenced by dispersal limitation (Belisle et al. 2012, Horn et al. 2014, Peay and Bruns 2014). Necrotrophic plant pathogens and primary saprotrophs are prolific spore producers and have low environmental specificity (Brown and Hovmoller 2002, van Kan 2006, Halbwachs et al. 2015), and thus may largely be influenced by priority effects without a strong spatial pattern. On the other hand, endophytes and biotrophs should be structured by biological environmental factors, such as leaf type or host, due to their high degree of environmental specificity (Spanu and Kamper 2010, Wearn et al. 2012).
The importance of environmental selection, dispersal limitation, or priority effects in community assembly may also be influenced by spatial scale (Green and Bohannan 2006, Martiny et al. 2011, Horn et al. 2015). Some mechanisms may not be recognized if they are occurring at a larger or smaller scale than the one under investigation, although they still may play a significant role in assembly processes. Scale dependence in community assembly has been demonstrated several times in soil fungal communities (Green et al. 2004, Pellissier et al. 2014). At regional and continental scales, soil fungal community similarity is usually associated with environmental differences (Zhao et al. 2019, Zheng et al. 2021). For soil fungal communities within individual sites, distance decay analysis often shows spatial autocorrelation up to a few meters in bulk soil, whereas at larger distances community similarity appears primarily stochastic or weakly correlated with environmental variables (Bahram et al. 2016, Zhao et al. 2019, Peguero et al. 2022). Likewise, Feinstein and Blackwood (2013) found that, at the scale of individual leaves, fungal community similarity decreased as distance between leaves increased, but at the scale of ecosystems, environmental factors were more important.
This study was performed to better understand how deterministic and stochastic factors influence saprotrophic fungal communities at both individual leaf and forest stand spatial scales. We focused on individual senesced leaves as natural sampling units due to their discrete nature as distinct resource patches with independent histories. We tested the following hypotheses: H1—At small scales (between adjacent leaves), overall fungal community composition is influenced by both environmental selection (through leaf type) and dispersal limitation/priority effects. H2—In contrast, at larger spatial scales (between forest stands), community composition is more influenced by environmental selection (through ecosystem type). H3—Relative abundances of fungal functional groups will be strongly structured by environmental factors, including ecosystem and leaf type, but not by spatial effects. H4—In contrast, the importance of factors influencing taxonomic composition within each functional group may include dispersal limitation, depending on the dominant dispersal mechanisms in each functional group. To test these hypotheses, leaves were gathered from well-characterized ecosystems in the northern lower peninsula of Michigan. Individual leaves with differing chemical properties were collected after mapping their locations on the forest floor. Fungal communities were characterized using two strategies: terminal restriction fragment length polymorphism (T-RFLP) analysis was used to achieve high-replication of individual leaf communities, and pyrosequencing was used to obtain high-resolution taxonomic profiles and functional characterization of a more limited number of communities.
Materials and methods
Sites and sample collection
Leaves were sampled from Manistee National Forest, in northern Lower Michigan, where ecosystems have been previously delineated based on overstory tree species, understory plants, and soil properties (Zak et al. 1986, Host et al. 1988). Leaves were taken from nine previously studied forest stands, representing three replicate stands from each of the three ecosystems (Figure S1, Supporting Information). Sampling sites in each forest stand were selected where there appeared to be approximately equal coverage of leaves of the dominant tree species in each ecosystem type. Dominant tree species include sugar maple (Acer saccharum) and basswood (Tilia americana) in the sugar maple–basswood (SMBW) ecosystem; sugar maple and red oak (Quercus rubra) in the sugar maple–red oak (SMRO) ecosystem; and black oak (Quercus velutina) and white oak (Quercus alba) in the black oak–white oak (BOWO) ecosystem. Leaves of other species were also collected if they were present in the targeted area.
In late April and late August of 2010, 30 decayed leaves (which had senesced and fallen in October/November 2009) were collected from a ∼20 cm × 20 cm area on the forest floor of each forest stand. Leaves were collected that had adjacent and overlapping areas to facilitate reconstruction of spatial proximity. A digital camera mounted on a tripod was used to photograph the forest floor before and after each leaf was removed. Each leaf was collected using ethanol-sterilized equipment and placed individually into a bag. Samples were transported to the lab on ice and then freeze dried and stored at −80°C. Leaves were than ground in a Genogrinder (SPEX Certiprep 2000) for 2 min at 1000 beats per minute.
Image analysis and construction of geographic distance matrices
The “geographic distance” between leaves in the forest floor was quantified by constructing a network of physical leaf adjacencies from their positions on the forest floor, following Feinstein and Blackwood (2013). Pictures of the forest floor before and after sampling each leaf were turned into image stacks using the software ImageJ. Leaf images and their locations were used to estimate the % area overlap between each pair of leaves (0%, 20%, 40%, 60%, 80%, or 100%). Network distance matrices were then obtained by finding the shortest path between each pair of leaves in the adjacent leaf network topology using the package RBGL (Carey et al. 2016) and the software Graphviz (Ellson et al. 2000) in the R statistical analysis program (R core team 2014). The distances were measured either in unweighted steps (e.g. leaves that are touching are one step apart, leaves separated by another leaf are two steps apart, and so on) or in steps weighted by the overlap estimate between each pair of leaves. There were negligible differences in results obtained using these two distance metrics, so all results shown are from the analysis of unweighted step matrices. Depth of each leaf, in terms of numbers of overlying leaves, was also noted and recorded as another explanatory variable.
DNA extraction
A CTAB method was used to extract DNA from freeze dried leaf tissue (Wu et al. 2011). In brief, ground material was suspended in a CTAB/β-mercaptoethanol buffer and incubated at 60°C for 20 min. The material was centrifuged, and the supernatant was mixed with concentrated chloroform and centrifuged again. The aqueous layer was collected and mixed with ice-cold isopropanol and allowed to sit at −20°C overnight (∼16 h). The DNA was pelleted by centrifugation and washed with cold 70% ethanol. The resulting pellet was air dried and then resuspended in 50 µl of sterile water.
T-RFLP community analysis
T-RFLP was used to determine fungal community composition of each leaf as in Feinstein and Blackwood (2013). The fungal internal transcribed spacer region (ITS) was amplified with the primer set NSI1F (5′-GATTGAATGGCTTAGTGAGG) and NLB4R (5′-GGATTCTCACCCTCTATGAC) (Martin and Rygiewicz 2005). The NSI1F primer was labeled with HEX fluorescent dye. PCRs were performed using a DNA engine Dyad Peltier thermal cycler (Bio-Rad, Hercules, CA, USA) with the following protocol: 95°C for 3 min followed by 35 cycles of 94°C at 30 s, 60°C for 30 s, and 72°C for 1 min 30 s. For each PCR, the following reaction mix was utilized: ammonium buffer (1x) (B-Bridge, Santa Clara, CA, USA), bovine serum albumin (0.5 mg/ml), MgCl2 (3.0 mM), dNTPs (0.2 mM each), Taq polymerase (0.03 U/ul) (B-bridge), and primers (0.16 uM each). Negative controls were used for each set of reactions. PCR products were purified using the UltraClean PCR Cleanup Kit (Mo Bio Laboratories, Carlsbad, CA, USA). Samples were then digested using 10 units of the restriction enzyme HaeIII (New England Biolabs, Ipswich, MA, USA) for 16 h at 37°C. Digested samples were further cleaned using E.Z.N.A. DNA Probe Purification kit (Omega Bio-tek, Norcross, GA, USA). The samples were then sent to the Ohio State Plant Microbe Genomics Facility for capillary electrophoresis on a 3730 DNA Analyzer using a LIZ1200 size standard. For each sample, only peaks between 50 and 600 bp in size and greater than 0.5% of relative peak abundance were included in the analysis (Blackwood 2006).
Pyrosequencing community analysis
Pyrosequencing was also performed on a subset of seven leaves collected in April from each of the three SMBW and three BOWO stands (42 leaves in total). A 350-bp segment of the fungal ITS1 region was amplified using the tag encoded primers ITS1F (5′-CTT GGT CAT TTA GAG GAA GTA A) and ITS2 (5′ GCT GCG TTC TTC ATC ATC GAT GC) (Buee et al. 2009). PCR amplifications were performed using the same protocol that was used for T-RFLP community analysis, with negative controls used for each sample-primer combination. Amplified PCR products were purified using a 1% agarose gel, and excised bands were cleaned with an UltraClean GelSpin DNA Extraction kit (Mo Bio laboratories). DNA samples were then further purified using Agencourt Ampure XP purification beads (Agencourt Bioscience Corporation, MA, USA). DNA concentrations were quantified using the PicoGreen dsDNA Assay Kit (Life Technologies, Eugene, OR, USA). All samples were then pooled together in an equimolar concentration. This pooled sample was then amplified with emulsion PCR and sequenced in a FLX GS Junior 454 Pyrosequencer (454 Life Sciences) following the manufacturer’s instructions.
Sequencing data was analyzed with the program Quantitative Insights into Microbial Ecology (QIIME 1.9.1) (Caporaso et al. 2010). Sequences were removed if they did not have an identifying barcode and/or correct primer sequence, were below 100 bp in size, or below a quality score of 25. Sequences were then denoised and clustered into 97% identity OTUs with the UCLUST algorithm in QIIME. Finally, singleton OTUs and three leaves with < 400 sequences were removed from our data set. Pyrosequencing data was rarified to the minimum number of sequences per sample within each stand before statistical analysis (i.e. 400–4817 depending on stand). Rarefactions and statistical analyses were repeated 10 times to examine the possible effects of rarefaction to a low number of sequences on possible spurious results, but no qualitative differences among the iterations were observed, so we report on the last iteration generated below.
We searched for database matches to a representative, longest sequence from each OTU using Basic Local Alignment Search Tool (BLAST; Altschul et al. 1990) in both Genbank and UNITE databases (Kõjalg et al. 2005). The “last common ancestor” algorithm was then used to parse BLAST scores and taxonomy of the top 50 similar sequences using the software MEtaGenome Analyzer 5.0 (MEGAN; Huson et al. 2011). Taxonomic identifications from the curated UNITE database were preferred unless the identification from Genbank (which is more comprehensive) agreed with UNITE 7.0 and provided a finer level of taxonomic resolution. Sequences obtained from this study were submitted to the sequence read archive under accession number PRJNA1016450.
Functional identification
Taxa detected in sequence data were categorized into functional groups if they were over 1% of the relative abundance for at least one sample (Table S1, Supporting Information). Assignment to a functional group was made where possible after an in-depth literature review. Our goal was to perform an analysis at the level of broad functional groups, not to provide a definitive functional designation for any particular OTU. However, many families, genera, or species could be confidently designated to a specific functional group. A few higher taxonomic clades (orders or classes) were designated to a functional group only if clear that most representatives described would correspond to one particular functional group. For example, the Tremellomycetes was designated as mycoparasites/yeasts because all representatives are well documented to have this capability (Kirk et al. 2008, Milanes et al. 2011; and references for various subclades shown in Table S1, Supporting Information).
Statistical analyses
Statistical analyses were performed in the R program 3.1.3 (R core team 2014) with packages vegan 2.2.1 (Oksanen et al. 2015), PCNM 2.1.4 (Legendre et al. 2010), AEM 0.6 (Blanchet et al. 2015), Packfor 0.0.8 (Dray et al. 2016), and Graph 1.30.0 (Gentleman et al. 2016). In addition to analysis of T-RFLP and OTU composition to tests H1 and H2, analyses were repeated on functional group profiles inferred from sequence data. These analyses were performed between functional groups (i.e. after summing OTUs comprising each functional group) to test H3, and within functional groups (i.e. considering composition of OTUs from within a single functional group) to test H4. The cut off for significance was a P-value of .05.
Analysis of variation among adjacent leaves within forest stands
To test the effects of environmental and spatial factors on community composition, we used Mantel tests and redundancy analysis (RDA), with significance assessed using permutation tests appropriate for multivariate data (Legendre and Legendre 2012). Mantel analysis tests for a significant correlation between a pairwise community composition dissimilarity matrix (Jaccard distance) and a pairwise spatial distance or environmental dissimilarity matrix. Jaccard distance is based on presence–absence only, and thus equal weight on low and high abundance taxa (Legendre and Gallagher 2001). The spatial distance matrix included the number of steps between each pair of leaves, as described above. Clusters of leaves collected within the same sampling frame that did not spatially connect were combined following Feinstein and Blackwood (2013). Environmental dissimilarity matrices were also constructed for leaf type and depth to assess their correlation with community composition dissimilarity.
RDA is a multivariate ordination-multiple regression framework that can be performed directly on Hellinger-transformed abundances, which places more weight on high abundance taxa than Jaccard distance (Legendre and Gallagher 2001). Significance of leaf type, depth, and spatial location within each leaf network were tested as predictors, followed by variance partitioning for significant predictors using adjusted R2 (Peres-Neto et al. 2006). To model spatial effects, spatial distance matrices were converted to principal coordinates of neighbor matrix (PCNM) vectors, which are explanatory variables that contain the entire of range of potential spatial structures in a coordinate dataset (Borcard et al. 2004). Forward selection was utilized to select the minimal number of PCNM vectors to reduce the chance of overestimating variance explained and lower the risk of type 1 error (Blanchet et al. 2008).
Analysis of variation between forest stands
Larger scale effects of environmental and spatial factors were investigated by RDA on leaf fungal communities from all stands combined into a single data set. Environmental explanatory variables included ecosystem type, leaf type (nested within ecosystem type), and depth. The spatial factor investigated at this scale was forest stand (nested as a factor within ecosystem type). This analysis was performed only with dominant trees species leaves from each ecosystem (n = 422 for T-RFLP and n = 42 for pyrosequencing). We also used the betadisper function to test whether variation (or dispersion) in fungal community composition differed between ecosystem types.
Results
High replication analysis of community composition using T-RFLP profiles
We detected a total of 122 TRFs. Across all leaf pairs, the average Jaccard distance was 0.64 (with values ranging from 0.14 and 0.97). Surprisingly, for physically touching pairs of leaves, the average Jaccard distance was 0.62 (ranging from 0.20 to 0.94), close to the study-wide average and indicating that overlapping leaves that are touching each other shared an average of only 38% of their fungal taxa.
Analysis of adjacent sets of leaves within stands revealed that distance–decay relationships and effects of leaf type were both important at the scale of individual leaves, but largely in different ecosystems, partially supporting H1. In April, Mantel tests revealed a significant distance–decay relationship in all BOWO stands and one SMRO stand (Fig. 1 and Table 1). In contrast, leaf type played a significant role in structuring all April SMBW stands (as well as one SMRO and one BOWO stand). Hence, in April, distance decay was more important than leaf type in BOWO stands, and the opposite was true for SMBW stands. In August there were significant distance–decay relationships more evenly spread out across ecosystems (Table 1). Leaf type was again significant in all SMBW stands in August (Table 1), whereas leaf type was significant but with lower correlations at two BOWO stands. Partial mantel tests indicated that proximity and leaf type were not confounded with each other, and that the significance of the correlations were unchanged compared to Table 1. Trends in results of RDA tests for each stand separately were similar to those described above, although the differences between ecosystem types were not as strong (Table S2, Supporting Information).
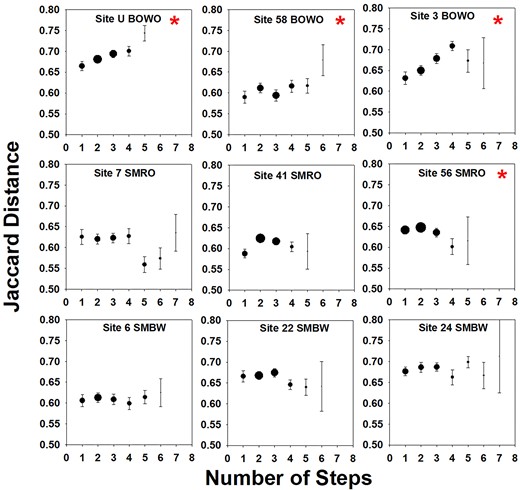
April fungal community composition dissimilarity as a function of spatial distance within adjacent leaf patches. Averages (± SE) of pairwise Jaccard distances are based on T-RFLP profiles. Point size is proportional to the number of sample pairs (ranging from 2 to 50 pairs per step). * indicates significant relationship according to Mantel analysis (P < .05).
Average Mantel correlation values comparing T-RFLP community composition and possible controlling factors within each stand, followed by number of stands with significant positive Mantel values. n = 3 stands per ecosystem, and n = 7–30 leaves per stand.
| April | August | |||||
|---|---|---|---|---|---|---|
| Ecosystem | Prox. | Leaf type | Depth | Prox. | Leaf type | Depth |
| BOWO | 0.22 (3) | 0.02 (1) | 0.04 (1) | 0.08 (1) | 0.06 (2) | −0.08 (0) |
| SMBW | −0.04 (0) | 0.18 (3) | 0.1 (1) | 0.06 (1) | 0.26 (3) | 0.02 (0) |
| SMRO | 0.08 (1) | 0.09 (1) | 0.05 (0) | 0.18 (2) | 0.13 (1) | 0.23 (2) |
In the analysis comparing all forest stands, the full RDA model accounted for 27% and 36% of the variation in Hellinger-transformed T-RFLP profiles in April and August, respectively (Fig. 2 and Table 2). In support of H2, ecosystem was the most important factor, although other factors were also significant (stand, leaf type, and depth). Differences among stands of the same ecosystem type accounted for nearly as much variation as ecosystem type, suggesting that both environmental selection and stochastic or stand-specific factors are important at this landscape scale (Fig. 2 and Table 2). Leaf type and depth were significant but explained negligible amounts of variation when compared to stand or ecosystem (Table 2).
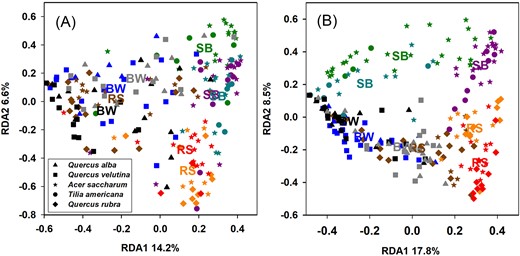
RDA ordination plots for Hellinger-transformed T-RFLPs profiles in (A) April and (B) August. Colors represent each forest stand, with stand centroids also shown using labels for each ecosystem type: BW=BOWO, SB = SMBW, and RS = SMRO .Shapes indicate different leaf species.
Amount of variation explained (marginal and total adjusted R2 values) in composition of the full fungal community (T-RFLP and pyrosequencing OTUs), functional group abundances, and OTU composition within each functional group.
| Fungal group dataset | Ecosystem | Stand | Leaf type | Depth | Total1 |
|---|---|---|---|---|---|
| T-RFLP (April) | 0.14 | 0.10 | 0.01 | 0.01 | 0.27 |
| T-RFLP (August) | 0.17 | 0.17 | 0.02 | 0.01 | 0.36 |
| Pyrosequencing OTUs (April) | 0.20 | 0.08 | 0.05 | 0.02 | 0.38 |
| Functional group abundances | 0.27 | 0.12 | 0.05 | NS | 0.44 |
| Mycoparasite/yeast OTUs | 0.19 | NS | 0.04 | NS | 0.22 |
| Necrotroph plant pathogen OTUs | 0.06 | 0.07 | 0.05 | NS | 0.20 |
| Primary saprotroph OTUs | 0.08 | 0.11 | 0.06 | NS | 0.26 |
| Ectomycorrhizal OTUs | 0.10 | 0.13 | NS | NS | 0.26 |
| Lichen OTUs | 0.10 | 0.15 | NS | NS | 0.23 |
| Endophyte OTUs | 0.21 | NS | NS | NS | 0.23 |
| White Rot OTUs | NS | NS | NS | 0.14 | 0.14 |
The difference between the total adjusted R2 and the sum of the marginal adjusted R2 values is from “overlap” variance that is explained jointly by combinations of the other explanatory factors, and cannot be attributed to a single to a single source.
Sequence analysis of fungal community composition
Sequences were clustered into 485 OTUs. Across all leaves and ecosystems, Ascomycota dominated the sequences, averaging from 80% of sequences on black oak leaves to 98% on sugar maple leaves. Basidiomycota averaged 20% of sequences on black oak leaves, but varied greatly between individual leaves with one leaf having a basidiomycete abundance of 68%. OTUs identified as Glomeromycota, Mortierellales, and fungi of uncertain placement were present, but at abundances of less than 1%. The Ascomycete class Leotiomycetes (primarily order Helotiales) was the most prevalent group found on all leaves followed by Sordariomycetes (primarily orders Hypocreales and Xylariales), and Dothidiomycetes (primarily order Capnodiales) (Fig. 3). The order Helotiales was by far the most dominant group of fungi. In BOWO ecosystems, > 10% of sequences came from the Basidiomycete class Tremellomycetes, which was negligible in SMBW leaf samples (Fig. 3). Other groups that were more prevalent in BOWO leaves included the classes Lecanoromycetes and Agaricomycetes and the order Myriangiales. There were a greater number of Ascomycete sequences that could not be identified to class in SMBW leaves. In addition, compared to BOWO leaves, sugar maple leaves had a greater proportion of Capnodiales and Xylariales, and basswood leaves were more dominated by Helotiales.
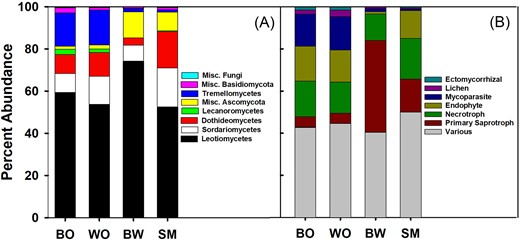
Average % abundances of fungal (A) classes and (B) functional groups found on each leaf type. The “Various” functional group includes functional groups < 1% abundance plus taxa corresponding with multiple functions. BO = black oak, WO = white oak, BW = basswood, and SM = sugar maple.
Like T-RFLPs, there was a low amount of community similarity even between overlapping leaves. Across all leaves there was an average Jaccard distance of 0.68, ranging from 0.44 to 0.97. For physically touching leaves there was an average Jaccard distance of 0.62, ranging from 0.44 to 0.83. This once again demonstrates a high degree of dissimilarity of leaf litter fungal communities, indicating that adjacent leaves on average shared less than half of their fungal taxa. However, in contrast to the within-stand analysis of T-RFLPs, explanatory factors (leaf type, depth, and proximity) did not explain significant variation in OTU composition within any site.
In the analysis comparing all forest stands, RDA indicated that 38% of the variation in Hellinger-transformed OTU abundances was explained using all significant explanatory factors (ecosystem, stand, leaf-type, and depth). In support of H2 again, ecosystem explained the most variation, followed by stand, leaf type, and depth (Table 2). The RDA ordination showed that communities varied much more among SMBW stands than BOWO stands (Fig. 4), which was confirmed by the betadisper test (P < .05). This was also apparent within stands, with all BOWO leaves clustered much more closely together than SMBW leaves (Fig. 4).
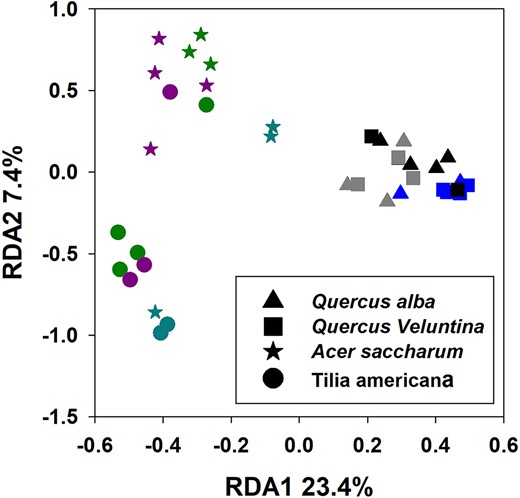
RDA ordination plot of pyrosequencing OTUs. Colors represent different forest stands, with stand centroids labeled with each ecosystem type: BW = BOWO and SB = SMBW. Shape indicate leaf species as indicated by the key found on the plot.
Functional group abundances (H3)
Approximately, 52% of sequences could be tentatively categorized into functional groups based on their taxonomic affiliations (Table S1, Supporting Information). Primary saprotrophs (nonwood degrading and nonpathogenic saprotrophs) were much more prevalent in basswood leaves when compared to other leaf types, whereas lichenized fungi, endophytes, mycoparasites, and ectomycorrhizal fungi had a much higher abundance in leaves from BOWO than from SMBW (Fig. 3). Sugar maple leaves tended to have more functionally undefined taxa when compared with other leaf types.
Comparing all forest stands, RDA indicated that 44% of the variation in Hellinger-transformed functional group abundances was explained by ecosystem, stand, and leaf type (Table 2). Total variance explained, as well as the components explained by each environmental factor (ecosystem and leaf type), was larger for functional group abundances than for T-RFLP or OTU profiles, supporting H3.
Controls on composition within each functional group (H4)
We found that distinct factors structured OTU composition within the different functional groups, broadly supporting H4, although the accuracy of specific predictions for particular functional groups was highly variable (Table 2). Ecosystem type had a stronger effect than stand for OTU composition within the mycoparasites/yeasts and endophytes, while stand had a stronger effect on OTU composition within the ectomycorrhizal fungi, primary saprotrophs, lichens, and white rot saprotrophs (Table 2). Depth explained some variation in OTU composition within white rot fungi but was not significant for other groups. Leaf type explained a significant amount of variation for mycoparasites, necrotrophic plant pathogens, and primary saprotrophs. Analysis of composition within functional groups within each forest stand showed no significant effects of leaf type, spatial proximity, or depth.
Discussion
The dominant assembly mechanisms influencing fungal communities are often difficult to discern from spatial patterns because both stochastic and environmental factors are known to play a role (Powell et al. 2015, Peguero et al. 2022). Despite sampling individual leaves as distinct habitat patches, we found that stochastic variation independent from distance decay (i.e. unexplained variation) was consistently strong, as noted by others for fungi in other habitats (Cook et al. 2022, Bahram et al. 2016). Surprisingly, even pairs of leaves that were physically touching did not share notably similar fungal communities, perhaps resulting from priority effects, leaf history, or other unmeasured environmental variability. However, we did find changes in the importance of distance decay and environmental factors according to ecosystem type, spatial scale, and how fungi are treated with respect to functional groups. Environmental factors were particularly important at large spatial scales and for functional group abundances, whereas distance decay had significant effects on taxonomic composition in particular ecosystems and for particular functional groups. Thus, our results point to the importance of considering functional redundancy, environmental heterogeneity, and priority effects in understanding variation in mechanisms of fungal community assembly.
Deterministic and stochastic mechanisms influence community assembly of fungal taxa
Fungal communities residing in decomposing leaves are often expected to respond strongly to the plant species identity of the leaves because of differences in available resources, secondary chemistry, and the immediate physical environment for growing mycelia (Osono 2007, Prescott and Grayston 2013). However, we were surprised to find that leaf type had a relatively small and inconsistent effect on the taxonomic composition of resident fungal communities. This may imply that many fungi in forest ecosystems are adapted to efficiently utilize any leaf litter that is available every year, as would be the case from multiple dominant tree species within a forest stand. Ecosystem type, on the other hand, had a strong effect on fungal community composition, even though the impacts of ecosystem type on leaf litter fungi could be expected to be more diffuse than the impacts of a particular leaf. The ecosystem types we studied differ on many environmental axes, including contrasting soil types, moisture availability, and plant community members (Host et al. 1988). These environmental factors structure fungal communities in other studies (Brockett et al. 2012, Prescott and Grayston 2013), and may physiologically limit fungal communities more than does leaf chemistry, constraining the pool of fungi available to colonize new senesced leaves.
The study of metacommunities has begun to focus on the conditions that cause shifts community assembly processes between stochastic and deterministic factors (Chase and Myers 2011, Zhou and Ning 2017). Here, we found that, at the scale of adjacent leaves, differences among ecosystem types could help explain the relative importance of dispersal limitation and niche effects on fungal community composition. Although the effect of leaf type was not as strong as expected overall, the effect was strongest in the SMBW stands, which has the highest soil fertility and most labile leaves. More abundant resources may lead to stronger environmental filtering through both increased production of propagules, which should reduce dispersal limitation, and rapid fungal growth and competition, increasing sensitivity to the leaf litter environment. In addition, sugar maple leaves are likely more biochemically distinct from basswood and red oak leaves than black and white oak leaves are from each other. Sugar maple leaves are known to be biochemically less recalcitrant than red oak leaves (Gallo et al. 2004), and sugar maple is an arbuscular mycorrhizal species, rather than mostly ectomycorrhizal like all the other focal trees (Tedersoo and Brundrett 2017). Arbuscular mycorrhizal tree leaves are typically less recalcitrant (Cornelissen et al. 2001) and lead to fungal communities that are distinct from those associated with ectomycorrhizal species (Bahram et al. 2020, Eagar et al. 2023). Leaf depth within the forest floor was also investigated, but accounted for a negligible amount of variation, possibly because the sites investigated were all upland forests. Although Feinstein and Blackwood (2013) found that depth in the forest floor was important in explaining fungal community at sites in Ohio, USA, this was especially consistent in forested wetlands, whereas depth was only significant in one of their two upland sites.
Distance–decay relationships were frequently found within BOWO or SMRO stands (7 out of 12 stands across April and August, Table 1), but not in SMBW stands (one out of six stands). Although we could not test this in the current study, the more recalcitrant nature of oak leaves should result in slower fungal growth rates due to a need for increased investment in extracellular enzyme production (Gallo et al. 2004, Moorhead and Sinsabaugh 2006, Osono 2007), favoring stronger competitors that are slower to disperse and have patchier species distributions (Kneitel and Chase 2004). Colonization between neighboring leaves may also be favored because resources are physically separated in this environment, and cytoplasmic transport through a hyphal network can integrate resource patchiness for many saprotrophic fungi (Bielčik et al. 2019)
Recent conceptual developments have highlighted the need to more directly incorporate effects of species interactions in metacommunity ecology to fully account for both possible patterns and known mechanisms in community assembly (Leibold et al. 2022). Here, despite finding significant effects of ecosystem type, leaf proximity, and leaf type on fungal community composition, a great deal of variation was still left unexplained, implying the presence of strong, spatially unstructured priority effects (Johnson 2015). Priority effects have been experimentally documented in wood saprotrophic communities, in which inoculation of specific early colonists can affect future fungal colonizers for prolonged periods of time (Weslien et al. 2011) through generation of secondary metabolites, release of nutrients, and niche preemption (Heilmann-Clausen and Boddy 2005, Fukami 2015). In leaf litter, priority effects may begin before leaf senescence even occurs, because endophytic and necrotrophic fungi can shift lifestyles and act as saprotrophs (Osono 2006, Song et al. 2017). Coupled with stochastic movement of individual leaves, these priority effects could lead to the low similarity we observed between fungal communities of leaves even in direct contact with one another. Given the apparent importance of priority effects, and the possibility that outcomes are impacted by conditions such as temperature and plant tissue biochemistry (Hiscox et al. 2016), we suggest that this is an important area for further research.
Differing community assembly processes among and within functional groups
Although species can differ from each other on many niche axes (Rosenfeld 2002), simplification of fungal taxa to functional groups has been hypothesized to improve predictions about fungal community assembly (Peay et al. 2016, Schröter et al. 2019). Our study supports this idea, because functional group abundances were better explained overall, and more strongly determined by leaf type and ecosystem than were taxonomic abundances. Moreover, the small-scale spatial factor we investigated (leaf proximity) had no influence on relative abundances of functional groups, despite their importance for taxonomic community composition. This indicates that environmental selection acts to assemble combinations of functional traits based on niches available in the environment, and that the species identity of the organisms filling each niche is less important.
Plant pathogens and fungal endophytes were present in large abundances despite leaf senescence 6–12 months before sampling, indicating that these functional groups likely persist in leaf litter as important facultative saprotrophs and reinforcing the idea that priority effects are a key mechanism affecting fungal community assembly. However, relic DNA can also persist in the environment and lead to a snapshot of communities in the past (Lennon et al. 2018). Plant pathogens were more prevalent on leaves from the arbuscular mycorrhizal tree sampled (sugar maple) than from the ectomycorrhizal trees (black oak, white oak, and basswood), consistent with observations in other systems (Bahram et al. 2020, Eagar et al. 2023). Unsurprisingly, ectomycorrhizal fungi were found to be most abundant in the ecosystem with the highest abundance of ectomycorrhizal trees, BOWO. Mycoparasites/yeasts and lichens were also notably higher on BOWO leaves, possibly due to water limitation in this ecosystem and their overall resistance to desiccation (Kranner et al. 2008, Treseder and Lennon 2015).
Within functional groups, community composition was associated with differing explanatory factors for differing functional groups, in support of H4. Two major categories emerged. Composition within some functional groups was associated with the environmental factors ecosystem and leaf type (mycoparasites/yeasts, necrotrophic plant pathogens, primary saprotrophs, and endophytes), indicating response of specific taxa within these groups to environmental conditions or plant host species. Composition of other functional groups was associated more with forest stand (ectomycorrhizal fungi, lichens, and white rot saprotrophs), possibly consistent with dispersal limitation mechanisms. These findings are consistent with some of our expectations, except that mycoparasites/yeasts were found to be more sensitive to the environment than anticipated, and there was greater dispersal limitation indicated for primary saprotrophs. These results demonstrate that separate groups of fungi are difficult to group together in ecological studies, as they are impacted by different community assembly mechanisms to varying degrees and therefore have confounding patterns (Schröter et al. 2019, Masumoto et al. 2023).
Taxonomic composition of fungal communities
Ascomycete sequences dominated almost all leaves in all ecosystems tested. This dominance has previously been observed on senesced leaves and can be explained by the presence of Ascomycete endophytes, necrotrophs, and primary saprotrophs and the abundance of labile compounds promoting the growth of fast-growing early colonizing fungi (Schneider et al. 2012, Urbanova et al. 2015). However, some ascomycetes also can produce enzymes capable of breaking down recalcitrant compounds seen in more decomposed litter (Osono 2007, Gacura et al. 2016, Fillat et al. 2017). Dominance of fungal order Helotiales on most leaves is consistent with a highly diverse fungal order including major groups of necrotrophic plant pathogens, cellulose decomposers, and early leaf litter colonizers (Lindahl et al. 2007, Purahong et al. 2016). Other prevalent groups of Ascomycete fungi found include the orders Hypocreales and Capnodiales, which also include endophytes, plant pathogens, and saprotrophs (Rehner and Samuels 1995, Crous et al. 2009). The highest abundance genus identified was Mycoarthris (Table S1, Supporting Information), which is often found in soil and decomposing plant material (e.g. Baldrian et al. 2012, Neupane et al. 2021), but remains poorly characterized.
Basidiomycetes were more prevalent on recalcitrant leaf litter (BOWO leaves). This was expected as they can be more prevalent on leaf litter of lower nutrient quality (Voriskova and Baldrian 2013) and include groups that break down recalcitrant plant cell wall components such as cellulose and lignin (Baldrian and Valakova 2008, Lundell et al. 2010). However, we were surprised to find that yeasts from the class Tremellomycetes were the most prevalent group of Basidiomycetes, instead of basidiomycete classes containing species known as specialists in degradation of recalcitrant compounds, such as Agaricomycetes. Soil yeasts have resistant dormant stages and can survive in stressful environments, such as those with frequent desiccation and low productivity (Treseder and Lennon 2015). Their prevalence in BOWO ecosystems may, therefore, be due to the very sandy soil and low moisture availability.
Conclusions
The feasibility of sampling entire, discrete habitat patches with their relative spatial positions has led us to understand that there can be enormous spatial heterogeneity in leaf litter fungal communities over small scales of a few centimeters, as well as at previously recognized regional scales spanning hundreds of kilometers. This heterogeneity is influenced by a variety of processes, both environmental and stochastic. We suggest that further progress in understanding fungal community assembly processes will benefit from hierarchical explorations of fungal functional groups, because mixing functional groups can lead to confounding patterns. In addition, further exploration of priority effects in the context of classic environmental niche-based and dispersal-based metacommunity mechanisms will be critical to explore. Importantly, insights into leaf litter decay are often gained at an ecosystem-level spatial scale, which aggregates across the fine-scale variability in fungal community composition and function that occurs at the scale of adjacent leaves. We suggest that a fuller understanding of the factors structuring fungal communities at fine spatial scales can bring a better understanding to leaf litter decay at an ecosystem-level spatial scale.
Author contributions
Matthew D. Gacura (Conceptualization, Data curation, Formal analysis, Investigation, Methodology, Project administration, Resources, Software, Supervision, Validation, Visualization, Writing – original draft, Writing – review & editing), Donald R. Zak (Conceptualization, Funding acquisition, Methodology, Resources, Writing – review & editing), and Christopher B. Blackwood (Conceptualization, Data curation, Formal analysis, Funding acquisition, Investigation, Methodology, Project administration, Resources, Software, Supervision, Validation, Visualization, Writing – original draft, Writing – review & editing).
Acknowledgement
This research was supported by grants from the US National Science Foundation (DEB-0918240 and DEB-0918878) and US Department of Energy (DE-SC0004335). Additional funding was provided by the Kent State Department of Biological Sciences. We thank the following individuals for assistance in the field or lab: Eugene Ryee, Suhana Chattopadhyay, Larry Feinstein, and Oscar Valverde-Barrantes.
Conflict of interest
None declared.
