


Abstract
Genomic regions sometimes show patterns of genetic variation distinct from the genome-wide population structure. Such deviations have often been interpreted to represent effects of selection. However, systematic investigation of whether and how non-selective factors, such as recombination rates, can affect distinct patterns has been limited. Here, we associate distinct patterns of genetic variation with reduced recombination rates in a songbird, the Eurasian blackcap (Sylvia atricapilla), using a new reference genome assembly, whole-genome resequencing data and recombination maps. We find that distinct patterns of genetic variation reflect haplotype structure at genomic regions with different prevalence of reduced recombination rate across populations. At low-recombining regions shared in most populations, distinct patterns reflect conspicuous haplotypes segregating in multiple populations. At low-recombining regions found only in a few populations, distinct patterns represent variance among cryptic haplotypes within the low-recombining populations. With simulations, we confirm that these distinct patterns evolve neutrally by reduced recombination rate, on which the effects of selection can be overlaid. Our results highlight that distinct patterns of genetic variation can emerge through evolutionary reduction of local recombination rate. The recombination landscape as an evolvable trait therefore plays an important role determining the heterogeneous distribution of genetic variation along the genome.
Note: A version of this article was reviewed and recommended by PCI Evol Biol (https://doi.org/10.24072/pci.evolbiol.100711)
Introduction
Patterns of genetic variation in the genome represent ancestries of sequences and are influenced by population history. While genome-wide genetic variation represents population structure (Patterson et al., 2006; McVean, 2009), randomness in genealogies also contributes to fluctuation of local genetic variation along recombining chromosomes. Specifically, genealogies can differ between loci even under the same population history (Dutheil et al., 2009; Martin and Van Belleghem, 2017; Pamilo and Nei, 1988; McVean and Cardin, 2005; Wiuf and Hein, 1999; Wakeley, 2020, 2008). This is because realisation of a genealogy under a given population history is a probabilistic process: an ancestral haplotype for a set of individuals at one locus is not necessarily a common ancestor of the same set of individuals at another locus (Shipilina et al., 2023). Patterns of local genetic variation along the genome tend to conform with the population structure with random fluctuation (Fig. 1).
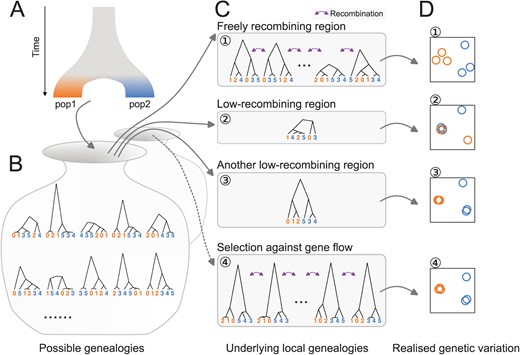
Distinct patterns of genetic variation can be due to reduced recombination rate. Population history (A) affects the distribution of possible genealogies (B) from which local genealogies are drawn (C). The number of genealogies in a genomic interval with a fixed physical length depends on the local recombination rate (C). Mutations occurring on the genealogies (not shown) determine the patterns of realised genetic variation. The realised genetic variation can be summarised and visualised with various methods such as PCA (D). (1) In freely recombining neutral regions, mutations represent many genealogies and hence the pattern of genetic variation converges to the population structure. (2, 3) In low-recombining neutral regions, mutations represent few genealogies covering the region leading to patterns of genetic variation distinct from the population structure. (3) Due to randomness in sampling of genealogies, some of such distinct patterns can be similar to patterns expected at targets of selective factors (c.f. 4). (4) At targets of selection, distribution of possible genealogies is different from that at neutral regions, which is depicted as a different set of possible genealogies in B and the dotted arrow.
Inference of population structure as well as other genome-wide analyses based on genetic variation take advantage of a sufficient number of unlinked variable sites (e.g., single nucleotide polymorphisms (SNPs)) to eliminate the effect of randomness. One of the most common methods to summarise population structure based on this approach is principal component analysis (PCA) applied on a whole-genome genotype table (Price et al., 2006; McVean, 2009). In a whole-genome PCA, variation among individuals based on variable sites of the entire genome are usually projected onto a few major axes (some analyses use many more axes), and the distances among individuals on these reduced dimensions represent genetic differences. Summarising population structure and other related measures using the entire genome has been proven to be an effective approach to eliminate random fluctuation of genealogies along the genome (Cao et al., 2020; Fedorova et al., 2013; Shao et al., 2023; Bhatia et al., 2013; Peter, 2022).
However, some fundamental biological questions concern selective factors that systematically bias the shape of genealogies at a genomic local scale, shifting the expected patterns of genetic variation from the population structure. For example, patterns of local genetic variation are distinct under selection against gene flow (Figure 1C4), positive selection and adaptive introgression because they affect coalescence rate, topology, and branch lengths of the underlying genealogies (Hejase et al., 2020; Wolf and Ellegren, 2017; Setter et al., 2020; Speidel et al., 2019; Martin et al., 2015). Empirically, genome scans of population genetic summary statistics have been commonly used to identify regions with distinct patterns of genetic variation compared to the genome-wide pattern (Delmore et al., 2018; Irwin et al., 2018; Roesti et al., 2013; Rougemont et al., 2021; Kawakami et al., 2017). Many of these have identified regions with distinct patterns, such as elevated differentiation and reduced diversity, within low-recombining genomic regions (Geraldes et al., 2011; Roesti et al., 2013; Renaut et al., 2013; Roesti et al., 2013; Rougemont et al., 2021; Kawakami et al., 2017). Distinct patterns at low-recombining regions can influence the chromosome-wide (Neafsey et al., 2010; Knief et al., 2016) and even genome-wide population structure (Mérot et al., 2021). These associations between distinct patterns of genetic variation at “outlier regions” or “genomic islands” and reduced recombination rate is often interpreted as linked selection (Burri et al., 2015; Burri, 2017; Delmore et al., 2015, 2018; Van Doren et al., 2017; Irwin et al., 2018; Roesti et al., 2013; Rougemont et al., 2021; Kawakami et al., 2017). However, a non-selective explanation is equally conceivable and yet often overlooked: the focal genomic region may contain too few underlying genealogies for a genome scan to eliminate the effect of random fluctuation simply due to low recombination rate, which is represented as the distinct patterns of genetic variation (Lotterhos, 2019; Booker et al., 2020). Specifically, it has not been well studied what aspects of distinct patterns of genetic variation can be explained by reduced recombination rate, and what other aspects reflect the effect of selection.
We address the effect of reduced recombination rate on local genetic variation using a songbird species, Eurasian blackcap (Sylvia atricapilla, hereafter “blackcap”), which is characterised by variability in seasonal migration across its distribution range (Berthold, 1988, 1991; Helbig, 1991; Delmore et al., 2020b). Populations with diverged migratory phenotypes split as recently as ~30,000 years ago, likely corresponding to the last glacial period and now exhibit population structure (Figure 2A-C, Supplementary Figure S1) (Delmore et al., 2020a). Due to their recent split and relatively large effective population size, genetic differentiation is very low among blackcap populations (Delmore et al., 2020a). The presence of population structure albeit with the low levels of differentiation makes the blackcap a perfect system to investigate local deviations of genetic variation: even the slightest effects of factors that change local genetic variation are likely detectable because such effects are not obscured by population structure. In addition, fine-scale recombination maps for multiple populations are available for this species (Bascón-Cardozo et al., 2022a), facilitating investigation of the relationship between changes in the recombination landscape and locally distinct patterns of genetic variation.
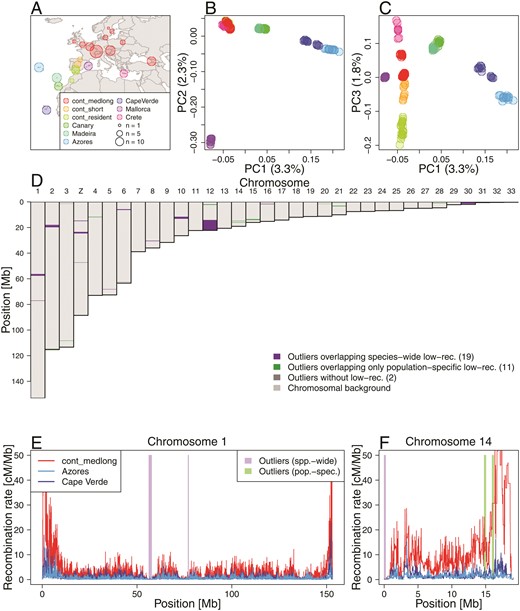
Local PCA outliers coincide with species-wide and population-specific low-recombining regions A. Geographic location of blackcap populations included in this study. Each point on the map represents a sampling location where multiple individuals were sampled. Populations were defined based on the geographic location, migratory phenotype, and genomic-wide population structure. B, C. Genome-wide PCA illustrating population structure. D. Distribution of outlier regions based on local PCA using lostruct. E, F Inferred recombination rates along two exemplified chromosomes (chromosomes 1 and 14) in three blackcap populations (cont_medlong, Azores, and Cape Verde). In D-F, purple and green shades respectively indicate positions of outliers that coincide with species-wide and population-specific low-recombining regions. The two green shades in F both overap with Azores and Cape Verde-specific low-recombining regions. cont_medlong: medium and long distance migrant population breeding on the continent; cont_short: short distance migrant population breeding on the continent; cont_res: resident (non-migrant) population breeding on the continent. All island populations (Canary, Madeira, Azores, Cape Verde, Mallorca and Crete) are resident.
By leveraging a large-scale genomic re-sequencing dataset, we first systematically explore distinct patterns of local genetic variation along the blackcap genome, and compare these with genomic regions exhibiting reduced recombination rate. We further investigate the patterns of genetic variation in outlier regions and associate them with the prevalence of recombination suppression across populations. We also conduct simulations to analyse how reduced local recombination rate in the entire species and in a subpopulation with and without selection affects patterns of genetic variation through time. Finally, we propose a model of local genetic variation representing haplotype structure corresponding to evolutionary changes in local recombination rate.
Materials and Methods
Empirical analyses
de novo genome assembly
We generated a chromosome-level reference genome of the blackcap using the Vertebrate Genomes Project pipeline v1.5 (Rhie et al., 2021). We collected blood of a female blackcap from Tarifa, Spain population. We assembled contigs from PacBio long reads, sorted haplotypes, and scaffolded them with 10X Genomics linked reads, Bionano Genomics optical mapping, and Arima Genomics Hi-C linked reads. Base call errors were polished with both PacBio long reads and Arrow short reads to achieve above Q40 accuracy (no more than 1 error every 10,000 bp). Manual curation identified 33 autosomes and Z and W chromosomes (plus 1 unlocalised W). Autosomes were named in decreasing order of size, and all had counterparts in the commonly used VGP reference zebra finch assembly (Supplementary Table S2). The final 1.1 Gb assembly had 99.14% assigned to chromosomes, with a contig N50 of 7.4 Mb, and scaffold N50 of 73 Mb, indicating a high-quality assembly that fulfills the VGP standard metrics. The primary and alternate haplotype assemblies are provided under NCBI BioProject PRJNA558064, accession numbers GCA_009819655.1 and GCA_009819715.1.
Whole-genome resequencing
We resequenced 69 blackcap samples from various populations across the species distribution range (Supplementary Table S2) to complement an existing dataset of 110 blackcaps, 5 garden warblers, and 3 African hill babblers that had been sequenced previously (Delmore et al., 2020a). Blood samples from the additional 69 blackcaps were collected from the brachial vein and stored in 100% ethanol. High molecular weight genomic DNA was extracted with a standard salt extraction protocol or through the Nanobind CBB Big DNA Kit Beta following the manufacturer’s instructions. Libraries for short insert fragments between 300 and 500 bp were prepared and sequenced for short paired-end reads on either Illumina NextSeq 500, HiSeq 4000 or NovaSeq 5000 (Supplementary Table S1).
We performed quality control of the reads with FastQC version 0.11.8 (https://www.bioinformatics.babraham.ac.uk/projects/fastqc/), and mapped the reads against the blackcap reference genome using BWA mem (Li, 2013). After we performed quality control per sample for BAM files using QualiMap version 2.2.1 (Okonechnikov et al., 2016), Picard CollectMultipleMetrics, CollectRawWgsMetrics,CollectWgsMetrics and MultiQC version 1.8 (Ewels et al., 2016), we called bases at all positions per sample using GATK HaplotypeCaller. We combined the generated gVCF files of 189 individuals into 10 evenly sized subsets with GATK CombineGVCFs. We genotyped SNPs and INDELs using GATK GenotypeGVCFs, and the 10 subsets were concatenated using Picard GatherVcfs into one VCF file covering the entire genome. From this VCF file, SNPs were selected using GATK SelectVariants, after which we filtered SNPs with the following criteria: QD < 2.5; FS > 45.0; SOR > 3.0; MG < 40; MQRankSum < -12.5; ReadPosRankSum < -8.0. We removed garden warblers and African hill babblers from the multi-species VCF and kept only biallelic sites. We estimated blackcap haplotypes using SHAPEIT2 (r837) (Delaneau et al., 2013) with the blackcap recombination map (Bascón-Cardozo et al., 2022a), yielding 142,083,056 SNPs.
Genome-wide PCA
To characterise the population structure of blackcaps, we performed principal component analysis (PCA) using PLINK (Purcell et al., 2007) with the default parameter values.
Local PCA
To identify genomic regions with distinct patterns of genetic variation, we performed local PCA in sliding genomic windows of 1,000 SNPs and summarised dissimilarity of windows by multidimensional scaling using lostrct (Li and Ralph, 2019) in R version 3.5.3. First, we prepared a genotype table and a haplotype table for each chromosome in which rows and columns represented positions and individuals from the phased VCF file using BCFtools. Specifically, genotypes were respectively encoded 0, 1, and 2 for the reference allele homozygotes, heterozygotes, and non-reference allele homozygotes in the genotype table, and 0 and 2 for the reference and the non-reference allele in the haplotype table. Chromosomes shorter than 10 Mb were concatenated to avoid misidentification of short chromosomal background as an outlier region. Distance matrices of windows were computed based on the coordinates (PC1 and PC2) of samples (individuals for genotype-based local PCA, and haplotype for haplotype-based local PCA) within R using lostruct. Multidimensional scaling (MDS) was performed to summarise similarities of local PCA among windows into 20 axes.
Using the lostruct output, we identified chromosomal intervals with distinct patterns of genetic variation. In each chromosome, windows with MDS value apart from the mode of the distribution by greater than 0.3 for any one of the 20 axes were defined as outlier windows. This threshold was determined by visualising the distribution of MDS values in each chromosome (Supplementary Figure S2). For each MDS axis, we defined genomic intervals with at least five outlier windows longer than 100 kb as “outlier regions” with distinct patterns of genetic variation. Overlapping intervals across different MDS axes as well as intervals identified based on genotypes and haplotypes were merged using BEDtools. To verify that the outliers show pattern of genetic variation distinct from the whole-genome PCA, we performed PCA using all SNPs within each outlier region using PLINK (Supplementary Figures S6-S8). Genomic regions showing similar pattern to the whole genome PCA were identified with visual inspection and discarded from the outliers.
We assessed consistency between the pipelines using genotypes and haplotypes, by comparing MDS results of genotype- and haplotype-based lostruct (see Supplementary Notes and Supplementary Figure S4 for details). We also assessed whether lostruct can identify outliers irrespective of the presence/absence of other outliers on the same chromosome as well as the chromosome length. Briefly, we ran lostruct treating either one part of a blackcap chromosome (“split chromosomes”) or multiple blackcap chromosomes as a single chromosome (“joined chromosome”) (see Supplementary Notes and Supplementary Figure S5 for details).
LD and recombination landscape
To calculate LD around outlier regions, we first extracted SNPs within and 30% length outside each outlier. We then thinned SNPs so that all neighbouring SNP positions were at least 10 kb away from each other. Linkage disequilibrium (LD) between all pairs of thinned SNPs was calculated with VCFtools with the --geno-r2.
We inferred recombination landscape along blackcap chromosomes using Pyrho (Spence and Song, 2019). In all inferences, we used demography of focal populations inferred in Delmore et al. (2020a). Before the recombination inference, focal samples were filtered and singletons were removed. We ran Pyrho with mutation rate of per site per generation (Smeds et al., 2016), block penalty of 20, and window size of 50 kb to infer population-level recombination landscape in Azores, Cape Verde, continental resident, and medium-long distance migrants (represented by medium distance south-west migrants). We computed the mean recombination rate in 10 kb sliding windows for each population.
We defined low-recombining regions and evaluated overlaps between outlier regions and low-recombining regions in four steps (see Supplementary Notes for detail). Briefly, 1. low-recombining regions were defined for each population recombination map; 2. association between all outlier regions and the low-recombining regions was tested for each population; 3. species-wide and population-specific low-recombining regions were defined; and 4. outlier regions were classified as either species-wide, population-specific low-recombining regions or no overlap with any low-recombining region.
To characterise genotype-specific LD and recombination landscape at the five outlier regions with three clusters of individuals in PCA, we applied vcftools --geno-r2 and Pyrho (Spence and Song, 2019) to our empirical data using each genotype (AA, AB, and BB in Supplementary Figure S11) separately. Validation of this procedure is described in “Simulation: Validation of LD-based inference of recombination landscape using non-randomly chosen samples”.
Inversion breakpoints
Three clusters of individuals observed in PCA with genotype-specific LD at two outlier regions on chromosomes 12 and 30 (see Results below) were indicative of polymorphic inversions (Ruiz-Arenas et al., 2019; Ma and Amos, 2012). To further characterise whether they represent polymorphic inversions, we intended to locate breakpoints by two independent approaches: soft-clip reads and 10x linked reads.
Soft-clip reads
We attempted to identify positions where the presence of soft-clipping of mapped reads is associated with PCA-based genotype of the putative inversions following a custom pipeline (see Supplementary Notes for details). We extracted focal regions around boundaries of the outliers (Supplementary Table S4) from read mapping file of all individuals using SAMTools (Danecek et al., 2021), then measured the proportion of soft-clipped reads compared to all mapped reads per position using samextractclip (Lindenbaum, 2015). This soft-clip proportion was associated with the genotype at the putative inversion to narrow down the candidate breakpoint positions. Based on the distribution of the soft-clip proportion at these positions (Supplementary Figure S15), we selected six positions for which the soft-clip proportion of BB was high enough and that of AB was around a half of BB based on the assumption that soft clip reads covering an inversion breakpoint should originate from haplotype B and non-soft clip reads should originate from haplotype A (Supplementary Table S5). To investigate whether some of these six positions represent inversion breakpoints, we asked whether the soft-clipped segments of the reads have homologous sequences at the other end of the outlier regions (Supplementary Table S5).
10x linked read
We applied a custom pipeline described in Supplementary Notes to an independent set of blackcap individuals (hereafter “10x individuals”) whose genomes were sequenced with the 10x linked-read technology (Delmore et al., 2023, NCBI BioProject PRJEB65115). Briefly, we first genotyped the 10x individuals at the two putative inversion loci based on genotypes at diagnostic SNP positions. We identified two BB individuals for each of the putative inversions on chromosomes 12 and 30. There were no individuals with sufficient evidence to be identified as AB. To identify breakpoints, we aligned the pseudo-haplotype assemblies of these BB individuals as well as one AA individual for each putative inversion to the blackcap reference using Nucmer4 (Marçais et al., 2018), and generated dot plots (Supplementary Figure S16).
Sequence analysis at breakpoint of putative inversion on chromosome 12
10x contigs of pseudo-haplotype B aligned next to the putative breakpoint position of blackcap reference chromosome 12 had an un-aligned flanking sequence. To characterise the DNA sequence of these flanking segments, we extracted the flanking sequences using SAMtools, aligned the sequences to themselves using minimap2 (Li, 2018), and generated self-dot plots (Supplemenrary Figure S17), revealing the presence of tandem repeats. To identify unit of tandem repeats within the flanking sequences, we ran TandemRepeatsFinder (Benson, 1999) against these extracted sequences, resulting in four consensus unit sequences of 144 bp based on two contigs from two individuals. To confirm that the four consensus sequences represent the same tandem repeat (because the unit of identical tandem repeat can have different phases), we ran BLASTn (version 2.10.1, Altschul et al., 1990) with each consensus as query against dimers of the consensus. To investigate whether the tandem repeat found at the putative breakpoint of chromosome 12 in haplotype B is present in chromosome 12 and other chromosomes of the reference and corresponding position of haplotype A, we ran BLASTn with the 144 bp consensus of the tandem repeat unit as the query against blackcap reference and a contig of an AA individual that spans the breakpoint position, and counted how many copies were found in each reference chromosome/scaffold and the 10x contig (Supplementary Figure S18).
Selection in blackcaps
To test for selection in different outlier regions and to compare them with the genome-wide baseline level, we computed nucleotide diversity () and Tajima’s D in 10 kb sliding windows per population using PopGenome (Pfeifer et al., 2014) and VCFtools (Danecek et al., 2011) respectively. The effects of the outlier regions on these statistics were tested using a linear mixed effects model (nlme::lme (Pinheiro et al., 2021)) and a generalised linear mixed effects model (lme4::glmer (Bates et al., 2015)). To test for selection in genes were computed following the counting method (Nei and Gojobori, 1986). Gene annotation of the blackcap was obtained from Bascón-Cardozo et al., 2022b.
Tandem repeats within and outside outlier regions
To characterise correlation between outlier regions with distinct patterns of genetic variation and tandem repeats, we identified tandem repeats in the reference genome and compared the distribution of the tandem repeats with genomic regions with distinct patterns of genetic variation. First, TandemRepeatsFinder (Benson, 1999) was run on the blackcap reference genome with the parameter set recommended on the documentation (trf </path/to/fasta> 2 7 7 80 10 50 500 -f -d -m -h). The output was formatted and summarised for visualisation using custom scripts. Briefly, distribution of tandem repeats with a different unit size along the genome was summarised in 100 kb sliding windows in blocks of repeat unit sizes of 10 bp step (Supplementary Figure S33). Tandem repeats with the six longest repeat unit size were extracted per chromosome, and copy number for each tandem repeat was counted (Supplementary Figure S34).
Next, we tested whether the number of tandem repeats with long repeat unit were enriched in outlier regions at species-wide and population-specific low-recombining regions. We extracted tandem repeats with repeat unit size greater than or equal to 150 bp, and counted the number of tandem repeats (instead of total copy number) within and outside outlier regions. We performed Fisher’s exact tests to test independence between the number of long tandem repeats and the mode of recombination suppression (species-wide/population-specific) (Supplementary Table S7) using fisher.test function in R.
Simulation
Validation of LD-based inference of recombination landscape using non-randomly chosen samples
We asked whether LD-based recombination map inference using individuals chosen based on the inversion genotype instead of random sampling is informative of the underlying mode of recombination suppression. To this end, we used SLiM version 3.5 (Haller and Messer, 2019) to simulate a 5 Mb-long chromosomes with recombination suppression over 3-Mb segment in the middle with different models of recombination suppression (models 1-6 in Supplementary Table S6) (detailed in Supplementary Notes). We kept the population size (1,000 diploids) smaller than the blackcap effective population size and the mutation rate () greater than assumed in order to minimise the time and computational resources for simulations. We introduced a mutation (inversion marker) on one chromosome at 1 Mb position at the 50th generation. We applied negative frequency-dependent selection (fitness of inversion is where is the frequency of the inversion allele). 1,000 generations after the inversion event, we recorded the mutations in all samples, making a VCF file including all samples. At the 1,000-th generation, 10 individuals for each inversion genotype were randomly sampled, and Pyrho (block penalty of 50 and window size 50) was run to estimate recombination rates. The inferred recombination maps are shown in Supplementary Figure S13.
Effects of recombination suppression model on recombination rate inference at an inversion
Three clusters of individuals observed in PCA at five outlier regions indicate the presence of distinct haplotypes (see Results for details). Polymorphic inversions are known to show this pattern due to suppression of recombination between the normal and inverted alleles (Wellenreuther and Bernatchez, 2018). To test whether some of the five outlier regions represent polymorphic inversions, we intended to infer recombination rates using AA, AB, and BB individuals separately based on linkage disequilibrium (LD) patterns. Before addressing this in blackcaps empirically, we assessed how different types of recombination suppression at a haplotype block affect inference of recombination landscape using a set of individuals with a certain combination of haplotypes. To investigate the effect of a genotype-specific suppression of recombination on LD-based inference of recombination rate, we simulated six different modes of recombination suppression (Supplementary Table S6) using SLiM version 3.5. Specifically, we performed 1,000 replicates of forward-time simulations of two 500 kb-long chromosomes with neutral mutation rate of [per site per generation] and recombination rate of [per site per generation] in a population of 1,000 diploid individuals under the Wright-Fisher model. We introduced a mutation (inversion marker) on one chromosome at 100 kb position at the 50th generation. To allow for the inversion to remain in the population, we applied negative frequency-dependent selection (fitness of inversion is for models 1-3 and for models 4-6 where is the frequency of the inversion allele). 1,000 generations after the inversion event, we recorded the mutations in all samples, making a VCF file including all individuals. Based on the genotype at the marker, we randomly sampled 10 individuals for each inversion genotype. Pyrho was run to estimate recombination rates using the sampled 10 individuals, with the block penalty 50 and window size 50 (Supplementary Figure S13).
Coalescent simulation of species-wide reduction of recombination rate
To discern the effect of reduced recombination rate, demographic history, and unequal sample sizes among population on outlier regions identified by lostruct, we performed neutral coalescent simulations using msprime version 1.2.0 (Baumdicker et al., 2022). We simulated a 1-Mb long recombining chromosome with a mutation rate of [per site per generation]. We implemented 11 models differing in the recombination maps, population subdivision, and demographic history (see Supplementary Notes and Supplementary Figure S19 for details). For each model, we ran 1,000 replicates of simulations and recorded SNPs in VCF format. We identified outlier regions using lostruct the same way as in the empirical analysis (Supplementary Figure S20). To evaluate how reduced recombination rate affects the mean and variance of population genetic summary statistics, we computed nucleotide diversity (), Tajima’s D, and , using VCFTools (Supplementary Figures S21-S23).
Forward simulation of species-wide reduction of recombination rate
To investigate how species-wide low-recombining regions affect patterns of local genetic variation depicted in local PCA, we performed forward simulation with SLiM version 4.0.1 (Haller and Messer, 2022). We simulated 100 replicates of two 500 kb-long chromosomes with neutral mutation rate of [per site per generation] and recombination rate of [per site per generation] except for an interval from 100 to 400 [kb] of the first chromosome where recombination rate was set to , which is 1/1000 of the normally recombining chromosome. First, we ran a burn-in of 4,000 generations for an ancestral population of 1,000 diploids. After the burn-in, we made three populations of 1,000 diploids (pop1, pop2, and pop3) split from the ancestral population. We sampled 50 individuals per population every 20 generations over 1,000 generations after the population split and recorded SNPs in VCF. For each time point of each of 100 simulation replicates, we performed PCA with PLINK, using SNPs either within 100 to 400 [kb] of the first chromosome (pop1-specific suppression) or the normally recombining chromosome.
We investigated how reduced recombination rate affects representation of population subdivision in local PCA. To evaluate whether the individuals from different populations were distributed differently in local PCA at the low-recombining region, we performed Fasano-Franceschini test (Fasano and Franceschini, 1987), which is a multi-dimensional extension of Kolmogorov-Smirnov test, in three pairs of populations (pop1-pop2, pop1-pop3, pop2-pop3). We counted the number of significant pairs of populations (0, 1, 2, or 3) for each time point of each replicate. We compared between the low-recombining and normally recombining regions the number of pairs of populations with distinct distribution in PCA (Supplementary Figure S31).
Forward simulation of population-specific reduction of recombination rate
To investigate how evolution of low-recombining regions in population(s) affect patterns of local genetic variation depicted in local PCA, we performed forward simulation with SLiM version 4.0.1. We simulated two 500 kb-long chromosomes with neutral mutation rate and recombination rate of [per site per generation] and [per site per generation]. First, we ran a burn-in of 4,000 generations for an ancestral population of 1,000 diploids. After the burn-in, we made three populations of 1,000 diploids (pop1, pop2, and pop3) split from the ancestral population, after which gene flow between all pairs of populations were set to 0.0025. We introduced recombination suppression in pop1 from 100 to 400 [kb] of the first chromosome in two scenarios. In the first scenario, recombination suppression was introduced at the same time of the split. In the second scenario, recombination suppression was introduced 4,000 generations after the population split event, allowing the three populations to differentiate before population-specific recombination suppression was introduced in pop1. We sampled 50 individuals per population every 20 generations over 1,000 generations after the introduction of the population-specific suppression of recombination and recorded SNPs in VCF. For each time point of each of 1,000 simulation replicates, we performed PCA with PLINK, using SNPs either within 100 to 400 [kb] of the first chromosome (pop1-specific suppression) or the normally recombining chromosome.
To characterise factors represented in the primary axes of distinct local PCA at population-specific low-recombining regions, we performed one replicate of SLiM simulation with the same scenarios of models 1 and 2 recording the full ancestry and mutations in tree sequences, with an increased duration of burn-in (40,000 generations) to make sure that all lineages at sampling time coalesce. We loaded the tree sequence with mutations in tskit (Kelleher et al., 2018) and sampled 50 diploids per population, and saved SNPs in VCF. Using the VCF files for each time point for each model, we performed PCA using PLINK at the population-specific low-recombining region, and determined one time point per model showing typical spread of individuals from the low-recombining population in PCA (Supplementary Figure S27A, E). For these PCAs we identified 5% SNPs with the highest loadings to the first two PC axes. We analysed these mutations on the underlying genealogies using tskit. Specifically, we investigated whether mutations originating from the low-recombining population were enriched in the high-loading mutations (Supplementary Figure S27C, G) with a test. We also assessed whether multiple mutations originating in the low-recombining population occurring on the same genealogical branches (i.e., mutations on the same ancestral haplotypes) were enriched in the high-loading mutations (Supplementary Figure S27D, H). For this, we compared the number of mutations sharing the same genealogical branches among the high-loading mutations originating from the low-recombining population and the same number of randomly-selected mutations originating from the low-recombining population by a Kolmogorov-Smirnov test.
Effects of linked selection on local PCA
Background selection
To investigate the linked effect of purifying selection at low-recombining regions (background selection) on patterns of local genetic variation represented in local PCA, we performed forward simulation with SLiM version 4.0.1. We simulated a species-wide low-recombining region in three populations as described above, except we changed the distribution of fitness effect of mutations with three different ratios between neutral (“n”, ) and deleterious (“d”, and ) mutations of . To evaluate whether individuals from different populations were distributed differently in the local PCA at the low-recombining region, we performed Fasano-Franceschini test between three pairs of populations (pop1-pop2, pop1-pop3, pop2-pop3). We counted the number of significant pairs of populations (0, 1, 2, or 3) for each sampled time point of each replicate (out of 100) for each DFE (Supplementary Figure S31).
Positive selection
To investigate the linked effect of positive selection at low-recombining regions on patterns of local genetic variation represented in local PCA, we performed forward simulation with SLiM version 4.0.1 under four scenarios: population-specific sweep and sweep before populations split, with and without reduced local recombination rate. We simulated 10 replicates of one 500 kb-long chromosome with neutral mutation rate of [per site per generation] and recombination rate of [per site per generation]. In scenarios with reduced recombination rate, we introduced a reduced recombination rate within an interval from 100 to 400 [kb] of the chromosome where recombination rate was set to , which is 1/1000 of the normally recombining regions. For all scenarios, we ran a burn-in of 4,000 generations for an ancestral population of 1,000 diploids. In the scenarios with population-specific sweep, we made three populations of 1,000 diploids (pop1, pop2, and pop3) split from the ancestral population at the 4000-th generation. We introduced a strongly beneficial mutation ( and ) in the middle of a chromosome of one randomly selected sample of the first population at the 100-th generation after the populations split. In the scenarios with sweep before split, we introduced a strongly beneficial mutation ( and ) in the middle of the chromosome of one randomly selected sample of the ancestral population, and made the three populations of 1,000 diploids split at the 100-th generation after the introduction of the beneficial mutation. We sampled 100 diploid individuals per population every 20 generations since the introduction of the beneficial mutation (scenarios of population-specific sweep) or the split (scenarios of ancestral sweep) and recorded the SNPs in VCF format. We performed PCA using PLINK.
Results
Chromosome-level reference assembly
To allow population genomic analyses in the blackcap system, we generated a chromosome-level reference genome using the Vertebrate Genomes Project pipeline v1.5 (Rhie et al., 2021). We collected blood of a female blackcap from Tarifa, Spain population. We generated contigs from Pacbio long reads, sorted haplotypes, and scaffolded them with 10X Genomics linked reads, Bionano Genomics optical mapping, and Arima Genomics Hi-C linked reads. Base call errors were polished with both PacBio long reads and Arrow short reads to achieve above Q40 accuracy (no more than 1 error every 10,000 bp). Manual curation identified 33 autosomes and Z and W chromosomes (plus 1 unlocalised W). Autosomes were named in decreasing order of size, and all had counterparts in the commonly used VGP reference zebra finch assembly (Supplementary Table S2). The final 1.1 Gb assembly had 99.14% assigned to chromosomes, with a contig N50 of 7.4 Mb, and scaffold N50 of 73 Mb, indicating a high-quality assembly that fulfills the VGP standard metrics. The primary and alternate haplotype assemblies are provided under NCBI BioProject PRJNA558064, accession numbers GCA_009819655.1 and GCA_009819715.1.
Deviation of genetic variation coincides with low-recombining regions
To investigate the genome-wide distribution of genetic variation, we mapped short reads of the whole-genomes of 179 blackcaps including 69 newly sequenced individuals (Supplementary Table S1) on a de novo-assembled reference genome generated through the Vertebrate Genomes Project (VGP, Rhie et al., 2021), and called SNPs (Materials and Methods). To characterise genome-wide genetic variation, we performed PCA using SNPs in all autosomes, revealing population structure. While PC1 and PC2 represented differentiation of island populations (Figure 2B), PC3 represented structure within continental populations with different migratory phenotypes (Figure 2C). To identify genomic regions with patterns of genetic variation distinct from the population structure, we performed local PCA using lostruct (Li and Ralph, 2019). To minimise the potential bias from the definition of populations and the choice of focal populations, we chose lostruct, which does not split data by user-defined populations based on the population labels, . Briefly, lostruct performs PCA in sliding genomic windows and dissimilarity of PCA among windows are summarised with multidimensionality scaling (MDS). Distinct patterns of genetic variation of windows relative to the chromosome-wide background variation (i.e., population structure) are represented by extreme values along the MDS axes. We performed lostruct on both genotype and phased haplotype data with window size of 1,000 SNPs. We identified outlier genomic regions in two steps. We first identified candidate “outlier windows” (detailed in Materials and Methods) by applying threshold MDS values (the mode of the distribution 0.3). Then, to simplify multiple windows with shared distinct patterns (reflecting common causes) into larger blocks, we identified genomic intervals longer than 100 kb with at least five candidate outlier windows based on the same MDS axis and merging the intervals based on the genotype- and phased haplotype-based approaches. This yielded 32 genomic regions with distinct patterns of variation (hereafter “outlier regions”, Figure 2D, Supplementary Table S3 and Figure S3). Their size ranged from 0.12 to 8.11 Mb (mean and median of 0.71 and 0.29 Mb), and each region contained 5,000 to 356,000 SNPs. Comparing the genomic distribution of these outlier regions to population-level recombination maps, we found that low-recombining regions (nominally recombination rate lower than the 20 percentile of each chromosome) were significantly enriched in the outlier regions (permutation tests with n = 1,000, p-value = 0.000 (Supplementary Figure S10)). Among these 32 outlier regions, 19 coincided with regions in which recombination rate was reduced in most tested populations (“species-wide” low-recombining regions), 11 coincided with regions in which recombination rate was reduced in one or two populations (“population-specific” low-recombining regions), and two did not coincide with low-recombining regions in any population (Figure 2E, F, Supplementary Figure S9).
To further investigate the outlier regions, we separately performed PCA using SNPs in each region, revealing diverse patterns of distinct genetic variation (Figure 3A-C top). First, species-wide low-recombining regions showed different levels of clustering of individuals in PCA (Supplementary Figure S6). Specifically, the PCA projections consisted of either three distinct clusters (Figure 3A top, Supplementary Figure S6), six loose clusters (Figure 3B top, Supplementary Figure S6), or mixture of all individuals without apparent clustering (Supplementary Figure S6), suggesting that they represent haplotype structure with different numbers of low-recombining alleles. These clusters did not clearly separate populations, indicating a greater contribution of haplotype structure than the population structure. Four of these (e.g., Figure 3A top, Supplementary Figures 6 and 11) had the clearest clustering patterns with three groups of individuals in PCA , which is expected for a haplotype block with two distinct alleles (Ma and Amos, 2012; Todesco et al., 2020; Huang et al., 2020). Because the presence of a haplotype block with distinct alleles is a prominent characteristic for a polymorphic inversion (Ma and Amos, 2012; Todesco et al., 2020; Huang et al., 2020), we investigated whether the five outliers indeed represent five inversions. An inversion locus is expected to show high LD in all but homozygous individuals, while a non-inversion haplotype block is expected to show high LD irrespective of the genotype. Two regions showed LD patterns consistent with segregating inversions (Figure 3A bottom, Supplementary Figure S12), and the other two showed patterns of non-inversion haplotype blocks (Supplementary Figure S12), indicating that recombination suppression with different mechanisms resulted in similar patterns of genetic variation due to presence of two distinct segregating haplotypes.
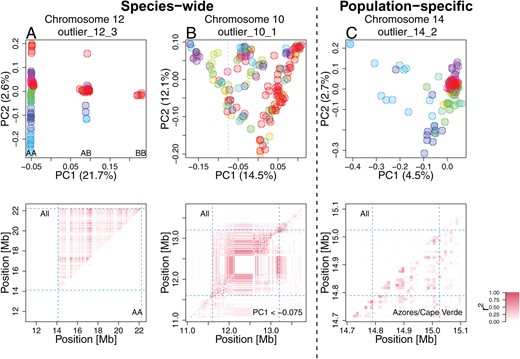
Patterns of genetic variation and linkage disequilibrium at local PCA outliers Top: PCA at exemplified outlier regions visualising the patterns of local genetic variation. Data points represent blackcap individuals colour-coded by population as depicted in Figure 2. Bottom: LD calculated for all individuals (top-left diagonal) and for subset individuals (bottom-right diagonal). A. A putative inversion. Three clusters correspond to combination of two non-recombining alleles possessed by individuals, depicted as AA, AB, and BB. LD calculated using AA individuals is not elevated, in line with heterozygote-specific recombination suppression at an inversion locus (Supplementary Figure S14). B. A species-wide low-recombining region with six loose clusters of individuals. LD calculated using subset individuals was elevated, suggesting genotype-non-specific recombination suppression. C. A population-specific low-recombining region. The variance in genetic distances between individuals of the low-recombining populations (Azores (blue) and Cape Verde (light blue)) is greater than between other pairs of individuals (top). LD calculated using individuals of the low-recombining populations is elevated(bottom).
Second, population-specific low-recombining regions exhibited distinct patterns of genetic variation consistently across the outlier regions. While individuals from the low-recombining populations were spread in PCA projections, individuals of other populations were more densely clustered (Figure 3C top, Supplementary Figure S7). This pattern indicates that the variance in genetic distances between a pair of individuals of the low-recombining populations is greater than between individuals of normally recombining populations. LD was elevated only in the low-recombining populations (Figure 3C bottom), supporting population-specific reduction in recombination rate.
Reduced recombination rate generates distinct patterns of genetic variation
To discern the effect of reduced recombination rate, demographic history, and unequal sample sizes among population on outlier regions, we performed neutral coalescent simulations using msprime (Baumdicker et al., 2022). We prepared 11 scenarios differing in the presence/absence of population subdivision, equal/unequal sizes of populations, presence/absence of gene flow between populations, and recombination rate in the middle of the chromosome relative to the chromosomal background (Supplementary Figure S19 and Table S8). We applied lostruct on the simulated data to identify outlier regions. In all 1,000 replicates, reduced local recombnation rate resulted in distinct patterns of genetic variation irrespective of the population structure and demographic history (Supplementary Figure S20). We also asked whether population genetic summary statistics are affected. The mean nucleotide diversity (), Tajima’s D, and were not affected, yet the variance of these statistics was greater within the low-recombining region than in the chromosomal background (Supplementary Figures S21-S23).
To address how species-wide and population-specific reduction in recombination rate affect the patterns of genetic variation over time, we performed forward simulations using SLiM (Haller and Messer, 2022). First, to investigate the effects of species-wide reduction in local recombination rate, we simulated one ancestral population of 1,000 diploids with a low-recombining genomic region that splits into three subpopulations (pop1, pop2, pop3. Figure 4A). We sampled individuals over time after the populations split and conducted PCA both in the low-recombining and normally recombining genomic regions. PCA patterns at low-recombining regions (Figure 4B, C, Supplementary Figure S24) were distinct from normally recombining regions (Figure 4D). The low-recombining regions exhibited three, six, or more clusters of individuals resembling our empirical results. The clusters of individuals represented genotypes consisting of different combinations of ancestral haplotypes (Supplementary Figure S25). The distinct patterns representing haplotype structure persisted until population structure started to emerge along the PC axes (Figure 4B, C). Accordingly, the percentages of variation explained by PC1 and PC2 were higher at low-recombining regions than in normally recombining region until this transition (Figure 4C). Distinct patterns in the low-recombining regions persisted over longer times than it took for population structure in normally recombining region to emerge (Figure 4D). These results suggest that distinct patterns of genetic variation in species-wide low-recombining regions represent haplotype structure whose transition to the population structure is slower than in normally recombining regions.
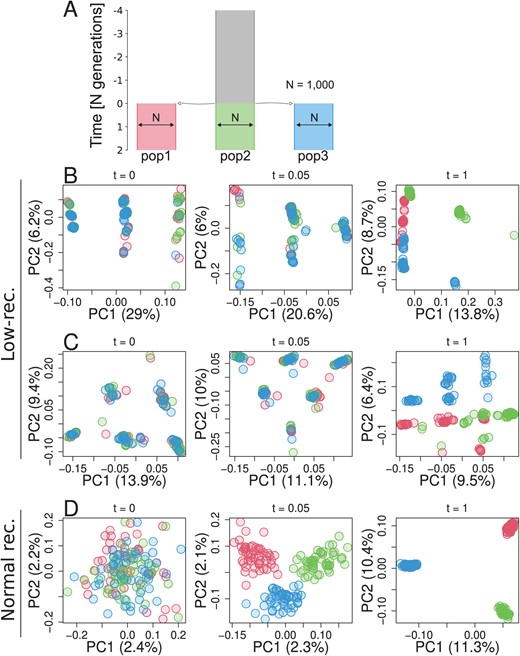
Simulation of a species-wide low-recombining region. A. Simulated demography scenario. Our simulated genome contained two chromosomes, one with a low-recombining region and the other without. B, C. PCA showing patterns of genetic variation at the species-wide low-recombining region at three time points in three exemplified simulation replicates. D. PCA showing patterns of genetic variation at a normally recombining chromosome at three time points in the same replicates as B.
Second, to investigate the effects of population-specific reduction in local recombination rate, we performed forward simulations. Three populations (pop1, pop2, and pop3) and their ancestral population had 1,000 diploid individuals, and pop1 evolved a reduced local recombination rate. We considered two cases with respect to when the population-specific reduction in recombination rate is introduced: before or after differentiation of populations. In the first scenario (Supplementary Figure S26), recombination suppression was introduced at the same time as the three populations split, while in the second scenario (Figure 5A) recombination suppression was introduced 4,000 generations after the split. We conducted PCA in genomic regions with and without population-specific recombination suppression using individuals sampled over time. In both scenarios, the genomic region with population-specific recombination suppression transiently showed distinct patterns of genetic variation (Figure 5B, Supplementary Figure S26B) resembling the empirical results, while regions without population-specific suppression showed population structure (Figure 5C). Haplotype structure was not as conspicuous as in species-wide low-recombining regions (Supplementary Figure S27B, F, c.f. Supplementary Figure S25) due to standing genetic variation. Mutations originating in the non-recombining population were enriched in the set of mutations that have the greatest contribution to the distinct pattern of PCA (Supplementary Figure S27C, G. tests, p-value = for model 1 and p-value = for model 2). These mutations were significantly associated with each other in the underlying genealogy sharing common branches compared to other mutations originating in the same population (Supplementary Figure S27D, H. Materials and Methods, Kolmogorov-Smirnov tests, p-value = for model 1 and p-value = 0.0012 for model 2), indicating that the distinct pattern of genetic variation represents sets of mutations that occurred in ancestral haplotypes. Associations between these population-specific mutations on ancestral haplotypes would have eventually decayed by recombination events, but in the low-recombining population the association was maintained due to suppressed recombination, resulting in the cryptic haplotype structure.
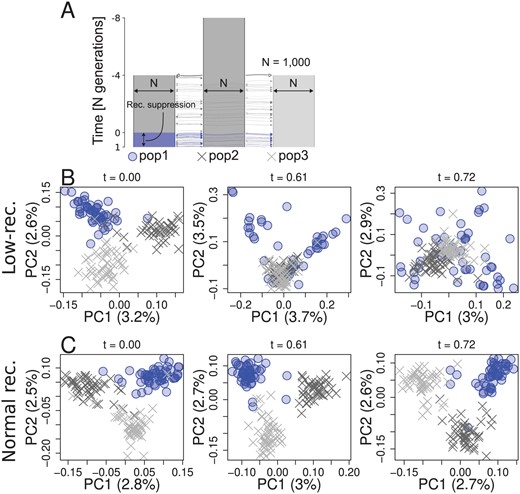
Simulation of a population-specific low-recombining region. A. Simulated scenario. Simulated genome contained two chromosomes, one with a population-specific low-recombining region and the other without. PCA showing patterns of genetic variation at the population-specific low-recombining region (B) and the normally recombining chromosome (C) at three time points in one exemplified simulation replicate.
Effect of selection on patterns of genetic variation
Selection is known to cause distinct patterns of genetic variation (Nielsen, 2005). To test whether the outlier regions based on lostruct identified in the blackcap genome are also targets of selection, we measured nucleotide diversity () and Tajima’s D in each population, as well as ratio between non-synonymous and synonymous substitutions () for annotated genes. Many species-wide low-recombining regions showed reduced nucleotide diversity (Supplementary Figure S28 and Table S9) and Tajima’s D (Supplementary Figure S29; Table S10), suggesting that they are under either positive or purifying selection. Most genes within outlier regions had below 0 (Supplementary Figure S30) with a few genes with positive , indicating that most genes are under purifying selection and a few others are under positive selection. Furthermore, sequence analysis indicated that some but not all species-wide low-recombining outlier regions coincide with putative pericentromeric regions with enrichment of long tandem repeats (Supplementary Figures 33 and 34). These results indicate that the outlier regions may experience effects of selection in addition to reduced recombination rates.
We asked whether the distinct patterns of local genetic variation at the outlier regions observed in blackcaps represent the effect of selection instead of reduced recombination rates. Specifically, we addressed whether the distinct patterns of genetic variation representing haplotype structure could be caused by (i) purifying or (ii) positive selection alone or if they primarily represent the effect of reduced recombination rate. To this end, we used SLiM to simulate purifying and positive selection with and without reduction in recombination rate, and investigated local genetic variation over time by PCA. First, to investigate the effect of purifying selection, we simulated two chromosomes with and without a species-wide low-recombining region under the same demographic history as the neutral scenario (Fig. 4A) but with different strength of purifying selection by introducing mutations with different ratios between the rates of neutral and deleterious mutations (Materials and Methods). Distinct patterns of genetic variation representing haplotype structure evolved only in scenarios where recombination rate was reduced irrespective of the distribution of fitness effects (DFE) (Supplementary Figure S31). Stronger purifying selection (DFE with more frequent deleterious mutations in our simulation) decreased the time for distinct patterns of genetic variation at low-recombining regions to be overtaken by population structure (Supplementary Figure S31A, C). Second, to investigate the effect of positive selection, we simulated a chromosome with or without a species-wide low-recombining region under the same demographic history, and introduced a beneficial mutation 100 generations after the population split in one population (Supplementary Figure S32A) or 100 generations before the split in the ancestral population (Supplementary Figure S32D). For simulations in which the beneficial mutation persisted, we recorded the patterns of local genetic variation by PCA over time. Although positive selection affected patterns of genetic variation compared to the neutral scenario, distinct patterns of genetic variation representing discrete haplotypes were unique to scenarios with reduced recombination rate in both cases (Supplementary Figure S32B-E). These results indicate that distinct patterns of genetic variation represented in local PCA, as in the blackcap outlier regions, primarily reflect haplotype structure due to reduced recombination rate, on which the effect of selection can be overlaid.
Discussion
Distinct patterns of genetic variation at low-recombining regions: Genealogical interpretations
Genealogical noise, genealogical bias, and mutational noise
A number of empirical population genomics studies have identified ecologically and evolutionarily important genomic regions by locating outlier regions with distinct patterns of genetic variation (Jones et al., 2012; Malinsky et al., 2015; Lamichhaney et al., 2016; Lundberg et al., 2023; Lawniczak et al., 2010). Genomic windows in such studies are assumed to be both large enough to eliminate the effect of random fluctuation in local genetic variation and small enough to capture the localised signatures of selection. We showed empirically that genomic regions with distinct patterns of genetic variation identified by a population genomic scan based on principal component analysis (PCA) highly overlap with low-recombining genomic regions (Fig. 2). With simulations, we showed that although selection may affect the amount and pattern of local genetic variation around the target locus, the distinct patterns of genetic variation represented by PCA at low-recombining regions can be primarily explained by haplotype structure due to reduced recombination rate (Figs. 4, 5). We discuss our findings from the perspective of underlying genealogies.
We first define three terms: (1) genealogical noise, (2) genealogical bias, and (3) mutational noise. (1) By “genealogical noise” we refer to the fact that gene genealogies vary along the genome following a null distribution given a population history (Dutheil et al., 2009; Martin and Van Belleghem, 2017; McVean and Cardin, 2005; Wiuf and Hein, 1999; Wakeley, 2020, 2008). (2) By “genealogical bias” we refer to the fact that selective processes can systematically shift the distribution of local genealogies away from the null distribution. For example, genealogies under positive selection, selection against gene flow, adaptive introgression, and balancing selection are biased due to bursts of coalescence, faster lineage sorting, and introduction and maintenance of long branches (Guerrero et al., 2012; Barton and Etheridge, 2004; Setter et al., 2020; Speidel et al., 2019; Hejase et al., 2020; Taylor, 2013; Martin et al., 2019). On top of these, (3) randomness in the process of mutation causes additional noise in realised genetic variation (Ralph et al., 2020), which we call “mutational noise”. For example, the first and the second halves of a chromosomal interval with a single genealogy can still have slightly different patterns of genetic variation because they represent some finite numbers of different mutations.
Species-wide low-recombining regions
We showed in blackcaps that some distinct patterns of genetic variation are associated with species-wide low-recombining regions (Fig. 2). This is in line with previous studies reporting negative correlation between recombination rate and genetic differentiation (Burri et al., 2015; Burri, 2017; Delmore et al., 2015, 2018; Van Doren et al., 2017; Irwin et al., 2018; Roesti et al., 2013; Rougemont et al., 2021; Kawakami et al., 2017). To investigate what factors affect distinct patterns of genetic variation at low-recombining regions (Fig. 3) in more detail, we performed simulations of low-recombining regions with and without selection, and demonstrated that haplotype structure underlies the distinct patterns which persists only transiently until the effect of the population structure emerges (Figs. 4, 5). This transiency reflects a shift from local genetic variation primarily representing haplotype structure (Ma and Amos, 2012; Lotterhos, 2019) to that representing population structure, which can be interpreted based on the underlying genealogies. Low-recombining regions have few underlying genealogies per interval of a fixed physical length and haplotype structure at such regions tends to reflect their basal branches because basal branches tend to be longer than peripheral branches (Wakeley, 2008). At a time point soon after a population split event, peripheral branches covering more recent times than the population split harbour fewer mutations than basal branches. Therefore, the realised pattern of genetic variation at this stage has the greatest contributions by mutations on the long basal branches undifferentiated among populations (i.e., consisting standing genetic variation), representing a few ancestral haplotypes that descend the current sample. As time passes after the population split, the proportion of mutations that have occurred after the population split increases while some ancestral haplotypes can be lost by chance (i.e., drift), increasing the contribution of population structure on genetic variation. This type of distinct patterns of genetic variation arises predominantly in low-recombining regions but less so in normally recombining regions. This is because haplotype structure representing a few ancestral lineages would become less prominent with recombination as different segments of a current haplotype can follow distinct ancestries and thus the genealogical noise is effectively averaged out.
Some low-recombining regions may have genealogies with much shorter basal branches than other low-recombining regions because the variance in the basal branch length is greater than peripheral branches (Wakeley, 2008). The over-representation of a few ancestral haplotypes in genetic variation requires long basal branches in the underlying genealogies, and thus low-recombining regions with relatively short basal branches cannot accommodate sufficient mutations to represent distinct ancestral haplotypes. This decreases the relative contribution of genealogical noise compared to mutational noise (Supplementary Notes). Distinct patterns of genetic variation with varying levels of clustering of individuals in PCA in our empirical results (Supplementary Figure S6) may correspond to different ratios between genealogical and mutational noise due to large variance in the basal branch lengths of underlying genealogies. Specifically, some outlier regions with mixture of individuals from multiple populations without distinct clusters and population subdivision in PCA may have underlying genealogies with short basal branches leading to greater contributions of mutational noise on the realised genetic variation.
Population-specific low-recombining regions
We both empirically and with simulations showed that population-specific low-recombining regions exhibit distinct patterns of genetic variation in which individuals of low-recombining and normally recombining populations have different variance in genetic distances (Fig. 3C, Fig. 5). This unequal variance in low-recombining and normally recombining populations can be interpreted based on the underlying genealogies (Supplementary Figure S35). We consider the ancestry of current samples of low-recombining and normally recombining populations and split the ancestry at the time when the population-specific recombination suppression initiated (Supplementary Figure S35A). At time , there were and ancestral haplotypes that descend all current samples in low-recombining and normally recombining populations. At times older than , the ancestors of the and haplotypes may freely recombine within each set, making the genetic distances among ancestral haplotypes within each population close to equidistant (Supplementary Figure S35B). After the initiation of the population-specific reduction in recombination rate, the ancestry of one current sequence of the low-recombining population can be traced back to either one of the ancestral haplotypes present at the time (Supplementary Figure S35A). On the contrary, the ancestry of one current sequence of the normally recombining population can be traced back to multiple ancestral haplotypes of the sequences because of the presence of recombination (Supplementary Figure S35A). From the perspective of mutations, in the low-recombining population, mutations that arose on the same haplotype tend to be linked until the present time because of the suppressed recombination. On the other hand, in the normally recombining population, mutations that arose on the same ancestral haplotype less likely stay linked until the present time because recombination can dissociate them. Because shuffling of haplotypes reduces the variance of genetic distances among sequences, population-specific reduction in recombination rates leads to greater variance in low-recombining population than in normally recombining population as observed in our empirical results and simulations. In short, because of the different recombination rates between the populations, genealogical noise is more efficiently eliminated in the normally recombining population than in the low-recombining population.
The haplotype structure at population-specificlow-recombining region is only cryptic and less apparent than in species-wide low-recombining regions because other standing mutations coexist on the same haplotype, which are older than the initiation of the population-specific recombination suppression (Supplementary Figure S27). The elevated PC loadings at linked mutations originating in the low-recombining population could be informative to study evolutionary change in local recombination rate: the ages of such mutations mapped on inferred genealogies might be useful to estimate the timing at which the population-specific recombination suppression initiated.
In our empirical analyses in blackcaps, we detected the effect of population-specific reduction of recombination rate in Azores and Cape Verde island populations (Fig. 3C, Supplementary Figure S7). It remains unclear why reduced recombination rate in certain populations but not others is reflected as distinct patterns of genetic variation by lostruct. The recent split of Azores and Cape Verde populations from other populations, accompanied by reduction in population size and the level of isolation (Delmore et al., 2020) may have contributed to more efficient spread of reduced recombination rate.
Recombination landscape as a driver of evolution of local genetic variation
Species-wide and population-specific recombination suppression underlying distinct patterns of local genetic variation are probably not independent: reduction in recombination rates that initiates formation of haplotype blocks likely originates in one population and may spread to multiple populations. For example, local recombination rate may be initially reduced in one population in which a segregating inversion originates before it may spread in multiple populations by gene flow (Faria et al., 2019). In line with this view of recombination map as an evolvable trait diverging across populations according to subdivision, recent studies find that divergence in local recombination rate among populations is correlated with genetic divergence (Spence and Song, 2019; Bascón-Cardozo et al., 2022a; Roesti et al., 2013). Future work on the effects of transition from population-specific to species-wide suppression of recombination will fill the gap between the two states.
Besides spread of recombination suppression across populations, there are other paths along which patterns of local genetic variation may change over time. First, change in frequency of one haplotypic variant by drift or gene flow and selection and accumulation of novel mutations may shift the distinct pattern of genetic variation (Rubin et al., 2022). Second, an increase in recombination rate in the region may resolve the distinct pattern of genetic variation and result in emergence of the population structure, because recombination breaks down discrete haplotypes and generates mixed types whereby reducing the variance of genetic variation (Hudson, 1983). These two types of shifts in distinct patterns of genetic variation are not mutually exclusive. For example, fixation of an inversion results in elevated recombination rate (Smukowski Heil et al., 2015; Stevison et al., 2011) because there are no longer non-recombining heterozygotes in the population. Due to resumed recombination, patterns of local genetic variation in such regions are expected to reflect population structure eventually. The question of how long it takes for an outlier region with distinct patterns of genetic variation to disappear after these events should be focally studied in the future.
In Fig. 6A, we illustrate a model for the evolution of local genetic variation that changes according primarily to the evolution of local recombination rates. Local genetic variation can become distinct from the population structure first by representing emerging haplotype structure associated with population-specific recombination suppression or other types of haplotype blocks (e.g., inversions) in one population. If this recombination suppression spreads throughout all populations, then local genetic variation will start to reflect species-wide haplotype structure. Once the relative contribution of haplotype structure on local genetic variation is reduced by differentiation or disappears by elevated recombination rates, then genetic variation returns to reflect the population structure and consequently the outlier region disappears. The effect of selection on local genetic variation may be overlaid on top (Supplementary Notes 1.2).
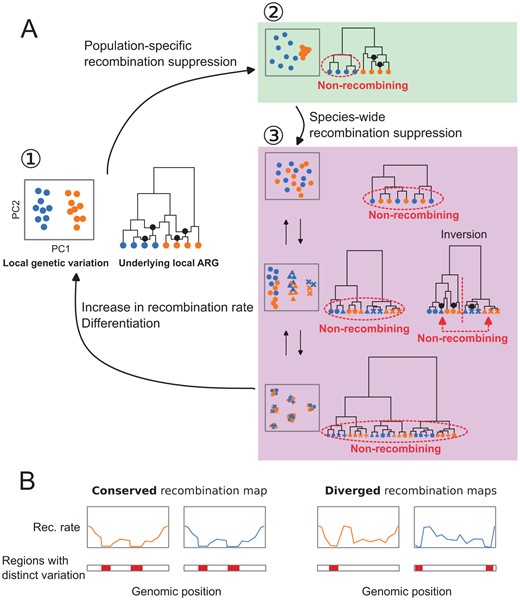
Evolutionary changes in local recombination rate influence evolution of local genetic variation. A. Local genetic variation is shown in hypothetical PCA plots. Their underlying genealogies are shown in simplified ancestral recombination graphs (ARGs,(Griffiths and Marjoram, 1997; reviewed in Lewanski et al., 2024)), on which black dots represent ancestral recombination events contributing to the sampled sequences. Points in PCA depict diploid individuals, while those on the ARGs represent haploid sequences. Two colours of these points (blue and orange) indicate two populations. (1) Local genetic variation concordant to population structure. Genetic variation shows separation of individuals from two populations. ARG shows that recombination is suppressed in neither population. (2) Population-specific recombination suppression in the blue population. ARG shows that recombination is suppressed in the blue population. (3) Species-wide recombination suppression. Top: A case in which there are few mutations representing the basal splits of the underlying genealogy at species-wide low-recombining region. Middle: A case in which there are two haplotypic variants at the species-wide low-recombining region. If this is due to presence of an inversion (right ARG), recombination is suppressed between but not within the two clades representing two alleles. Bottom: A case in which there are three haplotypic variants at the species-wide low-recombining region. B Evolution of recombination map influences difference in genomic distributions of distinct patterns of genetic variation between species/populations.
Implications
Finally, we discuss technical and biological implications of our study. The technical implication concerns interpretation of genome scans based on local genetic variation. A number of methods based on local genetic variation have been used to detect loci involved in different kinds of selective processes. For example, (differentiation), (divergence), and other population parameters are inferred to detect genomic islands of speciation (Delmore et al., 2018; Malinsky et al., 2015; Hejase et al., 2020; Huang et al., 2020). Reduced diversity () is a signature of selection (Pracana et al., 2017; Irwin et al., 2018; Delmore et al., 2018), and by combining it with variation among populations, loci associated with population-specific selection can be also inferred (Yi et al., 2010). Targets of adaptive introgression have been identified by applying statistics based on ABBA-BABA test, which is related to genetic variation (Peter, 2016, 2022), in sliding windows (Kronforst et al., 2013; Reich et al., 2009; Patterson et al., 2012; Martin et al., 2015). However, there are confounding factors that affect inference of these statistics. For example, it has been shown that low diversity can cause elevation in some of these statistics (Noor and Bennett, 2009; Cruickshank and Hahn, 2014). In addition to reduced diversity, this study and others (Lotterhos, 2019; Renaut et al., 2013; Booker et al., 2020) show that reduced recombination rate also causes distinct patterns of genetic variation which can lead to erroneous identification of regions under influence of selective factors. Examining recombination rates at identified regions and comparing them to other regions are necessary to avoid this. For instance, apparent outliers in only few (pairs of) populations at a low-recombining region may reflect high variance, while high variance at low-recombining regions alone cannot explain signals occurring in many (quasi-) independent populations or species at a low-recombining region. Furthermore, corroborating methods based on different aspects of distinct patterns of variation, such as site frequency spectrum (Tajima, 1989; Fay and Wu, 2000; DeGiorgio et al., 2016), LD (Sabeti et al., 2002, 2007; Voight et al., 2006), inferred genealogies (Hejase et al., 2020; Speidel et al., 2019; Stern et al., 2019), local landscape of variation (Setter et al., 2020), and sites of mutations in genes (Nei and Gojobori, 1986), as well as approaches with explicit simulation based on inferred demography (Hager et al., 2022), may be informative.
The biological implication is about evolution of recombination rates and genetic variation along the genome. Based on our findings of a link between these, we predict that organisms with more conserved recombination landscape along the genome may have more conserved genomic landscapes of distinct patterns of genetic variation (Fig. 6B). In other words, the more conserved recombination maps are, the more correlated genomic distribution of distinct genetic variation may be between species. In vertebrates including placental mammals (with some exceptions), recombination landscape along the genome evolves fast due to continuous turnovers of alleles of PRDM9 (the gene coding a protein that determines recombination hot spots) and its target DNA sequences (Baudat et al., 2010; Myers et al., 2008). For instance, in mammals that possess functional PRDM9, the genomic landscape of recombination rates is distinct between and even within species (Stevison et al., 2016; Spence and Song, 2019; Kong et al., 2010). Importantly, PRDM9 has been pseudogenised (Birtle and Ponting, 2006) or lost (Baker et al., 2017) independently in multiple vertebrate lineages. This shifted the determinants of recombination map from the PRDM9 allele and its target to genomic features such as CpG islands and transcription start sites, stabilising the recombination landscape (Singhal et al., 2015; Auton et al., 2013; Baker et al., 2017). Our results shown in birds, a group lacking PRDM9 (Birtle and Ponting, 2006; Singhal et al., 2015), raises a question whether the evolution of local recombination rates may play an even more important role in shaping local genetic variation in organisms with functional PRDM9. Comparative studies using taxa with and without functional PRDM9 will address this and may link the evolution of genomic landscape of distinct patterns of genetic variation and (in)stability of recombination maps.
Supplementary material
Supplementary material is available online at Evolution.
Data availability
The primary and alternate haplotype assemblies of the blackcap reference genome can be found under NCBI BioProject PRJNA558064 (accession GCA_009819655.1) and PRJNA558065 (accession GCA_009819715.1). Raw Illumina reads for the resequencing data can be accessed under NCBI BioProject PRJEB66075 (SRA accession ERP151147). Processed data and scripts for analysis and simulation are found in Zenodo (https://doi.org/10.5281/zenodo.10623362).
Author contributions
J.I. and M.L. designed the study. Reference genome was generated by J.F., A.R., J.M., B.H., W.C., J.C., K.H., M.U., O.F., and E.D.J. J.P.-T. and J.C.I. collected samples for resequencing. AB performed read mapping, variant calling, and data filtration. K.B.-C. inferred recombination maps. J.I. conducted haplotype inference, population genomics analyses, simulations, sequence analyses, statistical modelling, and data visualisation. J.I. and M.L. wrote the manuscript with inputs from other authors.
Funding
This work was supported by the Max Planck Society (Max Planck Research Group grant MFFALIMN0001 to M.L.), the DFG (project Z02 and Nav05 within SFB 1372—Magnetoreception and Navigation in Vertebrates (project 395940726) to M.L.), and DFG Research Infrastructure NGS_CC (project 407495230) as part of the Next Generation Sequencing Competence Network (project 423957469). A.R. was supported by the Intramural Research Program of the NHGRI, NIH (1ZIAHG200398). J.C.I. was funded by two research grants from the Spanish Ministry of Science, Innovation and Universities, and the European Regional Development Fund (PGC2018-097575-B-I00; PID2022-140091NB-I00).
Conflict of interest: The authors declare no conflict of interest.
Acknowledgments
We thank Britta Meyer, Tianhao Zhao, Hanna Koch, Conny Burghardt, and Sven Künzel for DNA extraction, library preparation, and/or sequencing. We are grateful to Julien Dutheil, Diethard Tautz, Linda Odenthal-Hesse, Tobias Kaiser, Carolina Peralta, and Matthias Weissensteiner for constructive discussion. We are grateful to Thord Fransson, Christos Barboutis, Zura Javakhishvili, Martim Melo, Álvaro Ramírez, and Helena Batalha for providing us with samples. Permits were provided to JCI for samples collected on Cape Verde (Ministerio do Ambiente - Habitacao e Ordenamento do Territorio, 18/CITES/DNA, 17 Dec 2015), Canary Islands (Ref.: 2012/0710), Madeira (Ref.: 02/2016), and the Azores (Instituto da Conservacao da Natureza e da Biodiversidade, 171/2008, 31 Mar 2009); to J.P.-T. for samples collected on Mallorca (CAP 64/2009); to Thord Fransson for samples collected on Crete (- issued by the Hellenic Ministry of Environment and Energy), and to Zura Javakhishvili for samples collected in Georgia (889-0-2-202303291450 by the Ministry of Environment and Agriculture of Georgia). A preprint version of this article has been peer-reviewed and recommended by PCIEvolBiol (https://doi.org/10.24072/pci.evolbiol.100711).
