


Abstract
Multigene families are essential components of eukaryotic genomes and play key roles either structurally and functionally. Their modes of evolution remain elusive even in the era of genomics, because multiple multigene family sequences coexist in genomes, particularly in large repetitive genomes. Here, we investigate how the multigene families 18S rDNA, U2 snDNA, and H3 histone evolved in 10 species of Schistocerca grasshoppers with very large and repeat-enriched genomes. Using sequenced genomes and fluorescence in situ hybridization mapping, we find substantial differences between species, including the number of chromosomal clusters, changes in sequence abundance and nucleotide composition, pseudogenization, and association with transposable elements (TEs). The intragenomic analysis of Schistocerca gregaria using long-read sequencing and genome assembly unveils conservation for H3 histone and recurrent pseudogenization for 18S rDNA and U2 snDNA, likely promoted by association with TEs and sequence truncation. Remarkably, TEs were frequently associated with truncated copies, were also among the most abundant in the genome, and revealed signatures of recent activity. Our findings suggest a combined effect of concerted and birth-and-death models driving the evolution of multigene families in Schistocerca over the last 8 million years, and the occurrence of intra- and interchromosomal rearrangements shaping their chromosomal distribution. Despite the conserved karyotype in Schistocerca, our analysis highlights the extensive reorganization of repetitive DNAs in Schistocerca, contributing to the advance of comparative genomics for this important grasshopper genus.
Multigene families are groups of genes derived from a common ancestral gene by duplication, which are therefore usually clustered in specific genomic regions and share high sequence homology and functional properties (Tachida and Kuboyama 1998; Nei and Rooney 2005; Eirin-Lopez et al. 2012; Pervaiz et al. 2019). Studies in several organisms revealed that multigene family sequences are highly conserved across long evolutionary time scales. However, also some of them have exhibited an extraordinary intragenomic diversification, including spread and pseudogenization (Nei and Rooney 2005). Given their conspicuous characteristics, the mode of evolution and mechanisms shaping the diversity, structure, and organization of multigene families are topics of sustained interest in evolutionary biology, and have been subject matter of discussion during the last decades (Nei and Rooney 2005; Eirin-Lopez et al. 2012). Two processes were proposed to be driving the evolution of multigene families, known as concerted and birth-and-death evolution (reviewed in Eirin-Lopez et al. 2012). Concerted evolution is a process in which members of the same gene family evolve in a concerted manner, resulting in the homogenization of units (Dover 1982; Ugarkovic and Plohl 2002; Eickbush and Eickbush 2007; Plohl et al. 2008; Garrido-Ramos 2017). The main molecular mechanisms involved in this process are gene conversion and unequal crossing over (Smith 1976; Walsh 1987; Dover 2002; Shi et al. 2010). Birth-and-death evolution is a process in which new sequences are generated by gene duplication, and could either persist in the genome for long periods or be lost by unequal crossing over. Persisting copies may then suffer divergence by mutations and sub- or neofunctionalization, or pseudogenization (Hughes and Nei 1992; Nei and Rooney 2005; Eirin-Lopez et al. 2012). Recent studies suggested a mixed effect of concerted and birth-and-death evolution to be involved in some multigene families dynamics (Mount et al. 2007; Freire et al. 2010; Pinhal et al. 2011; Merlo et al. 2012; Bardella and Cabral-de-Mello 2018; Zhang et al. 2021).
The nuclear ribosomal DNAs (rDNAs), small nuclear DNAs (snDNA), and histones are multigene families that present a relatively high number of copies that are tandemly arranged in one or more discrete clusters. This feature turned some of these sequences to be suitable for chromosomal mapping techniques, and therefore were extensively used for disentangling their genomic organization and karyotype evolution (Cabral-de-Mello et al. 2011a; Nguyen et al. 2010; Garcia-Souto et al. 2018; Mazzoleni et al. 2018; Anjos et al. 2019; Degrandi et al. 2020). In eukaryotes, the rDNA genes are indispensable structural and catalytic components of the ribosome, and are organized into two distinct multigene families comprising the so-called 45S (28/26S, 18S, and 5.8S, spliced from a single precursor) and 5S rDNA repeats (Long and Dawin 1980; Gibbons et al. 2015). Despite their relative sequence conservation and central role in cell metabolism, rDNA genes presented high rates of molecular and chromosomal diversification over short time scales in some species (Cabrero et al. 2003; Datson and Murray 2006; Ferretti et al. 2019). The histone multigene family encodes small basic proteins that represent the major constituents of chromatin and are involved in vital processes such as DNA packaging and expression thought their post-translational modifications (van Holde 1988; Jenuwein and Allis 2001). The U small nuclear RNA gene family encodes crucial components of the spliceosome, a large ribonucleoprotein complex implicated in intron removal from pre-mRNA, essential to the mechanism of RNA maturation (Will and Luhrmann 2011). Compared to rDNA genes, H3 histone gene and U2 snDNAs are less repetitive (i.e., moderately repetitive sequences) and present shorter functional sequences (∼180–400 bp). These multigene families have less signatures of genome dynamism, rarely spreading to multiple chromosomal clusters (Cabrero et al. 2009; Cabral-de-Mello et al. 2012).
Among grasshoppers, studies on the major rDNA (Cabrero and Camacho 2008), H3/H4 histones (Cabrero et al. 2009), and U1 snDNA (Anjos et al. 2015) sequences have been informative for understanding their chromosomal evolution and to the lesser extent the molecular dynamics of these sequences (Teruel et al. 2014; Anjos et al. 2015; Ferretti et al. 2019). The 45S rDNA is highly dynamic in number and size of chromosomal loci, due to translocations and inversions, ectopic recombination, and transposition followed by either amplification or deletion (Cabrero and Camacho 2008; Ferretti et al. 2019). The U1 snDNA could be also highly dynamic in some groups, and its spread might be related to the action of transposable elements (TEs) (Anjos et al. 2015). For both types of sequences, the occurrence of pseudogenes suggests birth-and-death mode of evolution (Anjos et al. 2015; Ferretti et al. 2019). On the contrary, the histone clusters are highly conserved in grasshoppers, primarily located near the centromere of a medium-size chromosome, the pair 8. In Gomphocerinae grasshoppers, the deviation of this pattern is associated to a chromosomal rearrangement in the ancestor of the group (Cabrero et al. 2009).
The grasshopper genus Schistocerca (Orthoptera: Acrididae: Cyrtacanthacridinae) is represented by about 50 species mainly distributed in the New World (North, Central, and South America). The only species inhabiting in the Old World (Africa and the Middle East) is Schistocerca gregaria (SGRE), which is the earliest diverging lineage, suggesting the Old World origin for the genus, a hypothesis supported by molecular data and phylogenetic reconstruction (Song et al. 2017). Some Schistocerca species are known as locusts, capable of forming dense migrating swarms through an extreme form of density-dependent phenotypic plasticity called locust phase polyphenism (Pener 1983; Simpson and Sword 2009), as reported in SGRE (desert locust), Schistocerca piceifrons (Central American locust), and Schistocerca cancellata (South American locust) (Harvey 1980; Song et al. 2017).
The karyotypes of 11 species of Schistocerca have been studied so far, with occurrence of 2n = 23, XO, and acro-telocentric chromosomes (Palacios-Gimenez et al. 2020a; Mesa et al. 1982; Camacho et al. 2015). The molecular composition of chromosomes of Schistocerca was addressed in detail for SGRE, revealing the occurrence of high number of repetitive DNAs (Camacho et al. 2015). More recently, a study in a phylogenetic framework analyzing 10 species of Schistocerca revealed that three satellite DNAs (satDNAs) were conserved in the genus and experienced quantitative changes during its diversification (Palacios-Gimenez et al. 2020a). Multigene families were mapped in a limited number of species, for example, 18S and 5S rDNAs, H3 histone gene and U1 and U2 snDNA in SGRE (Camacho et al. 2015), and 18S rDNA in Schistocerca pallens and Schistocerca flavofasciata (de Souza and de Melo 2007). These collectively suggest that the data that could be relevant for understanding karyotype and genome evolution in Schistocerca are currently scarce. Moreover, grasshoppers represent the largest genome-containing species among insects, and the availability of new sequencing technologies and recent efforts gathering genomic data in some of its representatives raises the possibility of studying repetitive DNA evolution in species with huge genomes (Palacios-Gimenez et al. 2020b; Wang et al. 2014; Verlinden et al. 2020; Hotaling et al. 2021). The overreaching aim of this study is thus to understand the chromosomal and molecular evolution of multigene families over the last 7.9 million years since Schistocerca diverged (Song et al. 2017), and to contribute to the knowledge about the genome biology of this important genus. To achieve this aim, we integrated phylogenetic, genomic, and chromosomal information of 18S rDNA, U2 snDNA, and H3 histone genes in 10 Schistocerca species, which allowed us to propose putative changes involved in karyotype and molecular evolution of multigene families. Our analyses revealed an extensive sequence turnover, truncation, and chromosomal repatterning in 18S rDNA and U2 snDNA, likely driven by chromosomal rearrangements and association with TEs. Conversely, the H3 histone gene remained more conserved, as previously observed in other grasshoppers.
Material and Methods
ANIMALS AND CHROMOSOME PREPARATIONS
For chromosomal analysis, we used male adult grasshoppers of eight Schistocerca species collected in distinct regions of America: Rio Claro/Brazil, S. pallens (SPAL) and S. flavofasciata (SFLA); Florida/USA, S. serialis cubense (SSEC), S. americana (SAME), S. damnifica (SDAM), S. ceratiola (SCER), and S. rubiginosa (SRUB); St. John/US Virgin Islands, S. caribbeana (SCAR). For SGRE, the chromosomal distribution of multigene families was obtained from Camacho et al. (2015). Additionally, we studied the chromosomes of Anacridium aegyptium collected in Granada/Spain as an outgroup for Schistocerca. The animals were anesthetized for dissection of testes that were fixed in Carnoy's solution (3:1, ethanol 100%:glacial acetic acid) and stored at −20°C.
For obtaining the chromosome preparations, testes were macerated and spread under a glass slide using a drop of 60% glacial acetic acid. The acetic acid was evaporated using a hot plate at 45°C and the slides were dehydrated in ethanol series (70%, 85% ,and 100%), 2 min each and stored at −20°C until being used.
DNA SEQUENCING AND BIOINFORMATICS ANALYSES OF MULTIGENE FAMILIES
Genomic DNA sequencing libraries of Schistocerca species were previously obtained from Song et al. (2017) and were deposited in Sequence Reads Archieve under BioProject PRJNA728796. The quality of paired-end Illumina reads was assessed with FASTQC (Andrews 2010), and quality filtering and pre-processing were conducted with Trimmomatic 0.39 (Bolger et al. 2014). To retrieve the complete sequences of multigene families of Schistocerca genomes, we performed de novo assembly using NOVOPlasty 4.2.1 (Dierckxsens et al. 2017) with a k-mer size of 31, and using 18S rDNA (accession number MW308150), U2 snDNA (accession number KC896794.1), and H3 histone gene (accession number KC896792.1) of Abracris flavolineata as seeds. The relative abundance and Kimura-2-parameter (K2P) divergence of 18 rDNA, U2 snDNA, and H3 histone sequences were estimated individually in each Schistocerca species by aligning the sequencing reads with RepeatMasker 4.0.9 (Smit et al. 2015), and parsing the align files to the script calcDivergenceFromAlign.pl from RepeatMasker utils. Sequence abundance in each species was estimated as the proportion of nucleotides aligned with the reference sequence (e.g., 18S rDNA, U2 snDNA, and H3 histone) with respect to the total Illumina library size. We further explored the patterns of intragenomic diversity and sequence truncation of each multigene family with the RepeatProfiler pipeline (Negm et al. 2021). This tool automates the generation and visualization of read coverage profiles and sequence variation across the consensus sequence by short-read mapping.
Phylogenetic relationships between species (clades) were defined by Palacios-Gimenez et al. (2020a) based on the phylogeny from Song et al. (2017) as follows: clade 1 (SFLA and SCAR), clade 2 (SPAL), clade 3 (SSEC and SAME), and clade 4 (SDAM, SCER, and SRUB). To visualize the mutational steps of the genes between Schistocerca species, we performed multiple sequence alignments of the consensus sequences with MUSCLE (Edgar 2004), estimated the pairwise distances (p-distance) within and between clades for each multigene family, and calculated the dN/dS ratio in H3 histone with MEGA (Kumar et al. 2018). To determine the phylogenetic relationships of the analyzed multigene families, different evolutionary models were first assessed for the dataset using jModelTest version 2.4 (Darriba et al. 2012), and then the best-fit model was selected on the basis of Akaike's information criterion (AIC) (Akaike 1973). Finally, we performed a maximum likelihood analysis using phyML (Guindon et al. 2010; Lefort et al. 2017) with 1000 bootstrap replicates.
ASSESSING THE REPEATED DNA COMPOSITION OF SCHISTOCERCA SPECIES
To estimate the TE composition across Schistocerca species, we analyzed the Illumina short-read sequencing data using dnaPipeTE (Goubert et al. 2015). DnaPipeTE performs de novo assembly of a low-coverage short-read sample with Trinity (Grabherr et al. 2011), followed by an automatized homology-based annotation and contig quantification. The tool also provides divergence values among the different copies of each element, thus allowing the identification of recently active repeats elements. To do so, we also plotted abundance versus divergence landscapes of the most abundant TEs in SGRE genome.
ANALYSIS OF MULTIGENE FAMILIES IN PacBio READS AND GENOME ASSEMBLY OF SGRE
We used the recently assembled genome of SGRE (Verlinden et al. 2020) deposited at Online Resources for Community Annotation of Eukaryotes (Orcae, https://bioinformatics.psb.ugent.be/orcae/overview/Schgr, last accessed September 8, 2020; Sterck et al. 2012) and the PacBio raw reads (ENA Accession numbers: ERR4426553, ERR4426554, ERR4426572, and ERR4436567–ERR4436569) to further analyze the genome organization and to evaluate the possible association of multigene families and TEs. PacBio libraries were corrected with proovread 2.14.0 (Hackl et al. 2014). Consensus sequences of 18S rDNA, U2 snDNA, and H3 histone were first aligned back to the genome assembly using BLASTN (Altschul et al. 1997) and extended by 5-kb up- and downstream to check sequences of the flanking regions. We applied the same approach using the PacBio raw reads. This step was performed because repetitive sequences are usually misrepresented in genome assemblies (Palacios-Gimenez et al. 2020b; Peona et al. 2018; Peona et al. 2020). The BLASTN hits with and without 5-kb flanking regions were collected by combining a custom awk command line and BEDTools (Quinlan and Hall 2010). To test if multigene families were preferentially associated with TEs, we performed a final BLASTN search using the copies of the multigene families recovered in the previous steps against a combined TE library containing consensus sequences of the grasshoppers SGRE, Vandiemenella viatica (Palacios-Gimenez et al. 2020b) plus Arthropoda RepBase (Bao et al. 2015). We then used a series of discriminant filters implemented in a R custom script to filter out sequences that were placed closer than 1 kb from either of scaffold/read ends. Plots of copy number representativeness of multigene families in the genome assembly and PacBio reads were obtained with the consensus2genome.R script (https://github.com/clemgoub/consensus2genome).
STATISTICAL ANALYSIS
We performed correlation analyses between relative sequence abundance versus K2P sequence divergence, sequence abundance versus locus number, and sequence divergence versus loci number of each multigene family detected by fluorescence in situ hybridization (FISH) (see below) in each species. Based on the results of the Shapiro test, we selected a correlation analysis as either the Pearson or the Spearman tests for normal or non-normal distribution of data, respectively. Statistical analyses were run in R 3.5.1 (R Core Team). The substitution rates (base substitutions per mya) for each multigene family in each species were estimated dividing the interspecific p-distances with respect to SGRE by twice the time since the radiation (15.8 mya).
PROBES AND CHROMOSOMAL MAPPING
We used the same individuals previously studied by Palacios-Gimenez et al. (2020a) for the FISH analysis, and the karyotypes of eight species were 2n = 23, XO, and acro-telocentric chromosomes, that is, the ancestral and modal for Acrididae grasshoppers (White 1973; Mesa et al. 1982). Chromosomes were classified into three groups according to their size: Large (L, L1–L3), Medium (M, M4–M8), and Small (S, S9–S11). The X chromosome has a similar size to the large autosomes.
The genomic DNA of the grasshopper A. flavolineata was extracted through Phenol:Chloroform method (Russell and Sambrook 2001). It was used as a source for obtaining the U2 snDNA and H3 histone sequences by PCR using the primers published by Bueno et al. (2013) and Colgan et al. (1999), respectively. The 18S rDNA was obtained from a cloned fragment previously isolated from the beetle Dichotomius semisquamosus (Cabral-de-Mello et al. 2011b). The mapped TEs were amplified using specific primers as follows: Daphne-4 (F: TTTATCGGGAACCTGATGCAA, R: AGCACTATCTGTTGAAACACC), Mariner-7 (F: GTTCTACGTTCGAGCAAAGG, R: ACCTCCTCCAATCTACTAGG), Penelope-111 (F: GACTAAAGTCACTTCGGCTC, R: CTTTCATGTACTGTGCGCGT), and SINE2-3 (F: GTTCCGTCAACAAGGTCATTA, R: ATTGTGTGACTACCGAGCGA). Sequences were labeled by PCR or Nick-Translation with Biotin-14-dATP (Invitrogen, San Diego, CA, USA) or Digoxinenin-11-dUTP (Roche, Mannheim, Germany) to be used as probes in FISH experiments. These probes have been used for a while in our lab in grasshoppers and the sequences are deposited in GenBank under the accession numbers GQ443313 (18S rDNA), KC896794 (U2 snDNA), and KC896792 (H3 histone gene).
Single- or two-color FISH was performed following the adaptations proposed by Cabral-de-Mello et al. (2011a). The probes labeled with Digoxinenin-11-dUTP were detected using anti-digoxigenin rhodamine (Roche), and probes labeled with Biotin-14-dATP were detected using Streptavidin, Alexa fluor 488 conjugate (Invitrogen). Chromosomes were counterstained using 4′,6-diamidine-2′- phenylindole dihydrochloride and mounted using VECTASHIELD (Vector, Burlingame, CA, USA).
Results
INTRA- AND INTERSPECIFIC MOLECULAR ANALYSIS OF MULTIGENE FAMILIES
By using NOVOplasty, we obtained the sequences of 18S rDNA, U2 snDNA, and H3 histone from the Schistocerca genomes. We summarized the main characteristics of these multigene families including relative sequence abundance and sequence divergence (K2P) in Table 1. The estimated average genome abundance of each multigene family in the libraries was higher for 18S rDNA (0.047%, from 0.029% to 0.086%) in comparison to H3 histone (0.004%, from 0.002% to 0.008%) and U2 snDNA (0.003%, from 0.002% to 0.005%). Average K2P values varied from 0.18% to 1.13% (SPAL) for 18S rDNA, from 7.83% to 12.49% (SDAM) for U2 snDNA, and from 0.19% to 3.21% (SCAR) for H3 histone gene (Table 1). We observed a significant negative correlation between sequence abundance and divergence values for U2 snDNA (Spearman's rank correlation test, ρ = −0.71, P = 0.03) indicating that recent copy gene amplification or homogenization events were accompanied by a decrease in sequence divergence. On the other hand, these correlations were not significant for 18S rDNA and H3 histone gene (P > 0.05; Fig. S1A).
Main attributes including sequence abundance, sequence divergence, and number of chromosomal clusters for the three multigene families studied here for the nine Schistocerca species
| 18S rDNA | U2 snDNA | H3 histone | |||||||
|---|---|---|---|---|---|---|---|---|---|
| Species | Abundance (%) | Divergence (%) | Cluster number | Abundance (%) | Divergence (%) | Cluster number | Abundance (%) | Divergence (%) | Cluster number |
| SGRE | 0.08635 | 0.18 | 2 | 0.00308 | 9.43 | 1 | 0.00265 | 0.19 | 1 |
| SFLA | 0.03410 | 0.99 | 1 | 0.00351 | 11.01 | 1 | 0.00338 | 2.61 | 1 |
| SCAR | 0.04294 | 1.04 | 1 | 0.00324 | 13.73 | 1 | 0.00191 | 3.21 | 1 |
| SPAL | 0.05371 | 1.13 | 2 | 0.00283 | 13.69 | 1 | 0.00409 | 1.71 | 1 |
| SSEC | 0.05801 | 1.08 | 2 | 0.00381 | 10.19 | 1 | 0.00754 | 1.97 | 1 |
| SAME | 0.04516 | 1.06 | 2 | 0.00235 | 11.76 | 2 | 0.00350 | 2.04 | 1 |
| SDAM | 0.04014 | 1.06 | 1 | 0.00301 | 12.49 | 1 | 0.00280 | 2.00 | 1 |
| SCER | 0.03297 | 0.49 | 1 | 0.00380 | 9.02 | 2 | 0.00304 | 1.99 | 1 |
| SRUB | 0.02933 | 0.99 | 1 | 0.00473 | 7.83 | 2 | 0.00334 | 2.60 | 1 |
| Mean | 0.04697 | 0.89 | 1.44 | 0.00337 | 11.01 | 1.33 | 0.00358 | 2.03 | 1 |
| SD | 0.00017 | 0.33 | 0.52 | 6.8961 × 10⁻⁶ | 2.08 | 0.5 | 1.6040 × 10⁻⁵ | 0.83 | 0 |
| CV | 37.31 | 36.75 | 36.60 | 20.44 | 18.87 | 37.59 | 44.75 | 40.90 | 0 |
SD = standard deviation; CV = coefficient of variation.
The p-distances of multigene families estimated by pairwise comparisons between consensus sequences are summarized in Table S1. The 18S rDNA and H3 histone gene families showed a similar trend, for example, lower p-distance within clades rather than between them (Table S2). The U2 snDNA gene showed no differences in the values of p-distances within and between clades 1–3, except for clade 4 in comparison to the first three clades and SGRE (Table S2). The substitution rates estimated from the interspecific p-distances were 0.06% (base substitutions per my) for H3 histone gene, 0.024% for U2 snDNA, and 0.014% for 18S rDNA. The so-called variant-enhanced profiles depicted coverage-depth patterns consistent with the presence of spread truncated copies in Schistocerca genomes, but also the presence of low-frequency variants that deviate from the functional copy (i.e., consensus sequence) due to several nucleotide substitutions (Fig. 1A). The H3 histone presented either most homogeneous coverage-depth profiles or less frequent sequence variants than the rDNA and U2 snDNA genes, suggesting a stronger functional constraint and less tolerance to alterations. Moreover, the dN/dS ratio evidenced purifying selection (ω = 0.15) on this gene family.
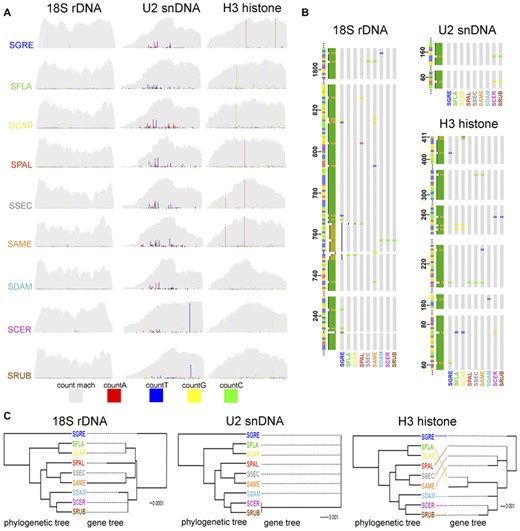
(A) Coverage profiles for the multigene families from Schistocerca species (light gray). The intragenomic variation of each gene is showed as color-coded substitutions from the consensus sequences. (B) Alignment of consensus sequences for the three multigene families of Schistocerca species. Only the regions containing mutations were selected and are showed. (C) Comparison between the simplified time-scaled phylogeny based on Song et al. (2017) and unrooted maximum likelihood trees for the tree multigene families for the Schistocerca species studied here.
The multiple alignment of multigene families’ consensus sequences from the nine Schistocerca species revealed that sequence variations in H3 histone (13 mutations) and U2 snDNA (2 mutations) were due to nucleotide substitutions, whereas in 18S rDNA, indels (20 mutations) were more frequent than substitutions (18 mutations) (Fig. 1B). The general trend observed for 18S rDNA by comparison of gene trees and the species phylogenetic tree was that putative ancestral mutations occurred within clades rather than between clades. For 18S rDNA, the gene tree had the same topology as the species tree. As most species shared the same haplotype, the gene tree for U2 snDNA had a polytomy, where only SCER and SRUB were in a different branch, due to occurrence of two mutations in the common ancestor. Finally, for the H3 histone gene we noticed congruences between species tree and gene tree for species in clade 4 (SDAM, SCER, and SRUB) and incongruences for species in clade 1 (SFLA and SCAR), clade 2 (SPAL), and clade 3 (SSEC and SAME) (Fig. 1C).
TEs IN THE GENOMES OF SCHISTOCERCA
The analysis using dnaPipeTE allowed the estimation of abundance and divergence values for the most representative TE groups across the different Schistocerca species. The repetitive landscape showed high amount of repetitive DNA content in all species. Particularly, the TE fraction was the most representative, spanning from 36.7% (SGRE) to 46.8% (SCER) of the genome. The relative contribution of different TE classes was similar across all genomes, being DNA TEs the most representative (Mean = 13.4%), followed by Helitron (Mean = 11.5%), LINE (Mean = 10.4%), and the least represented LTR (Mean = 4.5%) and SINE (Mean = 0.4%) classes (Fig. S2). We also checked for the consensus and TE superfamilies frequently associated with the multigene families in the genome of SGRE (Table S4) and this seems to be a common feature; they all represent abundant and low diverged (i.e., with signatures of recent activity) components across the Schistocerca phylogeny.
GENOME ANALYSIS IN SGRE REVEALS ASSOCIATION OF MULTIGENE FAMILIES AND TEs
The BLASTN search against the genome assembly retrieved a total of 167, 122, and 69 copies of 18S rDNA, U2 snDNA, and H3 histone, respectively. Out of these, the degenerated or truncated copies were 163 (97.6%) for 18S rDNA, 115 for U2 snDNA (94.2%), and 49 (71%) for H3 (Fig. 2A). The analysis of flanking regions of the multigene families revealed considerably more hits against distinct TEs in 18S rDNA (78.4%) and U2 snDNA (96.7%) than in H3 (59.4%) (Fig. 2B, C; Table S3), spread across 68, 76, and 20 scaffolds, respectively. Generally, the TEs most frequently associated with multigene families were LINEs (CR1, RTE-BovB, L2, I-Jockey, R1), SINEs (SGRP1), and DNA (TcMar-Tc1) (Table S3). Interestingly, some of the TE families found to be associated with the truncated copies of multigene families were also among the most abundant repetitive components in the genome (Table S4). Given that the genomic analysis was carried out only in SGRE, we also constructed the so-called repetitive landscapes for these TE superfamilies using dnaPipeTE outputs of this species, and all of them showed signals of recent activity, with maximum abundance peaks within 5% divergence values (Fig. 2E). The chromosomal mapping of four TEs, that is, Daphne-4, SINE2-3, Penelope-111, and Mariner-7, revealed enrichment of these repeats on chromosomal arm, with evident impoverishment (no FISH signals) on pericentromeric heterochromatin (Fig. 2D).
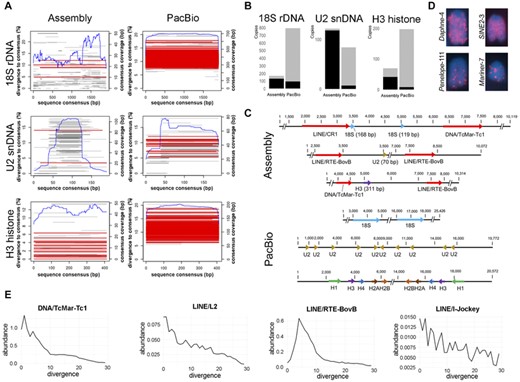
Genomic organization and evolution of multigene families and related sequences (TEs) in the genome of Schistocerca gregaria. (A) Multigene copy occurrence and their completeness in the genome assembly and PacBio raw reads. Red and gray bars represent complete (i.e., spanning at least 90% of the consensus) and truncated sequences, respectively. The blue line depicts the coverage along the consensus sequence. (B) Bar plot representing the proportion of multigene family copies associated with TE within 5-kb up- and downstream flanking sequences in the genome assembly and PacBio raw reads. Black and gray bars show TE association and lack of TE sequences associated with the multigene family copies, respectively. (C) Most common genomic organization of the 18S rDNA, U2 snDNA, and H3 histone in the genome assembly and PacBio libraries. (D) Selected chromosomes showing the distribution of some TEs. Observe enrichment in the chromosomal arm and impoverishment in centromeric region. (E) Sequence abundance versus divergence landscapes of the TE superfamilies most frequently related to multigene families. Note the peak in low divergence values, indicating recent activity.
Given the skewed representativeness of functional copies in genome assemblies, we also queried the multigene families in PacBio reads. This is because the genomic organization of multigene families, which usually encompass large arrays of tandem repeats that hampers the assembly process due to the collapse of the arrays and genome fragmentation (Nei and Rooney 2005; Mentewab et al. 2011; Dyomin et al. 2019; Peona et al. 2020). The BLASTN searches in the PacBio reads retrieved 792, 83, and 207 copies of 18S rDNA, U2 snDNA, and H3 histone, respectively (Fig. 2A). These sequences were much more complete than those retrieved from the genome assembly, showing 191 (24.1%), 66 (79.5%), and 36 (17.4%) truncated copies in 18S rDNA, U2 snDNA, and H3 histone, respectively. In addition, the copies retrieved from the PacBio raw reads showed a significantly lesser association with TE (P < 2.2 × 10⁻¹⁶, Fisher's exact test) (Fig. 2C; Table S3). Overall, the result showed that multigene families were better represented and less fragmented in the sequenced PacBio raw reads than in the assembled genome. Thus, this analysis proved essential to characterize the structure exhibited by these repeats, revealing the characteristic tandem organization, mostly free of TEs. None of the multigene families were associated each other (Fig. 2C).
CHROMOSOMAL LOCATION OF MULTIGENE FAMILIES
The three multigene families mapped through FISH revealed distinct patterns of chromosomal location between species depending on the sequence. In the outgroup A. aegyptium, the 18S rDNA was located interstitially on the chromosome L3 (near the terminal region) and another cluster was observed near the centromere of chromosome M6 (Fig. 3A; Table 2). In SGRE (Camacho et al. 2015), SPAL, SSEC, and SAME, the 18S rDNA was located interstitially on the chromosomes L3 and M6 (Fig. 3C, E; Table 2). In the other Schistocerca species (SFLA, SCAR, SDAM, SCER, and SRUB), the 18S rDNA was restricted to interstitial position of the chromosome M6 (Fig. 3D, F; Table 2). The average locus number per haploid genome was 1.44 for 18S rDNA (Table 2).
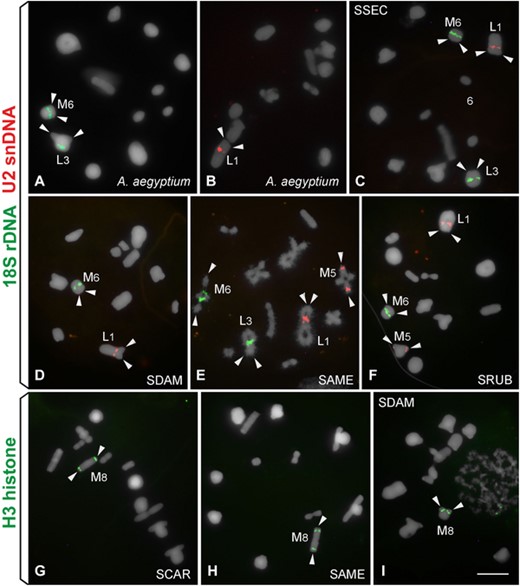
FISH mapping of the three multigene families in (A and B) Anacridium aegyptium and (C–I) Schistocerca species. (A–F) 18S rDNA (green) and U2 snDNA (red); (G–I) H3 histone. (A and E) diplotene and (B–D and F–I) metaphase I. (C) SSEC. (D) SDAM. (E) SAME. (F) SRUB. (G) SCAR. (H) SAME. (I) SDAM. Bar = 5 μm.
Chromosome location of the three multigene families mapped on Schistocerca and in the sister species Anacridium aegyptium
| Chromosomal location | ||||
|---|---|---|---|---|
| Species | 18S rDNA | U2 snDNA | H3 histone | References |
| A. aegyptium | L3, M6 | L1 | M8* | This work, *Cabrero et al. (2009) |
| SGRE | L3, M6 | L1 | M8 | Camacho et al. (2015) |
| SFLA | M6 | L1 | M8 | This work |
| SCAR | M6 | L1 | M8 | This work |
| SPAL | L3, M6 | L1 | M8 | This work |
| SSEC | L3, M6 | L1 | M8 | This work |
| SAME | L3, M6 | L1, M5 | M8 | This work |
| SDAM | M6 | L1 | M8 | This work |
| SCER | M6 | L1, M5 | M8 | This work |
| SRUB | M6 | L1, M5 | M8 | This work |
The numbers indicated the chromosome according to karyotype rank size. L = large chromosome; M = medium chromosome.
We observed one interstitial cluster of U2 snDNA on chromosome L1 in all of the analyzed species (Fig. 3B–F; Table 2). In SAME, SCER, and SRUB, we found evidence for an extra proximal cluster near the centromere of M5 (Fig. 3E, F; Table 2). The average locus number of U2 snDNA per species was 1.33 per haploid genome (Table 2). The H3 histone gene was placed proximal to the centromere of the chromosome M8 in all of the analyzed species (Fig. 3G–I; Table 2). The average loci number of this gene per haploid genome was 1 in each species (Table 2).
We observed a positive correlation between the number of loci and relative sequence abundance for the 18S rDNA (Spearman's test, ρ = 0.86, P = 0.003). There was no significant correlation between loci number and sequence abundance for U2 snDNA and H3 histone gene, nor between loci number and sequence divergence for the three analyzed genes (Fig. S1B, C).
To understand the evolution of the multigene families at the chromosomal level, we analyzed the FISH data in the phylogenetic context. The data revealed either the occurrence of putative chromosomal inversions, transpositions, or cluster deletion for 18S rDNA. For U2 snDNA, we observed either cluster addition or deletion along the species tree. The H3 histone was conserved through the phylogeny of the genus, as no variation in cluster number or chromosomal position was noticed (Fig. 4A).
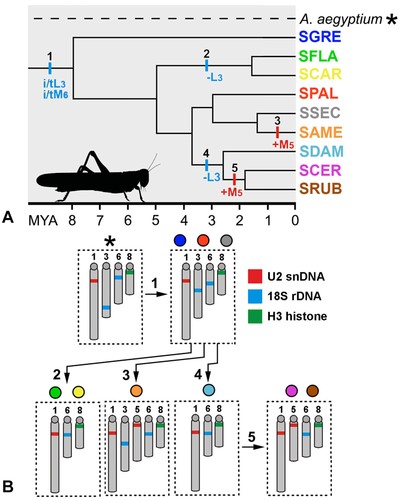
(A) Simplified dated phylogeny for the Schistocerca species studied here based on Song et al. (2017) with chromosomal rearrangements plotted. The chromosomal transformations are indicated by colored lines and the colored letters and numbers indicate the specific events and chromosome involved in the rearrangements, i/t = inversion/transposition; – = deletion; and + = addition. The black numbers indicate the modifications detailed in (B) that generated differences between species. (B) Ideograms showing the distribution of the three multigene families in the chromosomes of Schistocerca species and Anacridium aegyptium as an outgroup. 1: inversion or transposition causing modification in the position of 18S rDNA cluster in chromosomes L3 and M6; 2: deletion of 18S rDNA cluster in chromosome L3; 3: addition of U2 snDNA cluster in chromosome M5; 4: deletion of 18S rDNA cluster in chromosome L3; 5: addition of U2 snDNA cluster in chromosome M5. Note that the deletion of 18S rDNA in chromosome L3 occurred two times independently, as the addition of U2 snDNA in chromosome M5. In panel A, the species are showed in colors that correspond to circles showed in panel B.
Discussion
MIXED MODEL OF CONCERTED EVOLUTION AND BIRTH-AND-DEATH EVOLUTION OF MULTIGENE FAMILIES IN SCHISTOCERCA
The evolution of tandemly repeated multigene families such as 18S rRNA, U2 snRNA, and H3 histone is intriguing because in each species the arrays are highly uniform in sequence but that relative sequence abundance and chromosomal position differ between species. Different evolutionary processes may cause sequence amplification and divergence of tandemly organized multigene families (Fig. 5). We should first consider that the interspecific sequence conservation (by comparison of consensus sequences) could be influenced by functionality of the copies conforming the chromosomal clusters. This was particularly evident for H3 histone gene, in which we noted similar sequence abundance and identical number of chromosomal clusters among Schistocerca species. The stasis of H3 histone gene can be interpreted as a consequence of purifying selection (Nei and Rooney 2005) occurring in this gene as suggested by our synonymous versus nonsynonymous test, and was previously observed in other insects (Cabral-de-Mello et al. 2011a; Mandrioli and Manicardi 2013; Šíchová et al. 2013; Anjos et al. 2018), including grasshoppers (Cabrero et al. 2009) concerning number of chromosomal clusters.
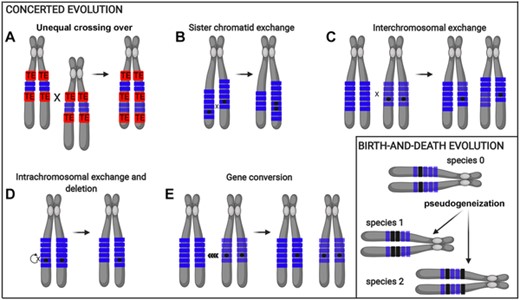
Distinct evolutionary mechanisms may drive the accumulation and divergence of tandemly organized multigene families, putatively operating in Schistocerca genomes. The panel concerted evolution (A–E) shows the five possible recombination mechanisms that may occur within or between tandemly organized multigene families. All five recombination mechanisms can lead to the duplication or loss of a mutation on a chromosome. The crossing over events (A–D) can lead to changes in the number of tandemly organized units on a chromosome, whereas gene conversion (E) will not unless a crossing over also occurs. The different shades of blue rectangles stand for the maternal and paternal chromosomal loci, and the black dots denote mutation in the array. Red boxes stand for transposable element (TE). The birth-and-death evolution panel highlights the pseudogenization process of tandemly organized multigene families across species. Blue rectangles stand for functional genes and black rectangles for pseudogenes.
The low intraspecific molecular divergence observed for the 18S rDNA and H3 histone in the genomes of all Schistocerca species could be attributed to the concerted evolution operating intracluster within chromosomes, likely promoted by nonreciprocal transfer of DNA sequences between two genes (gene conversion) or unequal crossing over (Eickbush and Eickbush 2007). Interestingly, an opposite trend was noted for U2 snDNA, which showed higher levels of intraspecific divergence while being highly conservative between species. This is likely the outcome of the interaction between selective constraints maintaining the nucleotide composition in the main clusters due to its functionality, and the recurrent effects of mechanisms promoting intragenomic diversification (e.g., ectopic recombination and pseudogenization).
Our findings using PacBio raw reads and genome assembly showed that multigene families were associated with TEs. We also showed that TEs were pervasive among Schistocerca species, and most families related to the truncated copies of multigene families were abundant and displayed signatures of recent activity. Therefore, the presence of several truncated copies associated with TEs in the assembled genome of SGRE may be indicative of a recurrent mechanism of mobilization and pseudogenization of multigene families likely promoted by non-allelic recombination involving TEs, similar to reported in animal and plant species (Raskina et al. 2008; Zhang et al. 2008; Cabral-de-Mello et al. 2012). This process could also be occurring in the other Schistocerca species, considering the truncation pattern observed in coverage profiles of multigene families. This process may be substantial in Schistocerca and other grasshopper species, given their highly repetitive and large genomes (Palacios-Gimenez et al. 2020b; Wang et al. 2014; Camacho et al. 2015; Verlinden et al. 2020). It should be noted that our estimations of the TE content in the Schistocerca likely represent an underestimation, considering the proportions yielded in the SGRE genome draft (Verlinden et al. 2020).
Besides the general occurrence of TEs, our analysis also showed insertions of R1- or R2-like non-LTR retrotransposons into the 28S rDNA gene, an association widely distributed among arthropods (Burke et al. 1998). Considering the deleterious effect of their insertion into the rDNA and the low proportion of insertion observed, a mechanism of elimination of those elements is likely balancing their genomic proportions. All insertions on 28S copies, as well as their counterpart genes of the same cluster (18S and 5.8S), presented high homology with those of the functional loci, suggesting that the insertions were recent and the TEs were rather active. A turnover on the insertion sites through mechanisms of concerted evolution (i.e., unequal crossing over, gene conversion) was proposed to also be involved in further homogenization of 28S rDNA genes (Pérez-González and Eickbush 2002; Stage and Eickbush 2007; Eickbush and Eickbush 2007).
Our genomic analysis indeed indicated that the genomic frequency of truncated copies was higher than that of functional units (those more abundant in PacBio raw reads). The high number of putative pseudogenes may be related to the large genome sizes in Schistocerca, more than 8.5 Gb on average (Gregory 2020), because the relative rate of DNA loss (per kilobases of sequences) is significantly lower in large grasshopper genomes than in Drosophila melanogaster and Caenorhabditis elegans (Petrov et al. 1996; Robertson 2000; Bensasson et al. 2001; Wang et al. 2014). It is possible that pseudogenes in large repetitive genomes such as grasshopper genomes are being removed slowly relative to mutation, so that genetic divergence may accumulate before erosion by deletion. Thus, sequence mobilization and pseudogenization by TEs led to multigene family sequence variability in Schistocerca, which is also indicative of action of the birth-and-death evolution. We believe that some gene sequence units may escape the process of concerted evolution, and ultimately, a mixed model of concerted evolution and birth-and-death is operating for the three multigene families in the genus. In this way, the birth-and-death model drives the long-term evolution of multigene families, responsible for their diversification through mobilization of chromosomal clusters and pseudogenization (Nei and Rooney 2005). This has been observed in the 5S rDNA (Komiya et al. 1986; Ubeda-Manzanaro et al. 2010; Merlo et al. 2012), histone genes (Marzluff et al. 2006), and U2 snDNA (Lo and Mount 1990; Hanley and Schuler 1991; Sierra-Montes et al. 2002; Chen et al. 2005; Sierra-Montes et al. 2005), where different variants coexist in the genome. At the same time, the concerted evolution is responsible for maintaining the array by the homogenization of units, and can also foster the fixation of new variants by spreading them throughout the other arrays. A mixed model of multigene family evolution as observed here for Schistocerca has been observed in fishes (Pinhal et al. 2011; Cabral-de-Mello et al. 2012) and other invertebrates, including grasshoppers (Freire et al. 2010; Anjos et al. 2015; Bardella and Cabral-de-Mello 2018).
CHANGES OF MULTIGENE FAMILIES CHROMOSOMAL LOCI WERE MEDIATED BY INTRA- AND INTERCHROMOSOMAL REARRANGEMENTS OVER TIME
The variable patterns of evolution concerning sequence abundance and divergence of multigene families could be influenced by chromosomal organization. This is because repeats tend to be homogenized more efficiently within chromosomes than between chromosomes due to more effective action of gene conversion and unequal crossing over (Stage and Eickbush 2007; Eickbush and Eickbush 2007; Kuhn et al. 2012; Larracuente 2014). Our FISH mapping in Schistocerca species demonstrated that the multigene families were dynamic at the chromosomal level, although some ancestral patterns for chromosomal location were also noted. Based on the Schistocerca phylogeny (Song et al. 2017), and considering Anacridium as an outgroup, we found evidences of chromosomal inversion or transposition for 18S rDNA clusters on L3 and M6 chromosomes during less than 8 million years of Schistocerca diversification. Furthermore, the cluster of 18S rDNA in L3 was independently deleted in some species. The phylogenetic data support that elimination occurred independently in the common ancestor of clade 1 (SFLA and SCAR) <2 mya, and during the diversification of clade 4 (SDAM, SCER, and SRUB) <3 mya. The number of chromosomal clusters correlated positively with sequence abundance for 18S rDNA, likely owing to the presence of the extra chromosomal cluster in the ancestral Schistocerca (SGRE) and the species within clade 2 (SPAL) and clade 3 (SSEC and SAME). Remarkably, SGRE had the lowest sequence divergence value comparing to thespecies in clade 2 and clade 3, more likely owing to the recent event of local amplification and homogenization within SGRE chromosomal clusters. In other cases, we noted punctual mutation in 18S rDNA reflecting the phylogenetic history of Schistocerca, which suggests that the ancestral mutation between ancestral repeats was conserved along with species diversification. This was observed for the species within clade 4 (SDAM, SCER, and SRUB) that shared the same substitution in nucleotide 758. Our data showed that local amplifications and intrachromosomal rearrangements were shaping the 18S rDNA sequence evolution in Schistocerca. However, the 18S rDNA in Schistocerca was more conserved at chromosomal level than that observed in other grasshoppers (Cabrero and Camacho 2008; Ferretti et al. 2019), beetles (Cabral-de-Mello et al. 2011b), moths, and butterflies (Nguyen et al. 2010), with some species documenting the multiplication of clusters attributed to ectopic recombination (Cabral-de-Mello et al. 2011a; Nguyen et al. 2010). It suggests that the mechanism of rDNA cluster spreading, as ectopic recombination, was not remarkable in Schistocerca and, on the contrary, mechanisms of cluster elimination occurred, resulting in the loss of clusters through evolution.
For U2 snDNA, we believe that the presence of one chromosomal cluster (i.e., L1) is probably the ancestral condition in Schistocerca because this was recorded in most species as well as in A. aegyptium, a distant relative of Schistocerca within Cyrtacanthacridinae. Based on this assumption, the U2 snDNA gene experienced transposition to a second chromosome and changes in sequence abundance, by either deleting copies (i.e., SAME) or increasing copy numbers (i.e., SCER and SRUB). Loci increasing likely occurred twice independently less than 2 mya and involved the same chromosomes (the M5) in SAME and in the common ancestor of SCER and SRUB (Fig. 4). The two latter species also share the same mutations, indicating that the cluster transposition was followed by the amplification and fixation of a new variant. The negative correlation between divergence and abundance observed in U2 snDNA suggests that sequence amplification/homogenization likely occurred at different times in SAME and the species from the clade 4 (SCER and SRUB), supporting independent amplification. The statistical significance observed only for U2 snDNA may also be indicative of that the homogenization events occurred more efficiently in this multigene family than in 18S rDNA and H3 histone. Despite the observed variations, U2 snDNA chromosomal patterns in Schistocerca were less dynamic than what was previously reported in grasshoppers (Palacios-Gimenez et al. 2013; Castillo et al. 2017). In these cases, transpositions plus chromosome inversions were also involved in dynamisms of U2 snDNA. The comparison of sequence abundance between species with cluster restricted to only one chromosome supports local amplification/deletion of U2 repeats.
The presence of a unique chromosomal cluster of H3 histone (i.e., M8) is an ancestral condition in Schistocerca, and its stasis above mentioned, likely reflect functional constraints on their sequences, as previously observed in other insects (Cabral-de-Mello et al. 2011b; Cabrero et al. 2009; Mandrioli and Manicardi 2013; Šíchová et al. 2013; Anjos et al. 2018). The analysis from the PacBio reads and the genome assembly of SGRE supports the low dynamism for H3 histone because we found either a small number of truncated copies or small number of copies associated with TEs, the latter disseminated in fewer scaffolds compared to 18S rDNA and U2 snDNA. Additionally, the H3 histone cluster was localized in a chromosomal region of lower TE density in comparison to U2 snDNA and 18S rDNA (near to pericentromeric heterochromatin), as depicted by FISH mapping. In this sense, the stasis observed in H3 histone may result of a combination of a low tolerance to alterations, due to selective pressures and its position in the genome, relative to TEs. Although conservative, we observed a certain degree of variability in copy number either operating intracluster (i.e., ranging from 0.19% in SGRE to 3.21% in SCAR) as none of the species showed multiplied cluster for H3 histone gene or by nontandem copy distribution that remained undetectable by FISH.
Despite the conservation in diploid number of Schistocerca species, our findings together with previous information regarding other repetitive DNAs (Palacios-Gimenez et al. 2020a; Camacho et al. 2015) highlight the intense reorganization of repetitive DNAs in Schistocerca genomes, contributing to the advance of comparative genomics in the genus. Finally, the combination of multiple approaches such as cytogenetic, genomic, and phylogenetic analyses proved to be essential for understanding the evolution of multigene families in Schistocerca grasshoppers.
AUTHOR CONTRIBUTIONS
EM, OMPG, and DCCM conceived the study. DM, VBB, and OMPG obtained the chromosomal data. EM, DM, and LA analyzed the data. HS provided the genomic data. EM, OMPG, and DCCM interpreted the data and drafted the manuscript. EM, OMPG, DCCM, and HS revised the manuscript.
ACKNOWLEDGMENTS
We are grateful to Dr. J. P. M. Camacho (University of Granada) for providing testis of Anacridium aegyptium. We also acknowledge the two anonymous reviewers, and chief and associate editors for the suggestions and manuscript improvement. All bioinformatic analyses were carried out in the bioinformatic cluster of Laboratorio de Genética Evolutiva “Dr. Claudio Juan Bidau,” Instituto de Biología Subtropical (IBS; CONICET-UNAM). This study was financed in part by the Coordenação de Aperfeiçoamento de Pessoal de Nível Superior—Brasil (CAPES), Fundação de Amparo à Pesquisa do Estado de São Paulo (FAPESP) (process numbers 2014/11763-8 and 2019/19069-7), and Conselho Nacional de Desenvolvimento Científiico e Tecnológico (CNPq). OMP-G was supported by the Swedish Research Council Vetenskapsrådet (grant number 2020–03866). HS acknowledge the support from the U.S. National Science Foundation (grant number IOS-1253493) and the United State Department of Agriculture (Hatch Grant TEX0-1-6584). DCC-d-M is a recipient of a research productivity fellowship from the Conselho Nacional de Desenvolvimento Científico e Tecnológico-CNPq (process number 308290/2020-8).
CONFLICT OF INTEREST
The authors declare no conflict of interest.
DATA ARCHIVING
The data used in the manuscript are given as Supporting Information and raw genomic information is deposited on https://www.ncbi.nlm.nih.gov/sra under the Bioproject accession number PRJNA728796.
LITERATURE CITED
Associate Editor: W. Haerty
Handling Editor: T. Chapman
