


Abstract
Knowledge about health literacy challenges among the general population is valuable for initiatives targeting social inequity in health. We investigated health literacy in various population groups and the impact of healthcare-seeking behaviour by analysing the associations between (i) lifestyle, socioeconomics, self-rated health, chronic disease, and health literacy and (ii) symptom burden, contact to general practitioner (GP), and health literacy. In total, 27 488 individuals participated in a population-based survey. Questionnaire data comprised information about symptoms, GP contact, lifestyle, self-rated health, chronic disease, and four aspects of health literacy: feeling understood and supported by healthcare providers, having sufficient information about health, having social support for health, and being able to actively engage with healthcare providers. Socioeconomics were obtained from registers. Descriptive statistics and multivariable linear regression models were applied. Individuals who smoked, lived alone, had different ethnicity than Danish, and low self-rated health had more health literacy challenges reflected in lower scores for all aspects of health literacy. Individuals with high symptom burden and those who had presented a high absolute number of symptoms to their GP were less likely to have sufficient information about health and be able to actively engage, whereas individuals reporting GP contact with a high relative percentage of their symptoms were more likely to feel understood and supported by healthcare providers. Health literacy challenges are related to healthcare-seeking behaviour and several individual factors. To address social inequity in health and society, interventions aimed at both the individual and community-based health literacy are essential.
Current smoking, unemployment, and poor health increases health literacy challenges.
High number of GP contacts increases some health literacy challenges.
High proportions of healthcare-seeking increases feeling understood and supported by healthcare providers.
Emphasizes the importance of accounting for health literacy when targeting help-seeking behaviour.
Introduction
Social inequity continues to be a challenging factor in healthcare systems worldwide [1] with respect to prevalences, diagnostic pathways, and prognoses and has been demonstrated in several frequent occurring and severe diseases such as cardiovascular diseases, and cancers [1–3]. Being a patient can be daunting and overwhelming, particularly for those who are less familiar with the organization of the healthcare system or who have had negative experiences in the past. Contacting the healthcare system can be particularly challenging for some people and several barriers to healthcare seeking exist such as fear of severe illness, and uncertainties about how to navigate the healthcare system [4]. Simultaneously, strained and worn-out healthcare systems make increasing demands on each patient and their ability to care for themselves [5].
Personal competencies and situational resources needed for people to access, understand, appraise, and use information and services to make decisions about health are included in the definition of health literacy [6]. Patients with health literacy challenges participate less in preventive activities [7], have more hospital admissions and readmissions [8], poorer self-management of chronic diseases [9], poorer disease outcomes [9], and impaired overall health [10]. Most existing studies on health literacy have been conducted among groups of patients with specific diagnoses or health issues, but few have explored health literacy in the general population [11] and its impact on contact with the primary healthcare system [12, 13]. In several countries, including Denmark, initial contacts to the healthcare system are usually made to the general practitioner (GP) [14]. Health literacy challenges increase the risk of emergency presentation of diseases indicating that these may contribute to misinterpretation of symptoms, postponing or omitting healthcare seeking [15].
It has been hypothesized that health literacy is a dynamic outcome of socio-demographic factors as well as individual and environmental factors [16] and that health literacy can be modified through education of the individual as well as re-organization of the healthcare system and society [17–19]. Hence, knowledge about health literacy in the general population and possible associations with help-seeking behaviour may be useful in planning initiatives targeting social inequity [5, 13].
Therefore, we included domains from the Health Literacy Questionnaire (HLQ) representing four aspects of health literacy in the Danish Symptom Cohort II (DaSC II) questionnaire, which is a large population-based survey with the overall purpose of exploring symptoms and healthcare-seeking behaviour [20]. In the present study we investigate health literacy in various population groups and the impact of healthcare-seeking behaviour by analysing the associations between (i) lifestyle, socioeconomic status, self-rated health, chronic disease, and health literacy and (ii) symptom burden, contact to the GP, and health literacy.
Methods
Study population and logistics
The Danish Symptom Cohort was founded in 2012 and expanded in 2022 with the DaSC II survey, which the present study is based on. A total of 100 000 Danish citizens aged 20 years or over randomly selected through their unique personal identification number in the Civil Registrations System (CRS-number) were invited to an online survey. The invitation was sent to each individual’s digital mailbox linked to the CRS-number [21] and included a letter explaining the purpose of the study, legal interests, and a link to a survey webpage. Non-respondents received a reminder letter after 7 and 14 days, respectively. During the data collection period from May to July 2022, all invitees had the opportunity to contact the project group by email or phone.
Questionnaire development
The DaSC II questionnaire was based on the 2012 questionnaire and the development followed the COnsensus-based Standards for the selection of health Measurement INstruments (COSMIN) guidelines [22]. An updated conceptual framework was formed by scrutinizing and adjusting existing constructs and adding new ones inspired by literature, clinical experiences, and interviews with representatives of the general population. The questionnaire was tested in two qualitative pilot tests to ensure content validity. Afterwards the logistical procedures and feasibility were tested in a quantitative field test among 499 randomly selected Danish citizens. The conceptual framework and development of the questionnaire are described in detail elsewhere [20].
Health literacy
Several scales measuring health literacy were reviewed thoroughly, and two scales were tested in the pilot tests [23, 24]. Consequently, the HLQ was found most suitable for the purpose [23]. The HLQ is a comprehensive reflective scale comprising 44 items in 9 domains representing aspects of health literacy. It has been translated, adapted, and validated in a Danish context in both population- and patient-based settings [25]. Each domain can be used alone or together with the remaining domains. The following four aspects were included in the DaSC II survey: ‘Feel understood and supported by healthcare providers (“Understood and supports,” 4 items)’, ‘Have sufficient information to manage my health (“Sufficient information,” 4 items)’, ‘Have social support for health (“Social support,” 5 items)’, and ‘Ability to actively engage with healthcare providers (“Actively engage,” 5 items)’. The selected aspects were hypothesized to be those of most importance for examining healthcare seeking behaviour in a primary care setting. The HLQ items cover a range of health literacy-related statements (Supplementary Materials). For the first three aspects, respondents were asked on a four-point Likert scale whether they agreed with each statement (1 = strongly disagree, 2 = disagree, 3 = agree, 4 = strongly agree), and for the last aspect they were asked on a five-point Likert scale whether they found the statements difficult or easy (1 = always difficult, 2 = usually difficult, 3 = sometimes difficult, 4 = usually easy, 5 = always easy).
Explanatory variables
The survey comprised questions about 44 predefined symptom experiences within the preceding 4 weeks. For each reported symptom additional questions, e.g. whether the respondents had been in contact with their GP, were asked. Further, the questionnaire included questions about lifestyle (smoking status, alcohol consumption, height, and weight), self-rated health, and chronic disease. The phrasing of each question is shown in the Supplementary Materials.
Socioeconomic data were obtained from Statistics Denmark by linkage using the CRS numbers. The variables of interest were marital status, highest obtained educational level, labour market affiliation, and ethnicity [21, 26, 27]. Data on vital status were obtained from the Danish Health Data Authority [28]. Details are described in the Supplementary Materials.
Statistical analyses
Individuals who died before receiving the invitation or were exempted from digital mail (due to mental or physical illness, no access to computer, or language barriers) were excluded prior to invitation [29]. Only individuals who had answered all relevant questions were included.
For each health literacy aspect, we calculated the mean score as the sum scores divided by the number of items within the respective domain, and the appurtenant standard deviation. We used uni- and multivariable linear regression models to analyse the associations between the covariates and each aspect. The analyses were adjusted for sex, age, lifestyle factors, and self-rated health in Model 1, and additionally for the socioeconomic variables in Model 2.
The covariates were categorized as follows: Age-groups (years): 20–39, 40–59, 60–79, and 80 or older. Smoking status: Never, former, and current smoking. Alcohol consumption (units/day): 0, 1–4, 5–10, 10–14, >14. In Denmark one unit is defined as 12 g ethanol. Body mass index (BMI) (kg/m2) was calculated by using height and weight and categorized as followed: <18.5; underweight, 18.5–24.9; normal weight, 25–29.9; overweight, >30; obesity. Self-rated health: Excellent, Very Good, Good, Less Good, Poor. Chronic disease: Yes, no, or don’t know. Marital status: Single or married/living together. Highest obtained educational level: low (<10 years); middle (10–15 years); or high (≥15 years). Labour market affiliation: working, pension, out of workforce, or disability pension. Ethnicity: Danish or immigrants/descendants of immigrants. We assessed the symptom burden by calculating the number symptoms reported by each individual (0 symptoms, 1–3 symptoms, 4–6 symptoms, >7 symptoms). The healthcare-seeking behaviour was assessed in two ways: First by calculating the absolute number of symptoms to which a GP contact was reported by each individual, categorized into four groups (0 symptoms, 1–3 symptoms, 4–6 symptoms, >7 symptoms); second, as the relative percentage of symptoms with GP contact calculated as the number of symptoms with GP contact divided by the total number of reported symptoms for each individual, categorized into five ranges (0%–19%, 20%–39%, 40%–59%, 60%–79%, and 80%–100%). Both variations of healthcare-seeking behaviour were included due to the assumption that there could be a discrepancy between the two and their association with health literacy.
Data analyses were conducted using STATA version 17 (StataCorp, College Station, TX, USA). All tests used a significance level of 0.05. Reporting followed STROBE guidelines.
Ethics
The study was conducted in accordance with Danish Data Protection Legislation, §10. The respondents were informed that there would be no clinical follow-up and instructed to contact their doctor in case of concern. The project has been approved by the Research Ethics Committee at University of Southern Denmark (case no. 21/29156), and by the Danish Data Protection Agency (j.no. 2011-41-6651) through the Research and Innovation Organization (RIO), University of Southern Denmark (project number 10.104).
Results
Of the 100 000 randomly selected individuals, 7254 were ineligible due to having no digital mailbox or death. A total of 31 415 (33.9%) of the individuals eligible for participating in the study answered the questionnaire. After exclusion of individuals with missing data, 27 488 individuals were included in the analyses, Fig. 1.
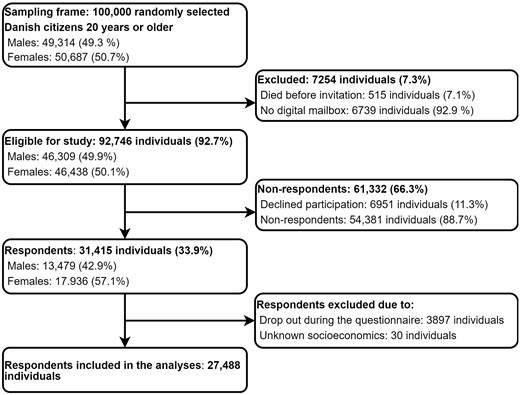
Study flowchart.
Study population characteristics, including mean scores for each of the four aspects of health literacy are presented in Table 1, and the distribution of answers to each HLQ item is shown in the Supplementary Materials.
Study population characteristics and health literacy mean scores and standard deviations (SD)
| Total | ‘Understood and supported’ | ‘Sufficient information’ | ‘Social support’ | ‘Actively engage’ | |
|---|---|---|---|---|---|
| N (%) | Mean score (SD) (range 1–4) | Mean score (SD) (range 1–4) | Mean score (SD) (range 1–5) | Mean score (SD) (range 1–5) | |
| Total | 27 488 (100.0) | 2.87 (0.68) | 3.00 (0.58) | 3.05 (0.60) | 3.74 (0.89) |
| Sex | |||||
| Females | 15 660 (57.0) | 2.88 (0.68) | 3.02 (0.59) | 3.09 (0.60) | 3.68 (0.90) |
| Males | 11 828 (43.0) | 2.86 (0.68) | 2.96 (0.57) | 2.99 (0.59) | 3.81 (0.87) |
| Age groups | |||||
| 20–39 years | 5568 (20.3) | 2.75 (0.71) | 2.90 (0.64) | 3.09 (0.64) | 3.48 (0.93) |
| 40–59 years | 10 132 (36.9) | 2.82 (0.69) | 2.98 (0.58) | 3.02 (0.61) | 3.68 (0.89) |
| 60–79 years | 10 644 (38.7) | 2.96 (0.65) | 3.06 (0.54) | 3.05 (0.57) | 3.90 (0.83) |
| 80+ years | 1144 (4.2) | 3.02 (0.63) | 3.05 (0.55) | 3.04 (0.60) | 3.98 (0.85) |
| Smoking status | |||||
| Never smoking | 13 936 (50.7) | 2.87 (0.68) | 3.03 (0.58) | 3.08 (0.59) | 3.75 (0.88) |
| Former smoking | 9388 (34.2) | 2.91 (0.67) | 3.01 (0.56) | 3.04 (0.58) | 3.79 (0.86) |
| Current smoking | 4164 (15.1) | 2.75 (0.72) | 2.87 (0.62) | 2.95 (0.65) | 3.57 (0.97) |
| Alcohol consumption | |||||
| 0 units/week | 7414 (27.0) | 2.82 (0.72) | 2.93 (0.63) | 2.97 (0.66) | 3.59 (0.96) |
| 1–4 units/week | 10 925 (39.7) | 2.88 (0.66) | 3.02 (0.56) | 3.09 (0.58) | 3.75 (0.87) |
| 5–10 units/week | 5670 (20.6) | 2.89 (0.66) | 3.03 (0.56) | 3.09 (0.57) | 3.84 (0.83) |
| 11–14 units/week | 2266 (8.2) | 2.91 (0.67) | 3.05 (0.54) | 3.07 (0.57) | 3.87 (0.84) |
| ≥15 units/week | 1213 (4.4) | 2.86 (0.70) | 2.99 (0.57) | 2.97 (0.61) | 3.79 (0.91) |
| Body mass index (kg/m2) | |||||
| <18.5: underweight | 410 (1.5) | 2.84 (0.71) | 2.91 (0.66) | 3.00 (0.65) | 3.61 (0.97) |
| 18.5–24.9: normal weight | 14 024 (51.0) | 2.87 (0.68) | 3.03 (0.58) | 3.09 (0.59) | 3.77 (0.87) |
| 25–29.9: overweight | 7259 (26.4) | 2.87 (0.68) | 2.99 (0.57) | 3.03 (0.59) | 3.76 (0.89) |
| 30–34.9: obesity | 5795 (21.1) | 2.86 (0.70) | 2.93 (0.58) | 2.98 (0.62) | 3.64 (0.93) |
| Marital status | |||||
| Single/living alone | 8021 (29.2) | 2.79 (0.71) | 2.94 (0.60) | 2.92 (0.68) | 3.62 (0.94) |
| Married/living together | 19 467 (70.8) | 2.90 (0.67) | 3.02 (0.57) | 3.10 (0.56) | 3.79 (0.87) |
| Highest obtained educational level | |||||
| Low (<10 years) | 1942 (7.1) | 2.84 (0.70) | 2.90 (0.60) | 2.95 (0.62) | 3.67 (1.00) |
| Middle (10–15 years) | 13 434 (48.9) | 2.84 (0.67) | 2.94 (0.57) | 3.00 (0.60) | 3.68 (0.91) |
| High (>15 years) | 12 112 (44.1) | 2.91 (0.69) | 3.08 (0.58) | 3.12 (0.59) | 3.81 (0.85) |
| Labour market affiliation | |||||
| Working | 17 426 (63.4) | 2.83 (0.68) | 3.00 (0.58) | 3.08 (0.59) | 3.70 (0.87) |
| Pension | 7204 (26.2) | 2.99 (0.64) | 3.06 (0.54) | 3.06 (0.57) | 3.94 (0.83) |
| Out of workforce | 1843 (6.7) | 2.78 (0.74) | 2.84 (0.63) | 2.88 (0.68) | 3.43 (1.00) |
| Disability pension | 1015 (3.7) | 2.83 (0.76) | 2.84 (0.67) | 2.83 (0.71) | 3.45 (1.03) |
| Ethnicitiy | |||||
| Danish | 25 530 (92.9) | 2.88 (0.68) | 3.01 (0.57) | 3.06 (0.59) | 3.76 (0.88) |
| Immigrants and descendants of immigrants | 1958 (7.1) | 2.68 (0.71) | 2.81 (0.66) | 2.83 (0.66) | 3.51 (0.96) |
| Self-rated health | |||||
| Excellent | 1767 (6.4) | 3.02 (0.76) | 3.34 (0.62) | 3.34 (0.64) | 4.22 (0.84) |
| Very good | 8635 (31.4) | 2.96 (0.67) | 3.18 (0.53) | 3.22 (0.54) | 3.98 (0.77) |
| Good | 12 116 (44.1) | 2.83 (0.65) | 2.94 (0.52) | 2.99 (0.56) | 3.69 (0.85) |
| Less good | 4179 (15.2) | 2.75 (0.70) | 2.73 (0.59) | 2.82 (0.62) | 3.31 (0.93) |
| Poor | 791 (2.9) | 2.65 (0.80) | 2.51 (0.73) | 2.65 (0.75) | 3.03 (1.09) |
| Chronic disease | |||||
| Yes | 11 773 (42.8) | 2.92 (0.69) | 2.96 (0.59) | 3.01 (0.61) | 3.68 (0.90) |
| No | 13 840 (50.3) | 2.85 (0.67) | 3.06 (0.56) | 3.10 (0.58) | 3.83 (0.85) |
| Don’t know | 1875 (6.8) | 2.69 (0.69) | 2.76 (0.60) | 2.86 (0.63) | 3.41 (0.96) |
SD, standard deviation.
Table 2 shows the adjusted associations between sex, age, lifestyle, socioeconomic factors, self-rated health, chronic disease, and each aspect of health literacy. Males had lower scores for feeling ‘Understood and supported’ (β: −0.04, 95% CI: −0.06; −0.03), having ‘Sufficient information’ (β: −0.08, 95% CI: −0.09; −0.07), and having ‘Social support’ (β: −0.11, 95% CI: −0.13; −0.10), but higher scores on ability to ‘Actively engage’ (β: 0.08, 95% CI: 0.06; 0.10) compared to females. Mean scores for all aspects, except for ‘Social support’, increased with age. Individuals who currently smoked had lower scores for all four aspects. Individuals who were obese had higher scores for feeling ‘Understood and supported’ (β: 0.06, 95% CI: 0.04; 0.08), having ‘Sufficient information’ (β: 0.04, 95% CI: 0.03; 0.06), and ability to ‘Actively engage’ (β: 0.06, 95% CI: 0.04; 0.09) compared to individuals with normal weight.
Associations between sex, age, lifestyle, overall health, chronic disease, and health literacy (N = 27 488)
| ‘Understood and supported’ | ‘Sufficient information’ | ‘Social support’ | ‘Actively engage’ | |||||
|---|---|---|---|---|---|---|---|---|
| Adj.a β (95% CI) | Adj.b β (95% CI) | Adj.a β (95% CI) | Adj.b β (95% CI) | Adj.a β (95% CI) | Adj.b β (95% CI) | Adj.a β (95% CI) | Adj.b β (95% CI) | |
| Sex (Ref. females) | ||||||||
| Males | −0.05 (−0.06; −0.03) | −0.04 (−0.06; −0.03) | −0.09 (−0.10; −0.07) | −0.08 (−0.09; −0.07) | −0.11 (−0.12; −0.09) | −0.11 (−0.13; −0.10) | 0.07 (0.05; 0.09) | 0.08 (0.06; 0.10) |
| Age groups (Ref. 20–39 years) | ||||||||
| 40–59 years | 0.08 (0.06; 0.11) | 0.07 (0.04; 0.09) | 0.12 (0.10; 0.14) | 0.11 (0.09; 0.12) | −0.04 (−0.05; −0.02) | −0.07 (−0.08; −0.05) | 0.25 (0.22; 0.28) | 0.23 (0.21; 0.26) |
| 60–79 years | 0.24 (0.21; 0.26) | 0.18 (0.16; 0.21) | 0.21 (0.19; 0.22) | 0.19 (0.17; 0.21) | 0.00 (−0.01; 0.02) | −0.04 (−0.06; −0.01) | 0.48 (0.45; 0.51) | 0.42 (0.38; 0.45) |
| 80+years | 0.31 (0.27; 0.36) | 0.25 (0.20; 0.30) | 0.25 (0.21; 0.28) | 0.23 (0.19; 0.27) | 0.04 (0.00; 0.08) | 0.01 (−0.04; 0.05) | 0.61 (0.55; 0.66) | 0.52 (0.46; 0.58) |
| Smoking status (Ref. Never smoking) | ||||||||
| Former smoking | 0.01 (−0.00; 0.03) | 0.02 (−0.00; 0.03) | −0.01 (−0.02; 0.01) | −0.00 (−0.02; 0.01) | −0.01 (−0.02; 0.01) | −0.00 (−0.02; 0.01) | 0.00 (−0.02; 0.02) | 0.01 (−0.01; 0.03) |
| Current smoking | −0.07 (−0.09; −0.04) | −0.04 (−0.07; −0.02) | −0.06 (−0.08; −0.04) | −0.04 (−0.06; −0.02) | −0.06 (−0.08; −0.04) | −0.02 (−0.04; −0.00) | −0.05 (−0.08; −0.02) | −0.01 (−0.04; 0.02) |
| Alcohol consumption (Ref. 1–4 unit/week) | ||||||||
| 0 units/week | −0.02 (−0.04; 0.00) | −0.00 (−0.02; 0.02) | −0.01 (−0.03; 0.00) | 0.01 (−0.01; 0.02) | 0.01 (−0.01; 0.03) | −0.00 (−0.02; 0.02) | 0.01 (−0.02; 0.03) | −0.00 (−0.03; 0.02) |
| 5–10 units/week | −0.02 (−0.04; 0.00) | −0.03 (−0.05; −0.01) | −0.00 (−0.02; 0.02) | −0.01 (−0.03; 0.01) | 0.02 (−0.01; 0.04) | 0.01 (−0.02; 0.03) | −0.00 (−0.04; 0.04) | −0.02 (−0.05; 0.02) |
| 11–14 units/week | −0.01 (−0.04; 0.02) | −0.02 (−0.05; 0.01) | 0.02 (−0.00; 0.05) | 0.01 (−0.02; 0.03) | −0.03 (−0.07; 0.00) | −0.04 (−0.07; −0.00) | −0.03 (−0.08; 0.02) | −0.04 (−0.09; 0.01) |
| Mere end 15 units/week | −0.03 (−0.07; 0.01) | −0.04 (−0.08; 0.00) | 0.02 (−0.01; 0.05) | 0.01 (−0.02; 0.04) | −0.06 (−0.12; −0.00) | −0.05 (−0.11; 0.00) | −0.01 (−0.09; 0.07) | −0.01 (−0.09; 0.07) |
| Body mass index (Ref. 18.5–24.9: normal weight) | ||||||||
| <18.5: Underweight | −0.00 (−0.07; 0.06) | −0.00 (−0.07; 0.06) | −0.06 (−0.11; −0.01) | −0.06 (−0.11; −0.00) | −0.06 (−0.12; −0.00) | −0.05 (−0.11; 0.00) | −0.01 (−0.09; 0.07) | −0.01 (−0.09; 0.07) |
| 25–29.9: Overweight | 0.01 (−0.01; 0.03) | 0.02 (−0.00; 0.03) | 0.00 (−0.01; 0.02) | 0.01 (−0.00; 0.03) | −0.00 (−0.02; 0.01) | −0.00 (−0.02; 0.01) | 0.02 (−0.00; 0.04) | 0.02 (0.00; 0.05) |
| >30: Obesity | 0.06 (0.03; 0.08) | 0.06 (0.04; 0.08) | 0.03 (0.01; 0.05) | 0.04 (0.03; 0.06) | 0.00 (−0.02; 0.02) | 0.01 (−0.01; 0.03) | 0.05 (0.02; 0.08) | 0.06 (0.04; 0.09) |
| Marital status (Ref. single) | ||||||||
| Married/living together | 0.08 (0.06; 0.10) | 0.08 (0.06; 0.10) | 0.04 (0.03; 0.05) | 0.03 (0.02; 0.05) | 0.17 (0.15; 0.18) | 0.16 (0.14; 0.17) | 0.09 (0.07; 0.11) | 0.08 (0.06; 0.10) |
| Highest obtained educational level [Ref. low (<10 years)] | ||||||||
| Middle (10–15 years) | 0.01 (−0.02; 0.05) | 0.02 (−0.01; 0.06) | 0.02 (−0.01; 0.04) | 0.02 (−0.00; 0.05) | 0.01 (−0.02; 0.04) | 0.01 (−0.02; 0.03) | 0.03 (−0.01; 0.07) | 0.04 (0.00; 0.08) |
| High (>15 years) | 0.08 (0.05; 0.11) | 0.09 (0.06; 0.13) | 0.13 (0.10; 0.16) | 0.14 (0.11; 0.16) | 0.08 (0.05; 0.11) | 0.08 (0.05; 0.11) | 0.13 (0.09; 0.17) | 0.14 (0.10; 0.18) |
| Labour market affiliation (Ref. working) | ||||||||
| Pension | 0.07 (0.04; 0.09) | 0.08 (0.05; 0.10) | 0.02 (−0.00; 0.04) | 0.03 (0.01; 0.05) | 0.01 (−0.01; 0.04) | 0.02 (0.00; 0.05) | 0.09 (0.05; 0.12) | 0.10 (0.07; 0.13) |
| Out of workforce | 0.02 (−0.01; 0.05) | 0.05 (0.02; 0.08) | −0.03 (−0.05; 0.00) | 0.00 (−0.03; 0.03) | −0.10 (−0.13; −0.07) | −0.06 (−0.09; −0.03) | −0.06 (−0.10; −0.02) | −0.03 (−0.07; 0.01) |
| Disability pension | 0.05 (0.01; 0.10) | 0.08 (0.04; 0.12) | −0.01 (−0.04; 0.03) | 0.02 (−0.02; 0.06) | −0.09 (−0.12; −0.05) | −0.04 (−0.08; −0.01) | −0.06 (−0.11; −0.00) | −0.02 (−0.07; 0.03) |
| Ethnicitiy (Ref. Danish) | ||||||||
| Immigrants/descendants of immigrants | −0.13 (−0.16; −0.10) | −0.14 (−0.17; −0.11) | −0.13 (−0.16; −0.11) | −0.15 (−0.17; −0.12) | −0.20 (−0.23; −0.17) | −0.20 (−0.23; −0.18) | −0.12 (−0.16; −0.08) | −0.13 (−0.16; −0.09) |
| Self-rated health (Ref. excellent) | ||||||||
| Very good | −0.07 (−0.11; −0.04) | −0.08 (−0.11; −0.04) | −0.18 (−0.21; −0.16) | −0.19 (−0.21; −0.16) | −0.14 (−0.16; −0.11) | −0.14 (−0.17; −0.11) | −0.27 (−0.31; −0.23) | −0.28 (−0.32; −0.24) |
| Good | −0.22 (−0.26; −0.19) | −0.22 (−0.25; −0.19) | −0.43 (−0.46; −0.40) | −0.42 (−0.45; −0.39) | −0.36 (−0.39; −0.33) | −0.35 (−0.38; −0.33) | −0.60 (−0.64; −0.56) | −0.59 (−0.64; −0.55) |
| Less good | −0.30 (−0.34; −0.26) | −0.30 (−0.33; −−0.26) | −0.64 (−0.67; −0.61) | −0.62 (−0.65; −0.59) | −0.53 (−0.56; −0.50) | −0.50 (−0.53; −0.47) | −0.97 (−1.02; −0.92) | −0.95 (−1.00; −0.90) |
| Poor | −0.39 (−0.45; −0.34) | −0.39 (−0.44; −0.33) | −0.86 (−0.90; −0.81) | −0.82 (−0.87; −0.78) | −0.69 (−0.74; −0.64) | −0.63 (−0.68; −0.58) | −1.24 (−1.31; −1.17) | −1.20 (−1.27; −1.13) |
| Chronic disease (Ref. no) | ||||||||
| Yes | 0.14 (0.12; 0.16) | 0.13 (0.12; 0.15) | 0.04 (0.03; 0.06) | 0.04 (0.02; 0.05) | 0.04 (0.03; 0.06) | 0.05 (0.03; 0.06) | 0.02 (0.00; 0.05) | 0.02 (0.00; 0.05) |
| Don’t know | −0.07 (−0.11; −0.04) | −0.06 (−0.09; −0.03) | −0.15 (−0.18; −0.13) | −0.14 (−0.16; −0.11) | −0.12 (−0.15; −0.10) | −0.10 (−0.13; −0.07) | −0.23 (−0.27; −0.19) | −0.21 (−0.26; −0.17) |
Model 1: Adjusted (Adj.) for: sex, age, smoking status, and self-rated health.
Model 2: Adjusted (Adj.) for: sex, age, smoking status, self-rated health, marital status, highest obtained educational level, labour market affiliation, and ethnicity.
For all four aspects of health literacy, the scores decreased with decreasing self-rated health, although individuals with a chronic disease had higher scores for feeling ‘Understood and supported’ (β: 0.13, 95% CI: 0.12; 0.15), having ‘Sufficient information’ (β: 0.04, 95% CI: 0.02; 0.05), and ‘Social support’ (β: 0.05, 95% CI: 0.03; 0.06) than individuals with no chronic disease. Individuals who lived alone and had different ethnicity than Danish had lower scores for all four aspects, Table 2.
Each individual reported an average of 4.7 symptoms, and 29.2% of all reported symptoms had been presented to the GP. Some 29.8% of the respondents reported seven symptoms or more, whereas 8.5% reported no symptoms at all. Half of the respondents had not contacted their GP about any symptoms (56.3%), and 4.6% had contacted their GP about seven symptoms or more. One out of six (15%) respondents had presented 60% or more of their symptoms to their GP, Table 3. Mean health literacy scores for each group are shown in the Supplementary Materials.
Associations between symptom burden, number of reported symptoms with the GP contact, and proportions of reported symptoms with GP contact, and health literacy (N = 27 488)
| ‘Understood and supported’ | ‘Sufficient information’ | ‘Social support’ | ‘Actively engage’ | ||||||
|---|---|---|---|---|---|---|---|---|---|
| n (%) | Adj.a β (95% CI) | Adj.b β (95% CI) | Adj.a β (95% CI) | Adj.b β (95% CI) | Adj.a β (95% CI) | Adj.b β (95% CI) | Adj.a β (95% CI) | Adj.b β (95% CI) | |
| Symptom burden {ref: 0 symptoms [n = 2331 (8.5%)]} | |||||||||
| 1–3 | 9923 (36.1) | 0.05 (0.01; 0.08) | 0.04 (0.00; 0.07) | 0.01 (−0.02; 0.03) | −0.00 (−0.03; 0.02) | 0.02 (−0.01; 0.04) | −0.00 (−0.03; 0.02) | 0.02 (−0.02; 0.05) | 0.01 (−0.03; 0.04) |
| 4–6 | 7043 (25.6) | 0.03 (−0.01; 0.06) | 0.01 (−0.02; 0.05) | −0.04 (−0.07; −0.01) | −0.06 (−0.08; −0.03) | −0.01 (−0.04; 0.02) | −0.03 (−0.06; −0.00) | −0.12 (−0.16; −0.08) | −0.14 (−0.18; −0.10) |
| ≥7 | 8191 (29.8) | −0.02 (−0.06; 0.01) | −0.04 (−0.07; −0.00) | −0.12 (−0.15; −0.09) | −0.13 (−0.16; −0.11) | −0.05 (−0.08; −0.02) | −0.07 (−0.10; −0.05) | −0.30 (−−0.34; −0.26) | −0.31 (−0.36; −0.27) |
| Absolute number of symptoms with GP contact {ref: 0 symptoms [n = 15 465 (56.3%)]} | |||||||||
| 1–3 | 8351 (30.4) | 0.06 (0.04; 0.08) | 0.06 (0.04; 0.08) | −0.04 (−0.06; −0.03) | −0.05 (−0.06; −0.03) | 0.01 (−0.01; 0.02) | 0.00 (−0.01; 0.02) | −0.04 (−0.06; −0.02) | −0.04 (−0.07; −0.02) |
| 4–6 | 2400 (8.7) | 0.10 (0.07; 0.13) | 0.09 (0.06; 0.12) | −0.07 (−0.09; −0.04) | −0.07 (−0.10; −0.05) | 0.00 (−0.02; 0.03) | 0.00 (−0.02; 0.03) | −0.10 (−0.14; −0.06) | −0.10 (−0.14; −0.06) |
| ≥7 | 1272 (4.6) | 0.09 (0.05; 0.14) | 0.10 (0.06; 0.14) | −0.12 (−0.16; −0.09) | −0.12 (−0.15; −0.08) | 0.02 (−0.02; 0.05) | 0.03 (−0.01; 0.06) | −0.14 (−0.19; −0.09) | −0.14 (−0.19; −0.09) |
| Relative percentage of symptoms with GP contact {ref: 0%–19% [n = 17 005 (61.9%)]} | |||||||||
| 20%–39% | 3469 (12.6) | 0.04 (0.02; 0.07) | 0.04 (0.01; 0.06) | −0.06 (−0.08; −0.04) | −0.07 (−0.09; −0.05) | −0.01 (−0.03; 0.01) | −0.01 (−0.04; 0.01) | −0.06 (−0.09; −0.03) | −0.06 (−0.09; −0.03) |
| 40%–59% | 2881 (10.5) | 0.08 (0.05; 0.10) | 0.07 (0.05; 0.10) | −0.05 (−0.07; −0.02) | −0.05 (−0.07; −0.03) | 0.01 (−0.01; 0.03) | 0.01 (−0.01; 0.03) | −0.03 (−0.07; 0.00) | −0.04 (−0.07; −0.00) |
| 60%–79% | 1767 (6.4) | 0.17 (0.14; 0.20) | 0.17 (0.13; 0.20) | 0.01 (−0.02; 0.04) | 0.01 (−0.02; 0.04) | 0.06 (0.03; 0.09) | 0.06 (0.03; 0.09) | 0.05 (0.01; 0.09) | 0.05 (0.01; 0.09) |
| 80%–100% | 2355 (8.6) | 0.14 (0.11; 0.17) | 0.14 (0.11; 0.17) | 0.00 (−0.02; 0.03) | 0.01 (−0.02; 0.03) | 0.05 (0.02; 0.07) | 0.06 (0.03; 0.08) | 0.06 (0.02; 0.09) | 0.06 (0.03; 0.10) |
Model 1: Adjusted for: sex, age, smoking status, and self-rated health.
Model 2: Adjusted for: sex, age, smoking status, self-rated health, marital status, highest obtained educational level, labour market affiliation, and ethnicity.
Overall, individuals with high symptom burden (≥7 symptoms) had lower mean scores for all aspects of health literacy except feeling ‘Understood and supported’, with the most pronounced scores for ‘Actively engage’ (β: −0.14, 95% CI: −0.19; −0.09), Table 3. Individuals who reported GP contact with seven symptoms or more, and individuals with high relative percentage of symptoms presented to the GP (>60% of symptoms reported) were more likely to feel ‘Understood and supported’ (β≥7 symptoms: 0.10, 95% CI: 0.6; 0.14, β60%–79%: 0.17, 95% CI: 0.13; 0.20) (β80%–100%: 0.14, 95% CI: 0.11; 0.17) than individuals with no GP contacts. Conversely, the mean score for ability to ‘Actively engage’ decreased with increasing absolute number of symptoms presented to the GP, Table 3. The crude associations are shown in the Supplementary Materials.
Discussion
Main findings
In this survey including a large, random sample of the adult Danish population, we found that health literacy is related to healthcare-seeking behaviours and several individual factors. Overall, individuals who smoke, live alone, have different ethnicity than Danish or low self-rated health had more challenges with feeling understood and supported by healthcare providers, having sufficient information to manage health problems, having sufficient social support, and being able to actively engage with healthcare providers.
Individuals with high symptom burden and those who had presented a high absolute number of symptoms to the GP had less sufficient information to manage health problems and ability to engage with healthcare providers, whereas individuals with high relative percentage of symptoms with GP contact had more health literacy strengths, regarding feeling understood and supported by healthcare providers.
Strengths and limitations
A strength of the study is the large population-based sample, which despite the response rate of 33.9% has enabled inclusion of respondents of different ages, educational levels, labour market affiliations, and ethnicities [20]. Nevertheless, selection bias cannot be eliminated even though it was sought to be minimized through an easily read invitation and the opportunity of contacting the project group. Individuals with health literacy challenges may be less likely to participate in a comprehensive survey [30], thus potentially compromising the external validity of the study and causing an overestimation of health literacy. Consequently, the associations between the covariates and health literacy found in this study may be an underestimation. The distribution of answers to the HLQ items in the present study showed some ceiling effect, yet it is similar to or lower than in previous population-based studies [25, 31].
The HLQ is widely distributed all over the world, making it possible to compare findings with existing literature and discuss health literacy challenges and strengths in different populations. Inclusion of all HLQ domains would have been desirable [23], but this would have compromised efforts to keep the DaSC II questionnaire brief and comprehensible. We consider the selected aspects to be those most likely to influence help-seeking behaviour, whereas the remaining domains to a higher degree concern contact to the secondary healthcare system. The HLQ does not provide a total score or cut-off for high or low health literacy, hence it acknowledges that the same individual may possess both health literacy strengths and challenges [32]. All included aspects showed good internal consistency with Cronbach alphas above 0.8 [25]. Furthermore, the literature proposes that strong health literacy does not amount to an exact number or grade, but is rather, a dynamic capability, influenced by individual, environmental and social factors [18, 32]. Several studies have explored health literacy among patients. The DaSC II study provides the opportunity to explore health literacy strengths and challenges in the general population and to explore the influence of these on healthcare-seeking.
Development of the DaSC II questionnaire followed the COSMIN guidelines [22]. The pilot-, and field tests showed good content validity and feasibility [20]. The survey was online, which can provide a feeling of anonymity, but social desirability bias cannot be eliminated. However, the frequency of current smoking, obesity, and alcohol consumption is similar to another Danish population-based study [33].
Discussion of results and comparison with existing literature
Females had fewer health literacy challenges in three of the four aspects, whereas males had more strengths in terms of ability to actively engage with healthcare providers. This may be explained by males experiencing fewer barriers to healthcare seeking [4, 34]. Health literacy strengths increased with age, except for the availability of social support. This is in line with the framework by Maindal et al who discuss health literacy and the life-course perspective [35]. Older individuals may have more experience as patients, particularly in terms of their ability to actively engage with and feel supported and understood by healthcare providers, but have a smaller social network compared to younger individuals. The present study may overestimate health literacy strengths among the oldest individuals since older individuals with significant health literacy challenges are unlikely to have been able to complete the questionnaire [29].
Individuals who currently smoked had lower health literacy scores than individuals who had never smoked, even after adjusting for socioeconomic factors. The literature on smoking and health literacy is ambiguous, perhaps due to differences in measurement tools and study populations [11, 36, 37]. Stigma related to smoking and in communication about smoking-related symptoms and diseases could be of importance for feeling less understood and supported and having difficulties engaging with healthcare providers. Individuals who currently smoke may have felt dismissed by their GP when presenting with respiratory or cardiac symptoms and others may feel guilt or self-blame causing them to omit or post-pone healthcare seeking [38]. Contrary to our hypothesis, few associations between alcohol consumption, BMI, and health literacy were found, even though stigma and difficulties in approaching the healthcare system may also be of importance within these groups [39].
In line with previous studies, we found more health literacy challenges among individuals with deprived socioeconomic background [11, 31]. Socioeconomic factors have often been used as proxy for social differences, and as explanatory variables, e.g. for high prevalence of chronic diseases and cancers [1]. Our findings support suggestions to target future equity interventions to improve health literacy responsiveness [5, 17–19].
Similar with previous studies, we found more health literacy challenges among individuals with low self-rated health [37]. This emphasizes the challenges that individuals with low self-rated health may experience, accentuating that poor health may be part of a vicious circle in which multiple challenges reinforce each other. Conversely, individuals with a chronic disease had slightly higher scores for health literacy compared to those with no chronic disease, even after adjusting for age. Most patients with a chronic disease are monitored with regular checks in general practice in Denmark, which may facilitate a trustful relation between the GPs and patients enhancing the health literacy.
Individuals with high symptom burden and those with a high absolute number of symptoms with GP contact were more challenged in their ability to actively engage with healthcare providers and with having sufficient information about health, whereas individuals who presented a high relative percentage of symptoms to the GP were more likely to feel understood and supported and be able to actively engage. These findings raise questions about chronology. Do individuals contact the GP with a high proportion of symptoms due to their health literacy strengths, or do they have strong health literacy because of several contacts with the healthcare system? It is likely not a one-way explanation but, rather, a combination of both, emphasizing the importance of ensuring health literacy responsiveness at both the organizational and individual levels.
Implications
In the present study, individuals with deprived socioeconomic backgrounds, a current use of tobacco, and low self-rated health had more health literacy challenges, emphasizing that some of the social inequities in health and society could be targeted implementing a health literacy perspective to interventions. This study also indicates that health literacy strengths and challenges are of importance for both interpretation of symptoms, and help-seeking behaviour. In primary care both the GPs and their staff are well acquainted with their patients, and thereby opportunity to promote health literacy, e.g. by articulating difficulties, offering guidance in symptom perceptions, and individualization of the consultations.
Initiatives targeting social inequity in health may benefit from considering the impact of health literacy, e.g. when promoting timely healthcare seeking with symptoms. This could be through initiatives in municipalities, offering support and guidance in relation to help-seeking [5, 19], but also the GPs may facilitate easier access to care among vulnerable patients who feel less understood and supported and less able actively engage with healthcare providers [18].
Yet more nuanced, and detailed knowledge is needed to understand how health literacy influences the perception of single- and multiple symptoms, healthcare seeking with symptoms indicative of specific diseases and barriers to help seeking. For instance, individuals with health literacy challenges may benefit from continuity in general practice to both strengthen health literacy and enhance the possibilities of diagnosing and treating future illnesses [40], hence improve prognoses and quality of life for the patients and equity in health. Implementing a health literacy perspective into both research and interventions targeting social inequity, and not merely socioeconomic factors, offers the opportunity to intervene on modifiable determinants of health through initiatives targeting individual, organizational, and system capacity [19, 32].
Conclusion
Health literacy is related to several individual factors as well as symptom burden and healthcare-seeking behaviour. Individual factors of importance for health literacy challenges are currently smoking, living alone, having different ethnicity than Danish and low self-rated health. Further, high symptom burden and high absolute number of symptoms with GP contact were associated with challenges related to having sufficient information to manage health problems and ability to actively engage with healthcare providers. On the other hand, individuals who had presented a high relative percentage of symptoms to their GP were more likely to feel understood and supported by and able to actively engage with healthcare professionals. To address social inequity in health and society, interventions directed to both the individual and community-based health literacy are therefore essential.
Acknowledgements
The project group would like to thank all participants, the user panel, and internal and external collaborators who have contributed to the developmental process.
Author contributions
All authors contributed to development of the questionnaire and data collection. Lisa Maria Sele Sætre did the first draft of the manuscript and conducted the statistical analyses with support from a statistician. All authors read, contributed to, and approved the final manuscript.
Supplementary data
Supplementary data are available at EURPUB online.
Conflict of interest: None declared.
Funding
The project was funded by the Danish Cancer Society, Region of Southern Denmark, Holms Memorial Legacy, The Health Foundation, Danish Cancer Research Foundation, Aase and Einer Danielsen Foundation, Lilly and Herberts Foundation, and The General Fund. The funding sources did not have any influence on the design of the study.
Data availability
The dataset generated and analysed in the current study are not publicly available and cannot be shared due to the data protection regulations of the Danish Data Protection Agency. Access to data is strictly limited to the researchers who have obtained permission for data processing. This permission was given to the Research Unit of General Practice, Department of Public Health, University of Southern Denmark. Further inquiries can be made to the PI Dorte Jarbøl (e-mail: [email protected]).

Comments