


Abstract
Loss of cell-to-cell communication results in local conduction disorders and directional heterogeneity (LDH) in conduction velocity (CV) vectors, which may be unmasked by premature atrial contractions (PACs). We quantified LDH and examined differences between sinus rhythm (SR) and spontaneous PACs in patients with and without atrial fibrillation (AF).
Intra-operative epicardial mapping of the right and left atrium (RA, LA), Bachmann’s bundle (BB) and pulmonary vein area (PVA) was performed in 228 patients (54 with AF). Conduction velocity vectors were computed at each electrode using discrete velocity vectors. Directions and magnitudes of individual vectors were compared with surrounding vectors to identify LDH. Five hundred and three PACs [2 (1–3) per patient; prematurity index of 45 ± 12%] were included. During SR, most LDH were found at BB and LA [11.9 (8.3–14.9) % and 11.3 (8.0–15.2) %] and CV was lowest at BB [83.5 (72.4–94.3) cm/s, all P < 0.05]. Compared with SR, the largest increase in LDH during PAC was found at BB and PVA [+13.0 (7.7, 18.3) % and +12.5 (10.8, 14.2) %, P < 0.001]; CV decreased particularly at BB, PVA and LA [−10.0 (−13.2, −6.9) cm/s, −9.3 (−12.5, −6.2) cm/s and −9.1 (−11.7, −6.6) cm/s, P < 0.001]. Comparing patients with and without AF, more LDH were found during SR in AF patients at PVA and BB, although the increase in LDH during PACs was similar for all sites.
Local directional heterogeneity is a novel methodology to quantify local heterogeneity in CV as a possible indicator of electropathology. Intra-operative high-resolution mapping indeed revealed that LDH increased during PACs particularly at BB and PVA. Also, patients with AF already have more LDH during SR, which becomes more pronounced during PACs.
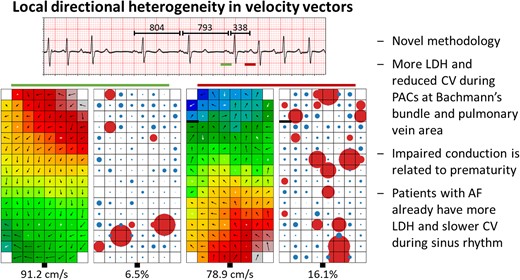
Local directional heterogeneity (LDH) is introduced as a novel methodology to quantify local heterogeneity in conduction velocity (CV) vectors as a possible indicator of electropathology.
Intra-operative high-resolution mapping during 503 premature atrial contractions (PACs) revealed that LDH increased and CV reduced during PACs, particularly at Bachmann’s bundle and pulmonary vein area, which was also related to the degree of prematurity.
Patients with atrial fibrillation already have more LDH and slower CV during sinus rhythm, which becomes more pronounced during PACs.
Introduction
Atrial conduction velocity (CV) is frequently used to identify potential mechanisms for arrhythmogenesis as it provides important information about the speed and direction of wavefront propagation through myocardium. In non-remodelled atrial tissue, wavefront propagation is considered to be fast and along the longitudinal direction of the myocardial fibres.1 However, in case of tissue damage and loss of cell-to-cell communication, wavefront propagation can be locally distorted.2 This in turn leads to enhanced non-uniform tissue anisotropy which results in local conduction disorders and heterogeneous conduction. Eventually, these areas may become involved in initiation of tachyarrhythmias, such as atrial fibrillation (AF).
In daily clinical practice, mapping systems can easily create maps to quantify and visualize atrial CV. However, many systems apply algorithms that smooth wavefront propagation in which local conduction heterogeneities could be masked.3 Recently, we developed a novel algorithm for CV estimation which is able to most accurately identify local conduction heterogeneities without smoothing of wavefront propagation.3
Premature atrial contractions (PACs) frequently originate from areas other than the sino-atrial node, resulting in wavefront propagation via alternative routes. These PACs may enhance conduction disorders and endo-epicardial asynchrony, which in turn are related to initiation and perpetuation of AF.4,5 Especially in non-uniform anisotropic tissue, conduction disorders are direction and frequency dependent. High-resolution mapping during PACs, therefore, provides the opportunity to quantify changes in local directional heterogeneities (LDH) in CV vector fields. It is likely that areas of heterogeneous conduction may be unmasked during PACs, which are otherwise hidden during normal sinus rhythm (SR). The goal of this study was therefore to introduce LDH as a novel methodology and to examine differences between SR and spontaneous PACs in patients with and without history of AF.
Methods
Study population
The study population consisted of 228 successive adult patients without and with a history of AF undergoing open heart coronary artery bypass grafting (CABG), aortic or mitral valve surgery or a combination of valvular and CABG in the Erasmus Medical Center Rotterdam. This study was approved by the institutional medical ethical committee (MEC2010-054/MEC2014-393). Written informed consent was obtained from all patients. Patient characteristics were obtained from the patient’s medical record.
Mapping procedure
Epicardial high-resolution mapping was performed prior to commencement to extra-corporal circulation, as previously described in detail.3 A temporal bipolar epicardial pacemaker wire attached to the right atrium (RA) free wall served as a reference electrode. A steel wire fixed to subcutaneous tissue of the thoracic cavity was used as an indifferent electrode. Epicardial mapping was performed with a 128-electrode array or 192-electrode array (electrode diameter respectively 0.65 or 0.45 mm, interelectrode distances 2.0 mm). Mapping was performed by shifting the electrode array along predefined lines with a fixed anatomic orientation, following a predefined mapping scheme, covering the entire epicardial surface of the RA, Bachmann’s bundle (BB), pulmonary vein area (PVA) and left atrium (LA), as illustrated in Figure 1.
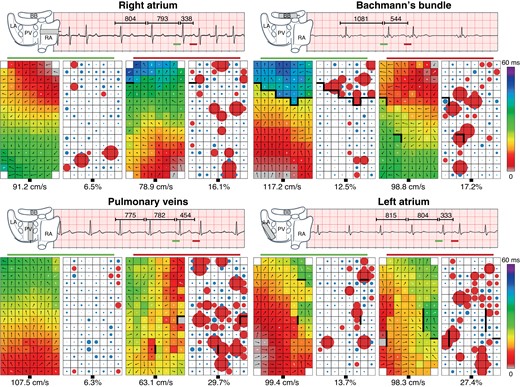
Examples of SR beats and PACs recorded at various atrial sites. Four examples of 5 s SR recordings including PACs and corresponding colour-coded activation (left) and LDH (right) maps. Black arrows represent the direction and magnitude of local CV, white arrows indicate LDH. Thick black lines in the activation maps correspond with conduction block according to a time difference between adjacent electrodes of ≥12 ms. Circles represent the degree of heterogeneity of vectors, in which the red colour indicate LDH. The size of the circles represents the degree of vector heterogeneity. Upper left panel: recording of one RA location in a 54 year-old female with AVD and paroxysmal AF a SR beat (cycle length 793 ms) followed by a PAC (cycle length 338 ms, prematurity index 57%). The origin of the PAC is unknown. Compared with SR, the PAC provoked 9.6% more LDH and decreased CV by 12.3 cm/s. Right upper panel: recording of a BB location in a 63 year-old male with MVD without history of AF during a SR beat (cycle length 1081 ms) followed by a PAC (cycle length 554 ms, prematurity index 49%). Origin of the PAC is presumably left-sided. Compared with SR, the PAC provoked 4.7% more LDH and reduced CV by 18.4 cm/s. Left lower panel: recording of a PV location in a 63 year-old male undergoing CABG without history of AF during a SR beat (cycle length 782 ms) followed by a PAC (cycle length 454 ms, prematurity index 42%). Origin of the PAC is presumably left-sided. Compared with SR, the PAC provoked 23.4% more LDH and reduced CV by 44.4 cm/s. Right lower panel: recording of a LA location in a 72 year-old male with AVD without history of AF during a SR beat (cycle length 804 ms) followed by a PAC (cycle length 333 ms, prematurity index 59%). Origin of the PAC is presumably left-sided. Compared with SR, the PAC provoked 13.7% more LDH and reduced CV by 9.1 cm/s. AF, atrial fibrillation; AVD, aortic valve disease; BB, Bachmann’s bundle; CABG, coronary artery bypass grafting; CV, conduction velocity; LA, left atrium; LDH, local directional heterogeneities; MVD, mitral valve disease; PAC, premature atrial contraction; PV, pulmonary vein area; RA, right atrium; SR, sinus rhythm.
Five seconds of SR were recorded from every mapping site, including a surface electrocardiogram lead, a calibration signal of 2 mV and 1000 ms, a bipolar reference electrogram (EGM) and all unipolar epicardial EGMs. In patients who presented in AF, SR mapping was performed after electrical cardioversion. Data were stored on a hard disk after amplification (gain 1000), filtering (bandwidth 0.5–400 Hz), sampling (1 kHz) and analogue to digital conversion (16 bits).
Data analysis
Unipolar EGMs were semi-automatically analysed using custom-made software. The steepest negative slope of an atrial potential was marked as the local activation time (LAT). All annotations were manually checked with a consensus of two investigators. Local effective CV was computed from LATs of neighbouring electrodes (longitudinal, transversal and diagonal) using discrete velocity vectors as previously described.3 To avoid the inclusion of far-field potentials, areas corresponding to a mean CV of 0 cm/s were excluded. Areas of slow conduction were defined as the proportion of CV vectors <30 cm/s.6 Dispersion of CV was calculated as the difference between the 5th and 95th percentile of all CV values within one beat. A local CV vector was indicated as directional heterogeneous when the local propagation angle differed more than 50% from the mean of all surrounding local propagation angles and/or the local speed was at least 50% slower than the geometric mean of all surrounding velocities. The mean of the propagation angles was calculated by:
given the angles α1, …, αn. The corresponding geometric mean of the CV magnitudes was calculated by:
The amount of LDH was then calculated as the proportion of all CV vectors. For all parameters, the median of all sinus beats is taken and compared with the median of the PAC; the resulting difference was considered as the potential effect provoked by PACs.
Classification of premature atrial contractions
Premature atrial contractions were defined as beats during SR with a shortening in cycle length (CL) of ≥25% compared with the previous sinus beat measured at the same mapping site.4 The degree of prematurity (prematurity index) was determined for beats preceded by at least two sinus beats, as:
with CLPAC equals the cycle length of the spontaneous PAC and CLSR the cycle length of the preceding two sinus beats.
Statistical analysis
Normally distributed data are expressed as mean ± standard deviation, whereas skewed data are expressed as median (25th–75th percentile). Clinical characteristics were compared using Student’s t-test or Mann–Whitney U test when appropriate. Categorical data are expressed as number (percentage) and analysed with a χ2 or Fisher exact test.
To analyse the difference between SR and PACs, a paired t-test or Wilcoxon signed-rank test was used. The differences were presented as mean [95% confidence interval (CI)]. Correlation was determined by ordinary least squares regression. A P-value <0.05 was considered statistically significant. A Bonferroni correction was applied for comparison of the four atrial regions; a P-value of <0.0083 (0.05/6) was then considered statistically significant.
Results
Study population
Clinical characteristics of the study population [N = 228, 158 male (69%), age 68 ± 10 years] are summarized in Table 1. Patients underwent either CABG [ischaemic heart disease (IHD): N = 93; 41%], aortic valve surgery with or without CABG [(ischaemic) aortic valve disease, (i)AVD: N = 74; 32%], or mitral valve surgery with or without CABG [(ischaemic) mitral valve disease, (i)MVD: N = 61; 27%]. A minority of patients (N = 54; 24%) had a history of AF, which was most prevalent in patients with MVD (N = 30; 56%) compared with patients with AVD (N = 15; 28%) or only IHD (N = 9; 17%).
Baseline characteristics
| Total | No AF | With AF | P-value | |
|---|---|---|---|---|
| Patients | 228 | 174 (76) | 54 (24) | — |
| Male | 158 (69) | 127 (73) | 31 (57) | 0.030 |
| Age (years) | 68 ± 10 (21–84) | 67 ± 11 (21–84) | 71 ± 9 (24–83) | 0.004 |
| Underlying heart disease | ||||
| ȃIHD | 93 (41) | 84 (48) | 9 (17) | <0.001 |
| ȃ(i)VHD | 135 (59) | 90 (52) | 45 (83) | <0.001 |
| ȃȃAVD | 74 (32) | 59 (34) | 15 (28) | 0.707 |
| ȃȃMVD | 61 (27) | 31 (18) | 30 (56) | <0.001 |
| History of AF | 54 (24) | — | 54 (100) | |
| ȃParoxysmal | 36 (16) | — | 36 (67) | |
| ȃ(Longstanding) persistent | 18 (8) | — | 18 (33) | |
| Cardiovascular risk factors | ||||
| ȃ BMI (kg/m2) | 26.6 (24.0–30.1) | 26.6 (24.3–30.0) | 26.7 (22.8–31.3) | 0.310 |
| ȃHypertension | 127 (56) | 91 (53) | 36 (67) | 0.063 |
| ȃDyslipidaemia | 78 (34) | 64 (37) | 14 (26) | 0.142 |
| ȃDiabetes mellitus | 58 (25) | 47 (27) | 11 (20) | 0.328 |
| Left atrial dilation | 70 (31) | 39 (22) | 31 (57) | <0.001 |
| Left ventricular dysfunction | 63 (28) | 46 (26) | 17 (31) | 0.525 |
| Antiarrhythmic drugs | 115 (70) | 97 (71) | 18 (64) | 0.004 |
| ȃClass I | 1 (0) | 1 (1) | 0 (0) | 1.000 |
| ȃClass II | 142 (62) | 112 (64) | 30 (56) | 0.243 |
| ȃ Class III | 12 (5) | 1 (1) | 11 (20) | <0.001 |
| ȃ Class IV | 10 (4) | 8 (5) | 2 (4) | 0.779 |
Values are presented as N (%), mean ± standard deviation (min–max) or median (interquartile ranges). The P-values indicate significance between the no AF and AF group.
AF, atrial fibrillation; AVD, aortic valve disease; BMI, body mass index; IHD, ischaemic heart disease; (i)VHD, (ischaemic and) valvular heart disease; MVD, mitral valve disease.
Characteristics of premature atrial contractions
In total, 503 unique PACs were included for analysis [2 (1–3) PACs per patient]. Most PACs were recorded at the RA (N = 218, 43%) followed by LA (N = 110, 22%), BB (N = 92, 18%) and PVA (N = 83, 17%). Average CLSR was 897 ± 242 ms, while average CLPAC was 483 ± 129 ms, resulting in an average prematurity index of 45 ± 12%. Of all PACs, 351 (70%) were recorded in patients without AF. On average, 2 (1–3) PACs per patient were included in the no AF group, compared with 2 (1–4) PACs per patient in the AF group (P = 0.002).
Figure 1 illustrates four typical examples of SR activation and PACs recorded at the same site. In all recordings, a certain degree of LDH was already present during SR. A spontaneous PAC resulted in an increased amount of LDH and decrease of local effective CV at all atrial regions.
Local directional heterogeneities during sinus rhythm
Figure 2 demonstrates the amount of LDH during SR of all PACs at the various atrial sites. A considerable amount of LDH was already present during SR in 99.2% of the recordings [8.3% (range: 0–36.6%)]. As listed in Table 2, most LDH were found at BB [11.9 (8.3–14.9) %] and LA [11.3 (8.0–15.2) %], compared with PVA [7.3 (4.8–13.3) %] and RA [6.2 (3.2–10.6), P < 0.001 for each]. There was no relation between the amount of LDH, CLSR (P = 0.196) and clinical characteristics, except that more LDH were found in patients with LA dilation [6.5 (3.2–11.9) % vs. 10.0 (4.9–14.5) %, P = 0.003]. Although LDH during was moderately inversely correlated with CV (R2 = 0.584, P < 0.001), 9.3% of all LDH sites had a CV >90 cm/s. There was on average 3.8 (2.6–5.3) cm/s variability in CV between SR beats on the same location.
![Differences in local directional heterogeneities. The degree of local directional heterogeneities of CV vectors during SR (turquoise/left) and PAC (red/right). The difference [Δ (PAC-SR)] between SR and PAC is visualized as median with interquartile range. *P < 0.05. BB, Bachmann’s bundle; CV, conduction velocity; LA, left atrium; LDH, local directional heterogeneities; PAC, premature atrial contraction; PVA, pulmonary vein area; RA, right atrium; SR, sinus rhythm.](https://oup.silverchair-cdn.com/oup/backfile/Content_public/Journal/europace/25/3/10.1093_europace_euac283/1/m_euac283f2.jpeg?Expires=1748580802&Signature=i0FktlVXi3c30LQ~EFjDVpkPDfdNspNipWwDWXtfAXLQ8Xq36VADuDWUusGzqpxLplbY2f2W5qI9M5ccwhESIDnntZWC6briUI~bRSjx8PaL3LlEFlhn4UpID3j-RC1MWfeTRXXet4fgoKTsnkmcj3FfGK8LQDayzD6US5qEsv9E8HGKXBRHZ8fn1f-qWkq9EtBJSZwO364VYrAyNNLw4TWT8bfSedkESf8tJRgYl-fbJaKDA5eBYV-HCcYhUi-ZOzUUj7mojOEZSZdbqcsPdKJ7iqpY~lzIW2Q6VYP8lYWO3vtnzrVhuOyH8ek1gH8PiExhkZVhmXYatKQeRQ-Jog__&Key-Pair-Id=APKAIE5G5CRDK6RD3PGA)
Differences in local directional heterogeneities. The degree of local directional heterogeneities of CV vectors during SR (turquoise/left) and PAC (red/right). The difference [Δ (PAC-SR)] between SR and PAC is visualized as median with interquartile range. *P < 0.05. BB, Bachmann’s bundle; CV, conduction velocity; LA, left atrium; LDH, local directional heterogeneities; PAC, premature atrial contraction; PVA, pulmonary vein area; RA, right atrium; SR, sinus rhythm.
Incidence of local directional heterogeneities (%)
| SR | PAC | Δ (PAC-SR) | P-value | |
|---|---|---|---|---|
| All beats | 8.3 (4.8–13.2) | 20.3 (16.1–25.8) | +11.7 (11.1, 12.4) | <0.001 |
| RA | 6.2 (3.2–10.6) | 18.7 (14.8–24.2) | +11.9 (11.0, 12.8) | <0.001 |
| BB | 11.9 (8.3–14.9) | 24.2 (21.6–28.2) | +13.2 (11.5, 14.9) | <0.001 |
| PVA | 7.3 (4.8–11.3) | 20.2 (16.5–26.6) | +12.7 (11.0, 14.4) | <0.001 |
| LA | 11.3 (8.0–15.2) | 20.0 (16.3–25.1) | +9.4 (7.9, 10.9) | <0.001 |
SR and PAC values are presented as median (interquartile ranges), Δ (PAC-SR) as mean (95% CI).
BB, Bachmann’s bundle; LA, left atrium; PAC, premature atrial contraction; PVA, pulmonary vein area; RA, right atrium; SR, sinus rhythm.
Impact of premature atrial contractions on conduction velocity
As demonstrated in Figure 3, CV decreased from 89.8 (77.9–98.4) cm/s during SR to 80.1 (70.7–89.6) cm/s during PACs [−8.5 (95% CI: −9.6, −7.3) cm/s, P < 0.001]. The 33% most premature PACs had a larger decrease in CV compared with the 33% least premature PACs [−10.4 (95% CI: −12.3, −8.6) cm/s vs. −6.8 (95% CI: −8.9, −4.8) cm/s, P = 0.007].
![Differences in local conduction velocity. Local CV during SR (turquoise/left) and PAC (red/right). The difference [Δ (PAC-SR)] between SR and PAC is visualized as median with interquartile range. * P < 0.05. BB, Bachmann’s bundle; CV, conduction velocity; LA, left atrium; PAC, premature atrial contraction; PVA, pulmonary vein area; RA, right atrium; SR, sinus rhythm.](https://oup.silverchair-cdn.com/oup/backfile/Content_public/Journal/europace/25/3/10.1093_europace_euac283/1/m_euac283f3.jpeg?Expires=1748580802&Signature=LiWc0RmioEbevosKHVXjbPMZcd0xJc~DeEkvgTblnS1uVBHh-s3CYYhYzwsfsphp-r3mW9YhNGZLrzc7VDj00YCE6hpRHOkf9OKNzE~w5um4ztbmWbcFq3L3rHvRt-r-qAU21eZoITJ6Y5IiD0PfxBEBVkNBlI06mBeVpukiAI~Y0YtwlRS0akYCWRK462xg-bmE18ViL2pL0x62M-tLdrHdEy1Nf4Hw7t8xaKuUjgo2gwLDL4u82dI-Mc8XakSCK4pcmpkqHUilCWPGJiHybN~7kG9NhlG1HUc6yjYDv8zKic1Shk0wmXPbjdiInQ02zTGkK5Qwlg5D-20WrmOd1w__&Key-Pair-Id=APKAIE5G5CRDK6RD3PGA)
Differences in local conduction velocity. Local CV during SR (turquoise/left) and PAC (red/right). The difference [Δ (PAC-SR)] between SR and PAC is visualized as median with interquartile range. * P < 0.05. BB, Bachmann’s bundle; CV, conduction velocity; LA, left atrium; PAC, premature atrial contraction; PVA, pulmonary vein area; RA, right atrium; SR, sinus rhythm.
Interregional differences in CV between SR and PACs are listed in Table 3. Although CV decreased during PACs at all regions (all P < 0.001), there were no interregional differences in CV reduction (P = 0.168). The largest CV reductions were found at BB [−10.0 (95% CI: −13.2, −6.9) cm/s], followed by PVA [−9.3 (95% CI: −12.5, −6.2) cm/s], LA [−9.1 (95% CI: −11.7, −6.6) cm/s] and RA [−7.2 (95% CI: −8.7, −5.7) cm/s].
Effect of PAC on conduction velocity
| SR | PAC | Δ (PAC-SR) | P-value | |
|---|---|---|---|---|
| CV (cm/s) | ||||
| All beats | 89.8 (77.9–98.4) | 80.1 (70.7–89.6) | −8.5 (−9.6, −7.3) | <0.001 |
| RA | 88.4 (77.9–97.2) | 79.9 (71.4–89.6) | −7.2 (−8.7, −5.7) | <0.001 |
| BB | 83.5 (72.4–94.3) | 72.8 (63.1–84.1) | −10.0 (−13.2, −6.9) | <0.001 |
| PVA | 95.3 (85.3–102.8) | 83.3 (72.4–92.3) | −9.3 (−12.5, −6.2) | <0.001 |
| LA | 94.2 (84.0–100.3) | 82.2 (74.5–89.6) | −9.1 (−11.7, −6.6) | <0.001 |
| Dispersion—P95-P5 | ||||
| All beats | 97 (83–111) | 123 (113–134) | +27 (25, 29) | <0.001 |
| RA | 87 (69–100) | 117 (107–128) | +33 (31, 36) | <0.001 |
| BB | 101 (94–113) | 125 (118–135) | +24 (19, 28) | <0.001 |
| PVA | 95 (88–110) | 127 (117–138) | +27 (22, 32) | <0.001 |
| LA | 114 (103–123) | 128 (117–138) | +17 (13, 20) | <0.001 |
| CV <30 cm/s (%) | ||||
| All beats | 2.1 (0.5–4.9) | 8.5 (4.9–13.0) | +6.3 (5.8, 6.8) | <0.001 |
| RA | 1.1 (0–4.5) | 6.8 (4.3–11.3) | +5.7 (5.1, 6.4) | <0.001 |
| BB | 3.7 (1.7–7.6) | 12.4 (8.0–17.9) | +7.5 (6.2, 8.8) | <0.001 |
| PVA | 1.6 (0–3.8) | 9.0 (6.0–13.9) | +7.4 (6.1, 8.7) | <0.001 |
| LA | 2.4 (0.9–3.8) | 7.6 (4.9–11.2) | +5.7 (4.6, 6.9) | <0.001 |
SR and PAC values are presented as median (interquartile ranges), Δ (PAC-SR) as mean (95% CI).
BB, Bachmann’s bundle; CV, conduction velocity; LA, left atrium; PAC, premature atrial contraction; PVA, pulmonary vein area; RA, right atrium; SR, sinus rhythm.
During PACs, particularly at RA, BB and PVA, there was more dispersion of CV [+33 (31, 36), +24 (19, 28) and +27 (22, 32), respectively, P < 0.001 for each]. Also, there were more areas of slow conduction at all atrial regions, but specifically at BB [12.4 (8.0–17.9) %, P < 0.001].
Impact of premature atrial contractions on local directional heterogeneities
In 94% of PACs, more LDH [8.3 (4.8–13.2) % vs. 20.3 (16.1–25.8) %, P < 0.001] were found during PACs compared with SR. The 33% most premature PACs had a larger increase in LDH compared with 33% least premature PACs [+12.6 (95% CI: 11.6, 13.7) % vs. +11.6 (95% CI: 10.4, 12.4) %, P = 0.049]. There was a very strong correlation between the amount of LDH and CV during PACs (R2 = 0.811, P < 0.001). On average, there was a 50.0 (37.2–62.5) % overlap of LDH areas during PAC with LDH areas during SR.
The largest increase in LDH during PAC was found at BB and PVA [+13.0 (95% CI: 7.7, 18.3) % and +12.5 (95% CI: 10.8, 14.2) %, all P < 0.001]. As already a considerable amount of LDH was found at BB during SR, most LDH during PAC were also found at BB [23.9 (21.5–28.0) %]. There were no regional differences in the amount of overlap of LDH areas during PAC and SR [RA: 50.0 (38.6–64.7) %; BB: 50.0 (37.8–60.2) %; PVA: 44.4 (33.3–59.8) %; LA: 48.1 (40.0–62.4) %, P = 0.102].
Influence of atrial fibrillation episodes
Differences in LDH and effective CV between patients with and without AF are listed in Table 4. Compared with patients without AF, more LDH were found during SR in AF patients at PVA and BB [5.9 (4.8–9.1) % vs. 9.7 (4.9–14.5) % and 9.8 (6.0–16.5) % vs. 13.0 (11.9–14.5) %, respectively, P = 0.031 and P = 0.085], as shown in Figure 4. Also, CV at these atrial sites during SR in AF patients was lower [99.2 (92.1–105.9) cm/s vs. 86.2 (79.0–95.8) cm/s and 84.8 (76.8–94.6) cm/s vs. 72.8 (67.6–88.7) cm/s, respectively, P = 0.003 and P = 0.054] and there were more areas of slow conduction [0.9 (0–2.5) % vs. 2.5 (0.5–6.7) % and 3.3 (1.6–6.5) % vs. 6.9 (2.7–8.7) % respectively, P = 0.049 and P = 0.072].
![Local conduction parameters in patients with and without AF. The degree of LDH (A) and CV (B) during SR in patients without (turquoise/left) and with AF (red/right). The difference [Δ (PAC-SR)] between SR and PAC is visualized as median with interquartile range. *P < 0.05. AF, atrial fibrillation; BB, Bachmann’s bundle; CV, conduction velocity; LA, left atrium; LDH, local directional heterogeneities; PAC, premature atrial contraction; PVA, pulmonary vein area; RA, right atrium; SR, sinus rhythm.](https://oup.silverchair-cdn.com/oup/backfile/Content_public/Journal/europace/25/3/10.1093_europace_euac283/1/m_euac283f4.jpeg?Expires=1748580802&Signature=ac0hVfgtkEm4Is5GJlt2QHs5umA40TPP8Zirw1uccyeKPuAt4xYO--ZwFxR~jK3JMXzvOJch1kvcepDqRmDK0LFPNnZ-lvQZgIs29lShecS6tnhIXqQCgfz~OIomq2ktxNPP4~VbPKMXH247EJmcjh3oOqqhsBVz5TS7qp-fa4PihTpwbo1Skv9i2eE2GE5CZLDEqpH0LO--BzB6JFCi2-cgF2GonNzlbxJj28q~ZldH~vdRIkbIn1pusJGfKLqGf6DAr0fdMrxH9JUeeWm7beDnFRFaEM1LlYfOVM3rywjcdPrSi2m8rl0uKy-xC6EhhejkVrg8sr5EdLv01wwEKQ__&Key-Pair-Id=APKAIE5G5CRDK6RD3PGA)
Local conduction parameters in patients with and without AF. The degree of LDH (A) and CV (B) during SR in patients without (turquoise/left) and with AF (red/right). The difference [Δ (PAC-SR)] between SR and PAC is visualized as median with interquartile range. *P < 0.05. AF, atrial fibrillation; BB, Bachmann’s bundle; CV, conduction velocity; LA, left atrium; LDH, local directional heterogeneities; PAC, premature atrial contraction; PVA, pulmonary vein area; RA, right atrium; SR, sinus rhythm.
Influence of AF episodes on local conduction
| SR | Δ (PAC-SR) | |||||
|---|---|---|---|---|---|---|
| No AF | With AF | P-value | No AF | With AF | P-value | |
| LDH (%) | ||||||
| All beats | 8.3 (4.7–12.5) | 8.5 (4.9–14.5) | 0.120 | +11.7 (10.9, 12.5) | +11.8 (10.5, 13.1) | 0.434 |
| RA | 6.4 (2.8–10.9) | 5.3 (3.4–8.2) | 0.382 | +12.0 (10.9, 13.0) | +11.6 (9.7, 13.4) | 0.428 |
| BB | 9.8 (6.0–16.5) | 13.0 (11.9–14.5) | 0.085 | +13.9 (8.2, 19.1) | +11.7 (8.7, 14.7) | 0.182 |
| PVA | 5.9 (4.8–9.1) | 9.7 (4.9–14.5) | 0.031 | +11.8 (9.9, 13.7) | +13.5 (10.8, 16.2) | 0.121 |
| LA | 11.7 (8.3–15.1) | 10.5 (6.6–15.3) | 0.301 | +9.1 (7.2, 11.0) | +10.1 (7.6, 12.6) | 0.259 |
| CV (cm/s) | ||||||
| All beats | 89.6 (77.7–98.7) | 89.9 (80.0–98.3) | 0.473 | −8.8 (−10.1, −7.4) | −7.8 (−10.0, −5.6) | 0.451 |
| RA | 87.2 (76.5–95.1) | 90.7 (84.7–98.8) | 0.080 | −6.9 (−8.6, −5.3) | −8.2 (−11.6, −4.8) | 0.288 |
| BB | 84.8 (76.8–94.6) | 72.8 (67.6–88.7) | 0.054 | −11.9 (−15.4, −8.5) | −6.1 (−12.5, 0.4) | 0.055 |
| PVA | 99.2 (92.1–105.9) | 86.2 (79.0–95.8) | 0.003 | −10.9 (−15.4, −6.4) | −8.0 (−12.5, −3.6) | 0.186 |
| LA | 93.4 (77.2–100.9) | 94.3 (90.2–98.4) | 0.206 | −9.4 (−12.8, −6.0) | −8.6 (−12.2, −5.0) | 0.302 |
| CV dispersion—P95-P5 | ||||||
| All beats | 97 (82–110) | 93 (84–114) | 0.457 | 27 (25, 30) | 25 (22, 28) | 0.433 |
| RA | 87 (69–102) | 84 (69–95) | 0.277 | 33 (30, 36) | 33 (21, 15) | 0.450 |
| BB | 101 (95–113) | 97 (84–112) | 0.069 | 26 (21, 31) | 19 (12, 25) | 0.047 |
| PVA | 96 (90–104) | 92 (88–112) | 0.447 | 30 (23, 36) | 25 (18, 31) | 0.254 |
| LA | 112 (103–121) | 117 (100–125) | 0.366 | 14 (10, 18) | 21 (15, 28) | 0.033 |
| CV <30 cm/s (%) | ||||||
| All beats | 1.7 (0.5–4.8) | 2.4 (0.8–6.5) | 0.151 | +6.4 (5.8, 6.9) | +6.2 (5.2, 7.2) | 0.088 |
| RA | 1.0 (0–4.9) | 1.6 (0–2.6) | 0.308 | +5.7 (4.9, 6.5) | +5.8 (4.7, 6.8) | 0.257 |
| BB | 3.3 (1.6–6.5) | 6.9 (2.7–8.7) | 0.072 | +8.5 (7.2, 9.8) | +5.4 (2.3, 8.5) | 0.024 |
| PVA | 0.9 (0–2.5) | 2.5 (0.5–6.7) | 0.049 | +6.4 (4.9, 7.9) | +8.2 (6.2, 10.2) | 0.135 |
| LA | 2.5 (1.1–3.5) | 2.4 (0.8–5.9) | 0.386 | +6.1 (4.7, 7.5) | +5.0 (3.0, 6.9) | 0.041 |
SR and PAC values are presented as median (interquartile ranges), Δ (PAC-SR) as mean (95% CI).
AF, atrial fibrillation; BB, Bachmann’s bundle; CV, conduction velocity; LA, left atrium; LDH, local directional heterogeneity; PAC, premature atrial contraction; PVA, pulmonary vein area; RA, right atrium; SR, sinus rhythm.
The effect on LDH provoked by PACs was comparable between patients with and without AF. However, PACs in patients without AF resulted in a larger drop in CV [−11.9 (−15.4, −8.5) cm/s vs. −6.1 (−12.5, 0.4) cm/s, P = 0.055] and more areas of slow conduction [+8.5 (7.2, 9.8) % vs. +5.4 (2.3, 8.5) %, P = 0.024] at BB. As CV during SR was already lower at BB in AF patients and the drop in CV only modest, CV during PAC at BB was comparable between both patient groups [no AF: 73.1 (64.0–84.1) cm/s vs. with AF: 70.2 (59.9–81.3) cm/s, P = 0.160]. At PVA, CV during PAC in AF patients was lower compared with patients without AF [no AF: 84.5 (78.8–92.9) cm/s vs. with AF: 80.8 (66.4–92.3) cm/s, P = 0.023].
Discussion
Local directional heterogeneity is a novel methodology to quantify local heterogeneity in CV as a possible indicator of electropathology in atrial tissue. By applying this methodology on high-resolution maps, we demonstrated that during SR, LDH is most pronounced at BB and the LA. Furthermore, PACs enhance the degree of LDH and reduce CV, especially PACs with a higher degree of prematurity. These differences were particularly located at BB and the PVA. Also, patients with AF already have more LDH and slower CV during SR, which becomes more pronounced during PACs.
Estimation of local conduction velocity
The effective CV is frequently used in clinical practice as it provides important information on the underlying myocardium. Calculation of CV is often empirically determined based on relative distances and time differences derived from activation maps, which requires that the direction of activation is known. Several techniques including polynomial surface fitting, triangulation and finite differences have been introduced over the years.7 However, recently we demonstrated that these techniques smoothen wavefront propagation thereby masking areas of local conduction slowing or wavefront distortion.3 We, therefore, developed a novel methodology that is able to estimate CV without smoothing of wavefront propagation resulting in estimation of local ‘effective’ CV indicative of the underlying local substrate. In the present study, we further developed this methodology by implementing spatial variation in both direction and magnitude of velocity vectors. We demonstrated, as expected, that a certain degree of LDH is already present during SR. Local directional heterogeneity was particularly pronounced at BB and LA. Local directional heterogeneity severity even further increased during PACs. This implies that CV vector fields become more locally directional heterogeneous, indicating local areas of impaired conduction.
Local conduction heterogeneity
Wavefront propagation occurs preferentially and faster along the longitudinal direction to the myocardial fibre orientation.1 Wavefront propagation along the transverse direction of myocardial bundles is therefore slower, which is known as anisotropy. Besides anisotropy, atrial CV also depends on source-to-sink principles, in which conduction slows down when a small bundle has to excite a relatively large myocardial area.8 Remodelling of cellular connections and tissue damage gives rise to an arrhythmogenic substrate.9 This may result in a non-uniform distribution of anisotropic features of myocardial tissue, leading to dissociated conduction with slower CV. Wavefronts conducting across this heterogeneous atrial myocardium can therefore be locally distorted, which can be measured as local irregularities in CV vector maps.
Previous studies focusing on heterogeneity in conduction mainly used distribution of conduction times (LAT differences between neighbouring electrodes), the amount of conduction disorders (e.g. percentage of conduction delay/block), median CV and CV dispersion (P95-P5).6,10–12 However, several parameters only include interelectrode LAT differences without considering the direction of wavefront propagation. Conduction velocity vectors, however, do include the spatial information from which a vector is constructed, although only information on the speed of vectors is mainly used for analysis. In addition, many studies use LAT or conduction times distribution histograms to describe conduction heterogeneity, in which none or only one neighbouring electrode is included.6,10–12 In the present study, we used both the speed and local direction of CV vectors with respect to all neighbouring electrodes to identify areas of heterogeneous conduction.
Atrial fibrillation-related structural and electrical remodelling also affects intra-atrial CV. In a previous study focusing on 412 patients with and without AF, we demonstrated a reduction in CV in AF patients at BB.3 In a case–control study including 34 patients, Heida et al.6 also demonstrated that there were no differences in CV dispersion (P5-P95) between patients with and without AF. Recently, Frontera et al.13 demonstrated a progressive reduction in CV during SR and increase in slow CV (<50 cm/s) areas in 20 AF patients at LA, while there were no differences CV dispersion (coefficient of variation) compared with patients without AF. In the present study, we demonstrated that LDH were specifically present at BB and LA. As BB has predominantly parallel aligned muscle bundles, disruption of cell-to-cell connections can easily lead to disturbed wavefront geometry and increased LDH. Histological examination of 10 hearts from patients with paroxysmal AF and 10 hearts from patients without AF indeed demonstrated that fibro-fatty tissue was much more extensive in AF patients.14 We also found a considerable amount of LDH in the LA, which is composed of multiple layers of differently aligned myocardial fibres with marked regional variations in thickness and orientation.15 The degree of LDH was smallest in the RA which may be explained by the abundancy of transmural criss-crossing arrangement of smaller muscle fibres in between the larger trabeculations.16 Small heterogeneities in conduction may therefore be embedded within passing wavefronts via other bundles and could make the RA less sensible for interruptions in propagation of broad wavefronts.
Arrhythmogenicity of premature atrial contractions
Several studies demonstrated that PACs lead to an increased amount of conduction disorders and endo-epicardial asynchrony.4,5 Wavefront propagation during PACs mainly slows along the perpendicular direction of the myocardial fibres, thereby increasing anisotropic conduction.17,18 Especially in non-uniform anisotropic tissue, conduction disorders are directional and frequency dependent. As PACs originate from other areas than the sino-atrial node, wavefronts often propagate via alternative routes and with abnormal timing, thereby increasing the amount of conduction disorders. When PACs occur, they may aggravate dispersion in refractoriness which provokes conduction disorders, especially PACs with high prematurity.19 When aberrant PACs occur during SR, a change in wavefront propagation direction may unmask conduction disorders due to anisotropic features of atrial myocardium.4 The severity of conduction disorders in areas of transverse conduction are also related to clustered fibrosis, which results in more localized PAC-induced conduction disorders compared with non-fibrotic areas.17,18 Hence, both prematurity and aberrancy cause areas of slowed conduction, localized conduction heterogeneity and conduction block, which is associated with initiation of reentry.
As the amount of LDH and CV decrease was related to the degree of prematurity, PACs with a CL close to the refractory period will probably provide the arrhythmogenic substrate initiating atrial tachyarrhythmias such as AF. In our present study, the average CLPAC was longer than the functional refractory period of 270 ± 30 ms which was measured in the RA during electrophysiological studies.20 It is expected that PACs near the refractory period will cause even more conduction slowing and LDH, making AF onset more likely. Although in our study PACs did not initiate AF, the increase of LDH observed in PACs add to arrhythmogenic tissue properties that underlie arrhythmia.
Limitations
Atrial tachyarrhythmias were not initiated by the PACs in this study, as is the case for most PACs, and most patients also did not have a history of AF. The arrhythmogenic effect of PACs could only be studied at one single mapping site and not at multiple atrial regions simultaneously. Consequently, the origin of each PAC and the effect on multiple atrial sites simultaneously remain unknown. Furthermore, any possible effects of endo-epicardial asynchrony on the amount of LDH cannot be excluded.
Conclusions
Local directional heterogeneity is a novel methodology to quantify local heterogeneity in CV as a possible indicator of electropathology. Intra-operative high-resolution mapping indeed revealed that LDH increased and CV decreased during PACs, particularly at BB and PVA. Also, patients with AF already have more LDH and slower conduction at PVA and BB during SR, which becomes even more pronounced during PACs.
Acknowledgements
The authors would like to kindly thank A.J.J.C. Bogers, MD, PhD; J.A. Bekkers, MD, PhD; C. Kik, MD: W.J. van Leeuwen, MD; F.B.S. Oei, MD, PhD; P.C. van de Woestijne, MD; F.R.N. van Schaagen, MD; A. Yaksh, MD, PhD; E.A.H. Lanters, MD, PhD; C.P. Teuwen, MD, PhD; E.M.J.P. Mouws, MD, PhD; J.M.E. van der Does, MD, PhD; C.A. Houck, MD, PhD; R. Starreveld, PhD; C.S. Serban, DVM; L.N. van Staveren, MD; A. Heida, MD; W.F.B. van der Does, MD; M.C. Roos-Serote, PhD; for their contribution to this work.
Funding
N.M.S.d.G., is supported by funding grants from Nederlandse Organisatie voor Wetenschappelijk Onderzoek-Vidi (grant number 91717339), Biosense Webster USA (ICD 783454) and Medical Delta.
Data availability
The data underlying this article will be shared on reasonable request to the corresponding author.
References
Author notes
Conflict of interest: None declared.
