


Abstract
We aimed to examine whether routine pulmonary vein isolation (PVI) induces significant ventricular repolarization changes as suggested earlier.
Five-minute electrocardiograms were recorded at hospital’s admission (T−1d), 1 day after the PVI-procedure (T+1d) and at 3 months post-procedure (T+3m) from a registry of consecutive atrial fibrillation (AF) patients scheduled for routine PVI with different PVI modalities (radiofrequency, cryo-ablation, and hybrid). Only patients who were in sinus rhythm at all three recordings (n = 117) were included. QT-intervals and QT-dispersion were evaluated with custom-made software and QTc was calculated using Bazett’s, Fridericia’s, Framingham’s, and Hodges’ formulas. Both QT- and RR-intervals were significantly shorter at T+1d (399 ± 37 and 870 ± 141 ms) and T+3m (407 ± 36 and 950 ± 140 ms) compared with baseline (417 ± 36 and 1025 ± 164 ms). There was no statistically significant within-subject difference in QTc Fridericia (T−1d 416 ± 28 ms, T+1d 419 ± 33 ms, and T+3m 414 ± 25 ms) and QT-dispersion (T−1d 18 ± 12 ms, T+1d 21 ± 19 ms, and T+3m 17 ± 12 ms) between the recordings. A multiple linear regression model with age, sex, AF type, ablation technique, first/re-do ablation, and AF recurrence to predict the change in QTc at T+3m with respect to QTc at T−1d did not reach significance which indicates that the change in QTc does not differ between all subgroups (age, sex, AF type, ablation technique, first/re-do ablation, and AF recurrence).
Based on our data a routine PVI does not result in a prolongation of QTc in a real-world population. These findings, therefore, suggest that there is no need to intensify post-PVI QT-interval monitoring.
Pulmonary vein isolation (PVI) increases heart rate.
PVI (with possible unintentional modulation of the ganglionated plexi) does not prolong QTc.
QT-dispersion does not change as a result of PVI.
Based on our data, an intensified post-PVI QT-interval monitoring is not necessary.
Introduction
Pulmonary vein isolation (PVI) is the cornerstone of atrial fibrillation (AF) treatment1,2 and the most performed ablation procedure worldwide. It has been shown that a small number of AF patients develop ventricular arrhythmias after PVI.3,4 This might be caused by unintentional modulation of atrial ganglionated plexi (GP) during PVI since atrial GP harbour parasympathetic neurons5–8 and impaired parasympathetic activity is known to increase the risk of ventricular arrhythmias.9,10 An experimental study in murine hearts, for example, showed that mechanical disruption or pharmacological blockade of parasympathetic innervation shortened ventricular effective refractory periods and increased susceptibility to ventricular arrhythmias induced by programmed stimulation.11 Another experimental study in canine hearts, also showed an increased susceptibility to ventricular arrhythmias after targeted GP ablation.12 Furthermore, unintentional partial atrial denervation caused by modulation of the GP is known to increase heart rate13,14 but might also affect ventricular electrophysiology.3,4,8,11,12,15
Recently, Chikata et al.16 studied the effect of PVI on the QT-interval and QT-interval corrected for heart rate (QTc) and showed that both the raw QT-interval as well as QTc were significantly prolonged after PVI. This finding implies that QT-interval monitoring should possibly be part of routine PVI follow-up. However, Chikata et al.16 only included ablation naive paroxysmal AF patients who did not use anti-arrhythmic drugs. The objective of this study therefore is to examine whether a PVI also prolongs repolarization characteristics in a real-world population.
Methods
Study population
All data used in this study were gathered from a registry of consecutive AF patients scheduled for PVI at the Maastricht University Medical Centre. Inclusion criteria of the registry were: documented AF; ≥18 years of age; scheduled for an AF-ablation and able and willing to provide informed consent. All patients were treated according to clinical routine so that the study population reflects the ‘real-world’ PVI patient population. The only exclusion criteria were pathologies that possibly influence the QT-interval (e.g. left/right bundle branch block, ventricular paced rhythms, etc.) including AF during one of the electrocardiogram (ECG) measurements since an irregular ventricular rhythm also affects the QT-interval. Anti-arrhythmic drugs and/or β-blockers were continued and doses remained unchanged during all recording times since patients did not visit the outpatient clinic before the ECG recording at 3 months. We therefore assume that any change in QT-interval is caused by the PVI. Written informed consent was obtained from every patient and the study protocol was approved by the hospital’s ethics committee.
Ablation procedure
All patients included in the registry received a routine AF-ablation procedure following institution’s protocols. The technique used for PVI was either a wide antral circular ablation using radiofrequency (RF) energy, a cryoablation using the cryoballoon or a hybrid procedure. The hybrid procedures were one-stage procedures consisting of surgical bipolar PVI with box lesions followed by transvenous endocardial validation and touch up. The decision which technique was performed was at the treating physician’s discretion and was based on medical indication and the physician’s preference.
Electrocardiogram recordings and analysis
As part of the registry, patients received a 5-min long 12-lead ECG recording at hospital admission (T−1d), 1 day after the procedure (T+1d), and at the first routine outpatient clinic visit at 3 months post-procedure (T+3m). Only patients who were in sinus rhythm during all three ECG recordings were included in the study. Hospital admission typically was on the day before or morning of the procedure. The ECG at T+1d was performed on the evening or morning after the procedure. ECGs were recorded for 5 min using the Cam-USB (GE Healthcare, Piscataway, NJ, USA) or YRS100 ECG-system (YourRhythmics, Maastricht, The Netherlands) with a 500 and 2000 Hz sample frequency, respectively. Electrocardiograms were stored for offline analysis using Matlab 2018a (Mathworks, Natick, MA, USA).
To improve signal-to-noise ratio, a median complex was constructed for all individual ECG leads from individual complexes aligned on the R-peak after filtering and up/down-sampling to 1000 Hz. The R-peak, QRS-onset, and T-wave end were detected using our previously described algorithms.17 In short, the R-peak was detected on the root mean square of the ECG (ECGRMS) using the Pan–Tompkins algorithm.18 The onset of the QRS-complex was defined as the largest positive peak in the second derivative of the ECGRMS preceding the R-peak. The end of the T-wave was detected by means of an automated tangent method.17 All landmarks and median complexes were checked manually and edited or deleted when necessary. QTc was calculated using Fridericia’s, Hodges’, Framingham’s, and Bazett’s formula. If not mentioned differently, QTc Fridericia is reported since its correction is the most accurate heart rate correction.19,20 QT-dispersion over all 12 leads was calculated as the difference between the latest and earliest T-wave end between ECG leads of the median complex.
Atrial fibrillation recurrence was measured using a questionnaire at 12 months post-PVI. Patients who reported to have suffered from AF symptoms after the ablation were counted as AF recurrence.
Statistical methods
All continuous variables are presented as mean ± standard deviation and categorical variables are presented as frequencies and percentages. QTc, QT-, and RR-intervals obtained at the three different ECG recording times were compared using repeated-measures ANOVA with Bonferroni post hoc correction for comparison between means. The influence of age, sex, AF type (paroxysmal or persistent), ablation technique (cryo, RF), first or re-do procedure, and self-reported AF recurrence at 12 months post-PVI on the changes in QTc were studied using a multilevel linear regression analysis. All patients with missing data were excluded from the multiple linear regression analysis to avoid missing data. A P-value of <0.05 was considered statistically significant.
Results
Study population
Out of 279 patients included in the registry, 117 (42%) met the inclusion criteria and were included in this study. Their mean age was 63 ± 8 years, 48 (41%) were female and 88 (75%) had paroxysmal AF while the other 29 (25%) had persistent AF. Most patients (n = 78; 67%) were treated using cryoballoon. The remaining patients were treated with RF (n = 34; 29%) or with a hybrid approach (n = 5; 4%). The majority of this cohort was ablation naive patients (n = 94; 80%). The response rate of the questionnaire was 75% (n = 88). From these 88 patients, 40 (45%) did not experience AF symptoms, 36 (41%) did experience AF symptoms, and 12 (14%) were unsure if they experienced AF symptoms since the procedure. Study population characteristics are further summarized in Table 1.
Patient characteristics
| Range or percentage | n | |||
|---|---|---|---|---|
| General | Age (years) | 63 ± 8 | 43–78 | 117 |
| Female (n, %) | 48 | 41 | 117 | |
| Height (cm) | 175 ± 10 | 150–196 | 116 | |
| Body weight (kg) | 85 ± 14 | 50–125 | 115 | |
| Body mass index (kg/m2) | 27.7 ± 4.5 | 19.1–44.3 | 115 | |
| AF type | Paroxysmal AF (n, %) | 88 | 75 | 117 |
| Persistent AF (n, %) | 29 | 25 | 117 | |
| Diagnosis of AF (years) | 6 ± 7 | 0–50 | 115 | |
| Ultrasound | LVEF (%) | 58 ± 7 | 25–71 | 109 |
| LA diameter (mm) | 42 ± 5 | 28–51 | 95 | |
| LA volume (mL) | 84 ± 23 | 38–151 | 90 | |
| RA volume (mL) | 57 ± 23 | 19–141 | 79 | |
| Comorbidities | Heart failure | 8 | 7 | 112 |
| Hypertension | 63 | 54 | 117 | |
| Diabetes mellitus | 9 | 8 | 117 | |
| Stroke | 14 | 13 | 106 | |
| Vascular disease | 14 | 14 | 102 | |
| CHA2DS2-VASc-score (n, %) | 117 | |||
| 0 | 23 | 20 | ||
| 1 | 27 | 23 | ||
| ≥2 | 67 | 57 | ||
| Drug use | Any AAD (n, %) | 65 | 56 | 117 |
| Amiodarone (n, %) | 9 | 8 | 109 | |
| Flecainide (n, %) | 29 | 27 | 106 | |
| Digoxin (n, %) | 14 | 13 | 109 | |
| Sotalol (n, %) | 32 | 29 | 109 | |
| Other β-blockers (n, %) | 40 | 34 | 117 |
AF, atrial fibrillation; AAD, anti-arrhythmic drug; LA/RA, left/right atrium; LVEF, left ventricular ejection fraction.
Influence of pulmonary vein isolation on QT, RR, and QTc
Table 2 shows the mean QT-intervals, RR-intervals as well as QTc Fridericia, Bazett, Framingham, and Hodges at the three different time points. Figure 1 shows the absolute QT-intervals, RR-intervals and QTc Fridericia (left) as well as their change relative to T−1d (right). Absolute QTc Hodges and QTc Framingham are shown in Supplementary material online, Figure S1. There was a statistically significant within-subjects difference in QT- and RR-intervals between the three recording times determined by a repeated measures ANOVA (P < 0.001). The results of the Bonferroni post-hoc tests, shown in Table 3, show that the QT- and RR-intervals were shortest at T+1d and longest at T−1d. There was no statistically significant within-subject difference in QTc Fridericia, QTc Hodges, and QTc Framingham between the recordings. QTc Bazett was significantly prolonged at T+1d but recovered at T+3m.
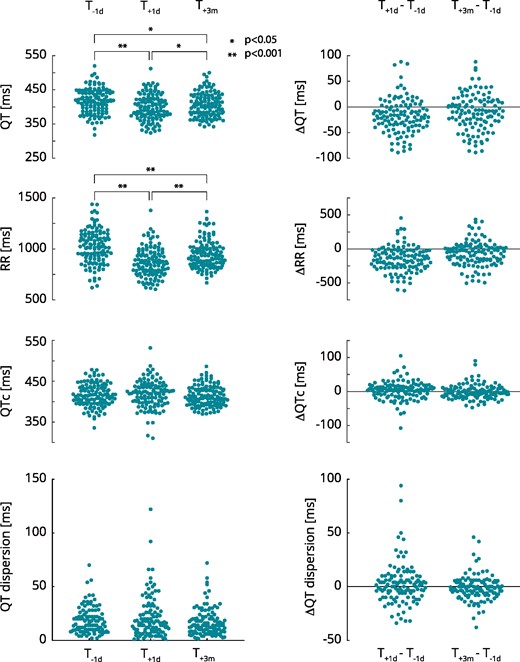
QT-, RR-intervals, QTc, and QT dispersion before and after pulmonary vein isolation. *P < 0.05; **P < 0.001. QTc, QT corrected for heart rate using Fridericia’s formula; T−1d, 1 day prior to the procedure; T+1d, 1 day post-procedure; T+3m, 3 months post-procedure.
Mean intervals at the three timepoints T−1d, T+1d, and T+3m
| T−1d | T+1d | T+3m | |
|---|---|---|---|
| QT-interval | 417 ± 36 | 399 ± 37** | 407 ± 36** |
| RR-interval | 1025 ± 164 | 870 ± 141** | 950 ± 140** |
| QTc Fridericia | 416 ± 28 | 419 ± 33 | 414 ± 25 |
| QTc Bazett | 415 ± 30 | 430 ± 35** | 418 ± 24 |
| QTc Hodges | 418 ± 28 | 417 ± 31 | 414 ± 26 |
| QTc Framingham | 413 ± 29 | 419 ± 32 | 414 ± 24 |
| QT-dispersion | 18 ± 12 | 21 ± 19 | 17 ± 12 |
Intervals are presented in milliseconds as mean ± standard deviation.
P < 0.001 vs. T−1d.
QTc, QT-interval corrected for heart rate; T−1d, 1 day prior to the procedure; T+1d, 1 day post-procedure; T+3m, 3 months post-procedure
Subgroup analyses
Figure 2 shows the change in QTc at T+3m relative to T−1d divided into the subgroups: ablation technique, sex, AF type, AF recurrence, and re-do/first ablation.
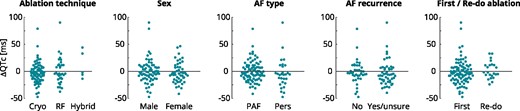
Change in QTc at 3 months post-PVI relative to baseline for the subgroups: ablation technique, sex, AF type, AF recurrence, and first/re-do ablation. AF, Atrial Fibrillation; PAF, paroxysmal AF; Pers, persistent AF; RF, radiofrequency.
A multiple linear regression model was calculated to predict the change in QTc at T+3m relative to T−1d based on the independent variables: age, ablation technique, sex, AF type, AF recurrence, and re-do/first ablation. The regression model was non-significant [F(6, 81) = 1.297 (P = 0.268)], with a R2 of 0.088. After removing all patients treated with a hybrid procedure because of the small group size (n = 4), the regression model remained non-significant [F(6, 77) = 1.405 (P = 0.224)], with a R2 of 0.099. We can therefore not reject the null-hypothesis that all regression coefficients equal zero indicating that there was no significant difference between all subgroups.
QT-dispersion
Figure 1 shows the QT-dispersion at T−1d, T+1d, and T+3m (left) as well as the QT-dispersion change with respect to T−1d (right). There was no statistically significant difference in QT-dispersion determined by repeated-measures ANOVA and by Bonferroni post hoc testing (Table 3).
Bonferroni post hoc test results
| Mean difference (ms) | P | ||
|---|---|---|---|
| QT | T+1d–T−1d | −19 [−26:−11] | <0.001 |
| T+3m–T−1d | −10 [−18:−2] | 0.005 | |
| T+3m–T+1d | 8 [11:26] | <0.001 | |
| RR | T+1d–T−1d | −153 [−193:−112] | <0.001 |
| T+3m–T−1d | −71 [−112:−30] | <0.001 | |
| T+3m–T+1d | 82 [112:193] | <0.001 | |
| QTc Fridericia | T+1d–T−1d | 4 [−2:10] | 0.348 |
| T+3m–T−1d | −1 [−6:3] | 1.000 | |
| T+3m–T+1d | −5 [−11:1] | 0.125 | |
| QTc Bazett | T+1d–T−1d | 16 [8:22] | <0.001 |
| T+3m–T−1d | 3 [−2:9] | 0.360 | |
| T+3m–T+1d | −12 [−19:−5] | <0.001 | |
| QTc Hodges | T+1d–T−1d | 0 [−6:6] | 1.000 |
| T+3m–T−1d | −3 [−8:2] | 0.338 | |
| T+3m–T+1d | −3 [−9:3] | 0.630 | |
| QTc Framing. | T+1d–T−1d | 5 [−1:−11] | 0.108 |
| T+3m–T−1d | 1 [−4:5] | 1.000 | |
| T+3m–T+1d | −4 [−10:1] | 0.208 | |
| QT-dispersion | T+1d–T−1d | 2 [−2:7] | 0.546 |
| T+3m–T−1d | −2 [−4:1] | 0.403 | |
| T+3m–T+1d | −4 [−9:1] | 0.102 |
Mean differences are presented with 95% confidence intervals between brackets.
Framing., Framingham; QTc, QT-interval corrected for heart rate; T−1d, 1 day prior to the procedure; T+1d, 1 day post-procedure; T+3m, 3 months post-procedure.
Discussion
The objective of this study was to investigate the impact of a PVI procedure on repolarization characteristics in a real-world study population. The results of this study show that the heart rate significantly increases acute and chronically after a PVI. This is in line with earlier studies who reported an increase in heart rate after PVI due to a reduction of cholinergic control.11,16 In normal physiological circumstances, the QT-interval should adapt to this shortening in RR-interval.21 In our study, the QT-interval indeed significantly shortens in line with the RR-interval. Both QT- and RR-interval are shortest 1 day post-procedure but remain shortened 3 months post-procedure. No significant within-subject differences in QTc Fridericia were seen for any of the recording times, which suggests that the QT-interval properly adapts to the higher heart rates after PVI. This finding is contradictory to that of Chikata et al.16 who recently found that both QTc Fridericia and QTc Bazett are significantly prolonged after PVI. Next to QT-interval measurement differences (algorithm vs. manual assessment, 12 lead vs. one-lead ECG), the most important difference between our and Chikata’s study most likely are the inclusion criteria.16 Chikata et al.16 included 117 ablation naive paroxysmal AF patients without any antiarrhythmic drug, whereas in our study, we included all patients who were in sinus rhythm during all three ECG recordings. Our study population therefore better reflects the real-world population. It furthermore has to be noted that not every increase in QTc is clinically relevant as long as the absolute QTc interval remains within certain limits.22,23 The total number of patients with a QTc Fridericia above the 99th percentile of a control population (>440 ms22) in our study did not change (21%, 22%, and 16% at T−1d, T+1d, and T+3m, respectively). A significant prolongation of QTc as found by Chikata et al. does not automatically imply that the prolongation is clinically relevant and leads to an increased susceptibility of ventricular arrhythmias.
Since we studied a real-world population that consisted of different types of patients and treatments, the effect of PVI and GP modulation might vary between these types of patients. Although bidirectional block was routinely checked in all ablation types, the transmurality and GP modulation severity might still differ between ablation techniques. Furthermore, PVI lesions in patients with an AF recurrence at 12 months might have been less transmural leading to less GP modulation and thus no QTc prolongation at 3 months post-PVI. However, since the multiple linear regression model was non-significant, we could not reject the null-hypothesis and did not find evidence for significant differences between these subgroups.
A possible explanation for a QTc prolongation as a result of PVI would have been the unintentional modulation of the atrial GP. Whether we did not find a QTc prolongation because the GPs were not modulated (enough) or whether GP modulation does not induce a QTc prolongation cannot be concluded from this study. The amount of GP modulation most likely also differs between patient due to differences in anatomical locations of the GPs and different transmurality of PVI lesions. We therefore cannot conclude that PVI does not modulate GP nor can we conclude that GP modulation does not lead to a prolonged QTc. We can, however, conclude that, on average, routine PVI does not induce QTc prolongation.
The mechanism(s) behind the increased susceptibility for ventricular arrhythmias after PVI therefore remain(s) unclear. Apart from the hypothesis that GP modulation (in part) causes this increased susceptibility, others have hypothesized that propafenone therapy for AF was associated with new-onset ventricular arrhythmias in AF patients.24 The results of a study by Wu et al.4 does however not support this finding since propafenone was not prescribed in their study and patients still show new-onset ventricular arrhythmias post-PVI. The only measure associated with new-onset ventricular arrhythmias in the study of Wu et al.4 was an increased serum leucocyte count which implies that an inflammatory response caused by the PVI may be an underlying mechanism of ventricular arrhythmias. Patel et al.3 showed a significant difference in post-PVI ejection fraction and heart rate between patients that developed ventricular premature beats and patients who did not. However, since the ejection fraction remained in the normal range and increased post-PVI heart rates have been described in larger cohorts,13,14 the clinical relevance of these findings are unclear. Jungen et al.11 have shown that a small subset of their patients (n = 6 out of 111) has an increased ventricular premature beats burden after PVI. In these six patients, QT-dispersion was significantly higher post-PVI with respect to six age- and gender-matched controls.11 However, whether QT-dispersion can be used to estimate the risk of an increased ventricular pre-mature beats burden is not clear from this observation. It is also unclear whether an increased QT-dispersion leads to an increased ventricular premature beats burden or whether an increased ventricular pre-mature beats burden leads to an increased QT-dispersion. Our results show that post-PVI QT-dispersion of the six patients reported by Jungen et al. (40 ± 6ms) are within the range of QT-dispersion measured before PVI from our population. Since Jungen et al. compared only six patients with an increased ventricular premature beats burden with six age- and gender-matched controls, chances are that among the remaining patients some also have an increased QT-dispersion without an increase in ventricular premature beats burden. Our results show no significant difference between the QT-dispersion before and after a PVI treatment for the entire study population indicating that, on average, PVI does not affect the ventricular repolarization heterogeneity. It has furthermore to be noted that QT-dispersion is a very laborious measure. It therefore is easily affected by biphasic T-waves, flat T-waves, and prominent U-waves. Furthermore, a broad range of QT-dispersions has been reported in healthy populations.25
Interestingly, the QT correction method used, influences the results. When using Fridericia’s, Hodges’, or Framingham’s correction methods, QTc did not change significantly after PVI, whereas using Bazett’s correction method showed a significantly prolonged QTc at 1-day post-PVI. The significant increase in QTc Bazett can be explained by the known over- and underestimation of QTc by Bazett’s method at RR-intervals <1000 and >1000 ms, respectively. As shown in Figure 1, half of the patients had an RR-interval >1000 ms before the PVI which shortened to <1000 ms as a result of the PVI. For all these patients, Bazett’s pre-PVI QTc is underestimated whereas Bazett’s post-PVI QTc is overestimated. Although consensus is still lacking on what QT correction method is best, several studies agree on the over- and underestimation of QTc Bazett at RR-intervals <1000 and >1000 ms, respectively, and that both Hodges’ and Fridericia’s correction methods are superior.19,20,26,27 Since both Hodges’ and Fridericia’s correction methods show no significant change in QTc after PVI, our conclusion that PVI does not result in a change in QTc holds, no matter what QTc correction method is preferred.
To summarize, the results of this study show that PVI does not result in a significant change of QTc in a real-world population using different PVI modalities. These findings therefore suggest that there is no need to intensify post-PVI QT-interval monitoring.
Study limitations
This study has several limitations due to the observational design of the registry. First of all, no information about an effective GP modulation was recorded in the registry. Therefore, we cannot study the effect of GP modulation on the QT-interval. We can however still conclude that, on average, routine PVI does not induce QTc prolongation but we cannot preclude that this is because a routine PVI does not lead to GP modulation. Registries or prospective studies on GP ablation could provide answers on this.
The cohort might include bias because we only included patients who were in sinus rhythm during all three ECG recordings. Although more paroxysmal AF patients were included, subgroup analyses did not reveal any difference between paroxysmal and persistent AF patients. Nonetheless, it would be interesting to study the change in QT-interval dynamics during AF as a consequence of PVI. This was not possible in this study population because, following institution’s protocols, all patients were cardioverted during the procedure.
The QT-interval prolonging mechanism of PVI might already has taken place after the first procedure in the re-do patients. However, the subgroup analysis showed that there was no difference in QTc at T+3m with respect to T−1d between re-do and first-time procedure patients.
Third, we did not look into QT prolonging drug use in this study since according to the institution’s standard of care, all antiarrhythmic drugs (if any) were continued through the entire period of this study. Therefore, the background therapy is equal between all timepoints with PVI being the only intervention.
Finally, AF recurrence was self-reported and although all patients included in this study suffered of symptomatic AF before ablation, there is a chance of silent AF or misinterpretation of other arrhythmia than AF as AF. Because many patients were referred back to their treating physicians in other hospitals, we do not have access to 24-h Holter reports and can therefore not address this issue.
Conclusion
In this study, we showed that PVI does not result in a prolongation of QTc or QT-dispersion in a real-world population. Furthermore, the change in QTc at 3 months post-PVI did not differ between sex, ablation technique, first/re-do ablation, type of AF, and AF recurrence. These findings therefore suggest that there is no need to intensify post-PVI QT-interval monitoring.
Supplementary material
Supplementary material is available at Europace online.
Funding
This work was supported by the European Union (CATCH ME: Characterizing Atrial fibrillation by Translating its Causes into Health Modifiers in the Elderly, No. 633196, the ITN Network AFibTrainNet, No. 675351, and the ERACoSysMED H2020 ERA-NET Cofund project Systems medicine for diagnosis and stratification of atrial fibrillation) and the Netherlands Heart Foundation (CVON2014-09, RACE V Reappraisal of Atrial Fibrillation: Interaction between hyperCoagulability, Electrical remodelling, and Vascular Destabilisation in the Progression of AF). M.D.Z. received an Electrophysiological DGK (German Society of Cardiology) Educational Grant sponsored by St. Jude Medical. This paper is part of a supplement supported by an unrestricted grant from the Theo-Rossi di Montelera (TRM) foundation.
Conflict of interest: none declared.
Data availability
The data underlying this article will be shared on reasonable request to the corresponding author
References
Author notes
Ben J M Hermans and Matthias D Zink authors contributed equally to the study.
