


Abstract
Twelve-lead electrocardiogram (ECG) is an established tool in the evaluation of athletes, providing information about life-threatening cardiovascular diseases, such as long QT syndrome. However, the interpretation of ECG is sometimes challenging in children, particularly for the repolarization phase. The aim of this prospective, longitudinal study was to determinate the distribution of QT interval in children practicing sport and to evaluate changes in QT duration overtime.
A population of 1473 preadolescents practising sport (12.0 ± 1.8 years, 7–15 years) was analysed. Each athlete was evaluated at baseline, mid-term, and end of the study (mean follow-up: 3 ± 1 years). QT interval was corrected with Bazett (B) and Fridericia (F) formulae. At baseline QT interval corrected with the Bazett formula (QTcB) was 412 ± 25 ms and QT interval corrected with the Fridericia formula (QTcF) 387 ± 21 ms, with no changes during follow-up. Ten children (0.68%) had an abnormal QTc. In those with QTcB and QTcF ≥480 ms, QTc duration persisted abnormal during the follow-up and they were disqualified. Conversely, children with 460 ms < (QTcB) <480 ms had a normal QTc interval at the end of the study. These children had also a normal QTcF. Mean difference in the calculation of QT between the two formulae was 25 ± 11 ms (P < 0.0001). For resting heart rate (HR) ≥82 b.p.m., QTcF was independent from HR contrary to QTcB.
Normal QTc interval does not change over time in preadolescents. A minority of them has a QTc ≥480 ms; in these subjects, QTc interval remains prolonged. The use of Bazett and Fridericia correction formulae is not interchangeable and the Fridericia correction should be preferred in preadolescents with a resting HR ≥82 b.p.m.
In this longitudinal study, we demonstrate that normal QTc interval does not change over time in preadolescents and adolescents practising sport.
In preadolescents with borderline QTc, mid-term follow-up and repeated electrocardiogram measurements are useful to identify normalization during the growth.
A minority of children has a QTc ≥480 ms; in these subjects, QTc interval remains prolonged. These subjects were disqualified from sports competition.
The use of Bazett and Fridericia correction formulae is not interchangeable and the Fridericia correction should be preferred in preadolescents with a resting heart rate ≥82 b.p.m.
Introduction
The electrical adaptations induced by training in adult athletes have been extensively investigated and previous studies have demonstrated that intensive physical training leads to a series of cardiovascular changes known as ‘athlete’s heart’.1,2 Twelve-lead electrocardiogram (ECG) is an established tool in the evaluation of athletes, providing diagnostic and prognostic information about cardiovascular disease potentially associated with an increased risk of sudden cardiac death (SCD), such as long QT syndrome (LQTS).2 However, LQTS still remain sometimes under- or over-diagnosed, particularly in subjects with borderline long QT intervals and in specific settings such as paediatric populations where changes in resting heart rate (HR), the presence of respiratory sinus arrhythmia, and the influence of factors such as sports practice may complicate the interpretation of ECG. Furthermore, despite the relevance of an early diagnosis of LQTS before the onset of puberty, the ECG changes induced by training in the paediatric population have been poorly investigated,3–5 and data from adult studies cannot be directly transferred to paediatric athletes, as children often present ECG peculiarities not frequently observed in adults. Moreover, ECG data on athletes have been traditionally obtained from cross-sectional studies and few longitudinal information are currently available, particularly in preadolescents and adolescents which often exhibit dynamic changes in ECG related to pubertal development.4,6 The aim of this prospective, longitudinal study is to determinate the distribution and average values of QTc interval in preadolescents and adolescents practicing sport and to longitudinally evaluate changes in normal and abnormal QTc interval during preadolescence and adolescence.
Methods
Study population
We enrolled 1546 consecutive preadolescents and adolescents practising sports at competitive level, aged 7–15 years, who underwent pre-participation screening (PPS) at the Sports Medicine Centre in Siena, Italy, from January 2012 to December 2014. Children with family history for LQTS and children with secondary or with potentially pathological repolarization abnormalities were excluded from the study. Therefore, 43 children with complete right bundle branch block (RBBB), two with Wolf–Parkinson–White syndrome and nine with infero-lateral T-wave inversion were excluded and 1492 subjects were included in the study. Nineteen were lost to follow-up because of withdrawal from competitive sports. Therefore, the final population consisted of 1473 young athletes. Part of the study population has been previously involved in our study on T-wave inversion in children.7
Each athlete was evaluated at three-time points: at baseline (T1), mid-term follow-up (T2), and at the end of the study (T3) during the study period (4 years), with at least 12 months separating the different time points. The mean follow-up was 3 ± 1 years. Participants practised competitive sports on a regional level and the amount of training per athlete averaged 7 ± 3 h/week.
All participants underwent PPS according to the Italian protocol.8 The cardiac evaluation included family and personal history, physical examination, and 12-lead resting ECG. Participants with abnormal findings at first evaluation underwent further examinations, according to the Italian protocol for sports eligibility and disqualification.8 The study was approved by the local ethics committee.
Twelve-lead resting electrocardiogram
A standard 12-lead ECG was performed in all subjects in the supine position during quiet respiration using a CARDIOLINE Realclick v. 3.4. All ECGs were recorded at a paper speed of 25 mm/s and at a standard gain of 1 mV/cm. ECGs were interpreted by experienced cardiologists and discrepancies were solved by consensus. Resting HR, PR interval, QRS duration, and QRS axis were calculated. Any form of pre-excitation and atrioventricular block was sought. Left axis deviation was defined as a QRS axis lower than −30°, and right axis deviation was defined as QRS axis exceeding +120°.3 Incomplete RBBB was defined as a QRS duration <120 ms, with r' or R' wave in lead V1 or V2, an S wave of greater duration than R wave or greater than 40 ms in leads I and V6, and normal R peak time in leads V5 and V6 but greater than 50 ms in lead V1, while complete RBBB was defined as a QRS duration >120 ms in presence of the criteria described earlier.9 The Sokolow–Lyon voltage criteria were applied to define left ventricular hypertrophy, according to other studies published on similar populations of young athletes.3,5 Notably, the isolated presence of high QRS voltages fulfilling voltage criterion for left ventricular hypertrophy in the absence of other ECG or clinical markers suggestive of pathology are considered part of normal and training-related ECG changes in young and adult athletes and is usually not associated with pathological hypertrophy.1 Early repolarization was defined as recommended by the international criteria for electrocardiographic interpretation in athletes.2 A Q wave was considered abnormal or pathological if it exceeded 0.04 s in duration and/or the depth of the Q wave exceeded 25% of the height of the R wave.3
According to the current recommendations for ECG interpretation in athletes, the QT interval was measured using the teach-the-tangent method.1 The QT interval was measured from the onset of the Q wave to the end of the T wave defined as the point of intersection between the isoelectric line, extension of the PR interval, and the tangent to the drawn through the maximum down slope of the T wave. The interval was measured in lead II and alternatively in lead V5; when both lead II and V5 were deemed unsuitable, one of the remaining leads was chosen.1 Bifid T waves but not U waves were included. The QT interval and the preceding RR interval were measured in three consecutives beats and in case of sinus arrhythmia, QT interval immediately following the shortest RR interval was considered.10 According to the current recommendations for ECG interpretation in athletes,2 to confirm the computer-derived QTc lead II and/or V5 were examined and we determined if the manually measured QT interval matches the computer’s QT measurement. If the manually measured QT interval was >10 ms different than the computer’s QT measurement, an average RR interval was determined and the QTc recalculated.
The mean value of the three measures was corrected with Bazett and Fridericia formulae:
Bazett: QTcB = QT/RR1/2,11
Fridericia: QTcF = QT/RR1/3.12
For the correction of QT interval, we applied these two formulae because, while the Bazett formula is widely used in the clinical practice, the Fridericia correction formula proved to be less dependent on resting HR and the most reliable formula for the correction of QT duration in young subjects.13 According to current recommendations,2 we considered of clinical interest a QTc value ≥470 ms and ≥480 ms. A short QT interval was considered of clinical interest when QTc was <330 ms.2 However, we also took into account for the analysis QTc interval ≤340 ms. In case of pathological QT duration at the first ECG, a repeat ECG was obtained within 15 days after the first evaluation and reversible, extrinsic factors (such as electrolyte abnormalities) of prolonged QT interval were evaluated. If the repeat ECG still exceeded the QTc cut-off values and extrinsic factors were excluded, further evaluations included 12-lead ambulatory ECG monitoring and exercise testing and the referral to an electrophysiologist with a potential indication to ECG analysis in the first-degree relatives and genetic testing.
Statistical analysis
Normal distribution of all continuous variables was examined using the Shapiro–Wilk test, and data are presented as mean ± standard deviation (SD). Categorical variables are expressed as percentages. Comparison of data collected at different time points was performed using Friedman test or repeated measures analysis of variance with Dunn or Bonferroni post hoc correction for multiple comparisons, according to data distribution. The unpaired t-test and the Mann–Whitney U test were used to assess potential differences in the calculation of QT interval between the Bazett and Fridericia formulae, according to data distribution. A Subgroup analysis was also performed dividing the study population according to gender (males vs. females) and age (<12 vs. ≥12 years). We calculated also the mean difference and SD between the Bazett and Fridericia formulae at each time point, and then, we evaluated by one-sample t-test the difference between 0 and the mean difference of a measurement in order to evaluate a potential statistically significant difference between the two measurements. A P value <0.05 was considered significant. We assessed also the potential interdependence between resting HR and correction formulae (see Supplementary material online for details of the statistical analysis).
Intraobserver variability and interobserver variability were calculated in a randomly selected group of 40 subjects, 20 with stable sinus rhythm and 20 with respiratory sinus arrhythmia in order to evaluate also the potential impact of the physiological variability of RR duration in preadolescents on the variability of QT measurements. Measurements were repeated by the same investigator 2 weeks after the first analysis and by a different investigator. They were blinded to each other data. Reproducibility was assessed with intraclass correlation coefficient analysis and reported as intraclass correlation coefficient [95% confidence interval (CI)]. Statistics were performed using SPSS, version 21.0 (Statistical Package for the Social Sciences Inc., Chicago, IL, USA).
Results
Demographic and baseline characteristics
The demographic characteristics of the study population are reported in Table 1. The mean age of the study population at the beginning of the study was 12.0 ± 1.8 years. Males represented 62% of the total population. Weight and height increased during the study period (P < 0.0001) while resting HR significantly decreased (P < 0.0001), similarly in males and females. However, males had significantly lower resting HR as compared to females at baseline, mid-term, and long-term follow-up (86 ± 13 vs. 92 ± 12 b.p.m.; 85 ± 13 vs. 90 ± 12 b.p.m.; 84 ± 13 vs. 89 ± 13 b.p.m.; P < 0.0001 for all time points). None of the participants had symptoms during the follow-up: particularly, neither syncope nor pre-syncope during or related to exercise was experienced by participants.
Demographic characteristics of the study population
| Baseline | Mid-term FU | Long-term FU | P-value | |
|---|---|---|---|---|
| Age (years) | 12.0 ± 1.8 | 13.1 ± 1.8a | 14.2 ± 1.8a,b | <0.0001 |
| Men (n/%) | 918/62 | |||
| Height (cm) | 156 ± 13 | 162 ± 12a | 167 ± 11a,b | <0.0001 |
| Weight (kg) | 48.6 ± 12.9 | 53.6 ± 13.1a | 58.0 ± 12.9a,b | <0.0001 |
Data are presented as mean ± SD. FU, follow-up.
P < 0.0001 vs. baseline.
P < 0.0001 vs. mid-term FU.
At baseline ECG analysis, one child (0.07%) showed low atrial rhythm. The mean PR interval was 127 ± 18 ms. Three children had first-degree atrioventricular block (0.2%), while none had advanced atrioventricular blocks. QRS duration was 91 ± 11 ms; 450 (31%) subjects had incomplete RBBB; axis was undetermined in 29 (2%) subjects; 39 (3%) showed right axis deviation; 3 (0.2%) had left anterior hemiblock. Sokolow–Lyon criteria for left ventricular hypertrophy were positive in 146 (10%) subjects and 437 (30%) showed signs of early repolarization.
Table 2 shows data on QT-interval duration collected during the study period in the overall population and in the subgroups of males vs. females and younger (<12 years) vs. older (≥12 years) subjects, respectively. QT interval corrected with the Bazett formula (QTcB) was significantly longer in females vs. males at the beginning of the study (P = 0.022), at mid-term follow-up (P < 0.001), and at the end of the study (P < 0.001). QT interval corrected with the Fridericia formula (QTcF) did not differ between males and females during the entire study period (P = 0.45, P = 0.38, and P = 0.31, at baseline, mid-term, and long-term follow-up, respectively).
Dynamic changes in QT-interval duration found in the study population and in the same population according to gender and age
| Baseline | Mid-term FU | Long-term FU | P-value | |
|---|---|---|---|---|
| Overall population | ||||
| QT interval (ms) | 343 ± 25 | 345 ± 24a | 346 ± 25a | <0.0001 |
| QRS duration (ms) | 86 ± 9 | 91 ± 11a | 92 ± 11a | <0.0001 |
| HR (b.p.m.) | 88 ± 13 | 87 ± 13a | 86 ± 13a,b | <0.0001 |
| QTc Bazett (ms) | 412 ± 25 (371–449) | 411 ± 25 (367–449) | 409 ± 25 (367–446) | 0.10 |
| QTc Fridericia (ms) | 387 ± 21 (355–418) | 387 ± 20 (353–419) | 387 ± 20 (353–418) | 0.59 |
| Males | ||||
| QT interval (ms) | 345 ± 24 | 347 ± 25a | 348 ± 25a | 0.013 |
| QTc Bazett (ms) | 412 ± 24 (372–449) | 410 ± 24 (369–448) | 408 ± 23 (367–445) | 0.06 |
| QTc Fridericia (ms) | 388 ± 20 (357–418) | 387 ± 20 (355–419) | 386 ± 19 (354–418) | 0.86 |
| Females | ||||
| QT interval (ms) | 341 ± 25 | 341 ± 24a | 342 ± 26a | 0.002 |
| QTc Bazett (ms) | 414 ± 26 (371–449) | 414 ± 25 (375–450) | 413 ± 24 (374–449) | 0.89 |
| QTc Fridericia (ms) | 387 ± 22 (349–412) | 388 ± 20 (356–419) | 388 ± 20 (355–419) | 0.31 |
| Younger (<12 years) | ||||
| QT interval (ms) | 341 ± 25 | 343 ± 24a | 344 ± 24a | 0.008 |
| QTc Bazett (ms) | 411 ± 24 | 411 ± 25 | 410 ± 24 | 0.81 |
| QTc Fridericia (ms) | 386 ± 20 | 387 ± 20 | 387 ± 20 | 0.73 |
| Older (≥12 years) | ||||
| QT interval (ms) | 345 ± 24 | 348 ± 25a | 348 ± 27a | 0.004 |
| QTc Bazett (ms) | 413 ± 25 | 412 ± 23 | 409 ± 24a | 0.010 |
| QTc Fridericia (ms) | 389 ± 21 | 389 ± 19 | 387 ± 20 | 0.58 |
Data are presented as mean ± SD (5th-95th percentiles). FU, follow-up; HR, heart rate.
P < 0.05 vs. baseline.
P < 0.05 vs. mid-term FU.
QT interval tended to increase in younger and older subjects while no significant differences were found during the period of observation for QTcF. However, while QT corrected with the Bazett formula did not differ among the different time points in younger children, it significantly decreased during the study period in older subjects (P = 0.010).
During the study period RR interval and QT duration significantly increased (P < 0.0001 for both). However, when QT interval was corrected with Bazett and Fridericia formulae no differences were found (P = 0.10 and P = 0.59, respectively).
The distribution of QT interval in the overall population divided according to gender is reported in Figures 1and2, according to the formula used for the correction of QT duration (Bazett and Fridericia, QTcB, and QTcF, respectively).
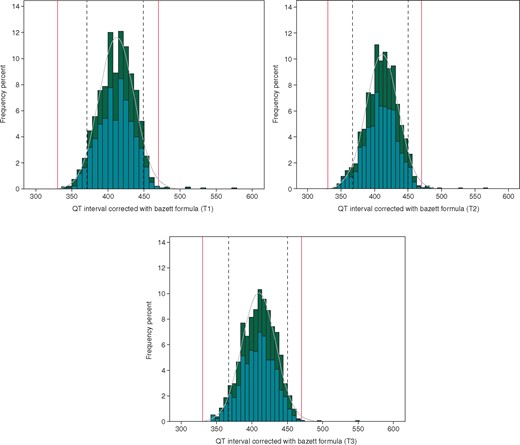
Distribution of QT-interval duration corrected with the Bazett formula in the population at T1 (A), T2 (B), and T3 (C). Dotted lines define the 5–95th confidence interval found in our population, while red lines indicate the normal lower and upper limit of QTc interval. According to gender, histograms are coloured in teal for males and dark green for females.
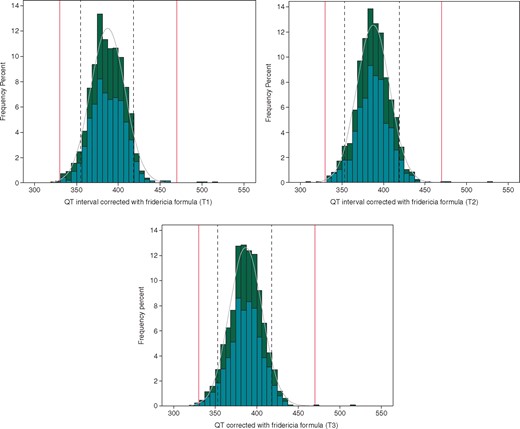
Distribution of QT-interval duration corrected with the Fridericia formula in the population at T1 (A), T2 (B), and T3 (C). Dotted lines define the 5–95th confidence interval found in our population, while red lines indicate the normal lower and upper limit of QTc interval. According to gender, histograms are coloured in emerald color for males and dark green for females.
Subjects with prolonged QTc interval
Ten subjects (0.68%) had an abnormal QTc interval at baseline which was confirmed at the second ECG evaluation performed within 15 days after the first ECG evaluation. Indeed, five (all males) showed a QT duration corrected with the Bazett formula 460 ms < (QTcB) <480 ms, while other five subjects had a QTcB ≥480 ms (three females and two males). None had symptoms or family history for SCD or channelopathies. All the 10 subjects with abnormal QTc were followed-up for the entire duration of the study. According to the Italian protocol for sports eligibility and disqualification, children with QTc duration ≥480 ms were disqualified from sports competition while those with QTc duration ≥470 ms but <480 ms continued to practice competitive sports.
Among the five subjects with QTcB ≥ 480 ms, three children had a persistent QTc duration beyond the normal limit even after detraining and for the entire period of follow-up, in absence of symptoms. Twenty-four hour, 12-lead Holter ECG was performed in these subjects confirming an abnormal QT duration in absence of ventricular arrhythmias as confirmed also by exercise testing, demonstrating also a paradoxical prolongation of QT interval in two of them. Two of these three subjects had positive genetic testing and in one we demonstrated a prolonged QT duration also in the mother, unaware of having a prolonged QT duration.
Conversely, four subjects out of five with QTc >460 ms but <480 ms who continued to practice sport demonstrated a normalization of QT interval during the follow-up and continued to compete.
When QTcF, three subjects had a QTc ≥480 ms, while the other seven with abnormal QT duration after the Bazett correction had a QTcF below the threshold of 460 ms. During the follow-up, QTcF remained below <460 ms for all these seven subjects; conversely, QTcF persisted abnormal in three subjects with the exception of one child who demonstrated a borderline value at the end of the study.
The trend of each subject with abnormal or borderline QT-interval duration during the follow-up is shown in Figure 3, according to Bazett and Fridericia formula, respectively.
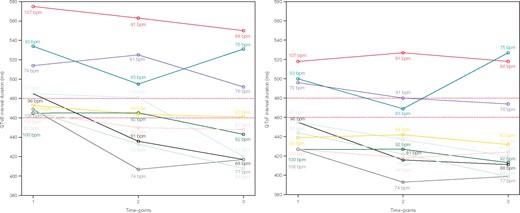
Trend of QT intervals for children with abnormal (QTc ≥480 ms) or borderline (460 ms < (QTc) <480 ms) values corrected with Bazett and Fridericia formulae, respectively. Different coloured lines correspond to different subjects; for each subject also resting heart rate was reported for each time point. b.p.m., beats per minute; QTcB, QT interval corrected with the Bazett formula; QTcF, QT interval corrected with the Fridericia formula.
The percentage of subjects with QTc duration beyond the normal limits was lower using the Fridericia rather than the Bazett formula (P < 0.001).
Differences between Bazett and Fridericia formulae
We also calculated the mean difference and SD between the Bazett and Fridericia formulae: a significant difference was found between the two measurements at each time point (P < 0.0001) with a mean difference between the two formulae ranging from 23 to 25 ms and demonstrating the absence of a level of agreement between the two formulae (Table 3).
Comparison between Bazett and Fridericia formulae and respective differences at each time-point of the study
| QTc Bazett vs. Fridericia | Baseline | Mid-term FU | Long-term FU |
|---|---|---|---|
| Mean difference (ms) and 95% CI (ms) | 25 ± 11 (24–25) | 24 ± 11 (23–24) | 23 ± 11 (22–23) |
| P-value | P < 0.0001 | P < 0.0001 | P < 0.0001 |
| QTc Bazett vs. Fridericia | Baseline | Mid-term FU | Long-term FU |
|---|---|---|---|
| Mean difference (ms) and 95% CI (ms) | 25 ± 11 (24–25) | 24 ± 11 (23–24) | 23 ± 11 (22–23) |
| P-value | P < 0.0001 | P < 0.0001 | P < 0.0001 |
CI, confidence interval; FU, follow-up.
The largest eigenvalue calculated from the matrices W(j)-1B(j) suggested that the optimal HR threshold was equal to 82 b.p.m. For HR values above the threshold of 82 b.p.m., the QTc corrected with the Fridericia formula resulted in low fluctuations around the mean (390.1) and was independent from resting HR values. Conversely, the measures corrected with the Bazett formula revealed a significant growing trend as the HR increased and showed higher variability than the Fridericia method. In the HR range below the threshold of 82 b.p.m., the two methods had similar variance and growing trends with respect to the HR progress. Additional information about the results of statistical analysis are reported in Supplementary material online, Table S1.
Short QT interval
At the beginning of the study and during the entire study period, two subjects had a QTc ≤330 ms (0.14%), while 17 had a QTc ≤340 ms (1.15%) when the intervals were corrected with the Fridericia formula. None of the participants had a QTc ≤330 ms or ≤340 ms when the Bazett correction formula was applied. None experienced symptoms or was disqualified from competitive sports during the follow-up.
Reproducibility analysis
The intraobserver intraclass correlation coefficient for QTc in subjects with stable sinus rhythm was 0.97 (95% CI 0.94–0.98, P < 0.0001) and 0.73 (95% CI 0.35–0.90, P = 0.003) in those with respiratory sinus arrhythmia. The interobserver intraclass correlation coefficient for QTc in subjects with stable sinus rhythm was 0.85 (95% CI 0.56–0.95, P < 0.0001) and 0.64 (95% CI 0.15–0.86, P = 0.016) in those with respiratory sinus arrhythmia.
Discussion
Regular and intensive physical activity induces cardiac electrical and structural adaptations known as ‘athlete’s heart’.1,2,14 While several data are available on the interpretation of structural and electrical changes in adult athletes.1,2,15 little is known about cardiac adaptation in children practicing sport, the so-called ‘paediatric athlete’s heart’.16 Furthermore, the interpretation of 12-lead resting ECG in children during PPS can be challenging because they often exhibit dynamic changes in repolarization phases from birth to adolescence, including T-wave inversion and changes in QT-interval duration. According to these peculiarities, the current recommendations for ECG interpretation in adult athletes cannot be entirely transferable to children and preadolescents.
We conducted a study on preadolescents and adolescents practicing sport to primarily determinate the distribution and average values of QT interval in this specific setting. In the present study, (i) we reported QT-interval values corrected with Bazett and Fridericia formulae in a population of preadolescent and adolescent athletes; (ii) using a longitudinal design, we demonstrated that absolute values of QT interval significantly increased over time concomitantly with the reduction in resting HR. However, after correction with Bazett and Fridericia formulae, no significant changes were observed during the study period; (iii) a pathological QTc interval ≥480 ms was very rare in our population and QTc interval remained prolonged during the period of observation; and (iv) the use of the two formulae, Bazett and Fridericia, is not interchangeable and Fridericia formula is less affected by HR and should be used when resting HR is ≥82 b.p.m.
In our population, QT interval corrected with Bazett and Fridericia formulae was 412 ± 25 ms and 387 ± 20 ms, with a lower limit of 367 ms and 353 ms, respectively and an upper limit of 449 ms and 419 ms, respectively. These data are in agreement with previous findings: indeed, Davignon et al.17 demonstrated in 2141 white children aged 0–16 years that the mean value of QTcB was about 400 ms with an upper limit of 450 ms. Rijnbeek et al.18 analysed 1912 Dutch children aged 11 days to 16 years and found a QTc relatively constant over the years (424–409 ms) with an upper limit ∼450 ms. Gervasi et al.13 studied a population of male athletes and found a QTcB of 413 ± 20 ms and 403 ± 23 ms in subjects aged 9–12 years and 13–17 years, respectively. Conversely, applying the Fridericia formula the authors obtained a mean value of 400 ± 17 ms and 397 ± 19 in subjects aged 9–12 years and 13–17 years, respectively. Notably, the average values of QTcF in our study were completely comparable with those found in the control’s group of a study by Vink et al. where the QT-interval duration was calculated with the same method, even if the group was older than our subjects.19
Electrocardiogram data on athletes have been traditionally obtained by cross-sectional studies and data derived from studies with a prospective and longitudinal design are currently missing, particularly in children and preadolescents. Our prospective study evaluated for the first time through longitudinal design changes in QTc interval during preadolescence, i.e. during a very sensitive stage of growth and development. In our population, the absolute value of QT interval significantly increased over time concomitantly with the reduction in resting HR. However, after correction with Bazett and Fridericia formulae, no significant changes were observed during the study period. In agreement with our findings, Davignon et al.17 demonstrated in a cross-sectional study that QTcB did not change with age, without sex-related differences, as confirmed also by Rijnbeek et al.18
A QTc interval ≥480 ms is considered clearly pathological also in absence of any clinical symptoms.2 However, controversies still exist about the appropriate cut-off to be used to differentiate between a pathological and a physiological QTc interval, particularly in young athletes. A pathological QTc interval ≥480 ms was very rare in our population, i.e. 0.33% and 0.20% after Bazett and Fridericia formulae correction, respectively. These findings are in agreement with previous data demonstrating that a QTc ≥480 ms is considered extremely rare in young athletes (0.3%).13 Subjects with a confirmed QTc ≥480 ms were disqualified from competitive sports and were followed-up for the entire study period: we found that QTc interval remained prolonged during the follow-up, suggesting that, when QT interval is prolonged beyond 480 ms both after correction with Bazett and Fridericia formulae, usually it does not normalize in absence of drug therapy and the suspicion of an LQTS is high. Conversely, in our study most of subjects with borderline QTc interval (i.e. 460 ms < (QTc) <480 ms), obtained after the Bazett correction, normalized during the follow-up. They continued to practice sport in absence of symptoms and family history of SCD and channelopathies. Notably, these subjects had a normal QT interval when the Fridericia formula was applied.
Finally, in this study, we also demonstrated that the use of the two formulae (i.e. Bazett and Fridericia) is not interchangeable and there is an absence of a level of agreement between the two measurements obtained with these two different methods. In agreement with our interpretation, Vink et al.,19 analysing QT duration in patients with LQTS and in controls in order to accurately assess QT measurement, concluded that adjusted cut-offs are needed for the determination of physiological vs. pathological duration of the QT interval and these reference values should be specific for method (tangent vs. threshold), correction formula, age, and sex. Although many studies demonstrated that the Bazett formula is the one depending the most on HR, it is often used by clinicians, being also easy to calculate. In our population, the Bazett formula was more influenced by resting HR and the percentage of subjects with a prolonged QT was higher as compared to the Fridericia correction. Indeed, we conducted a study in a paediatric population characterized by higher resting HRs than adults: in this population, QTcB was longer than QTcF as compared to QTcF and Fridericia correction has demonstrated to be more stable at higher resting HR.13,20 In 2010, a Japanese study investigated a population aged 6, 12, and 15 years old and found more stability in the Fridericia formula correction at higher HRs.20 More recently, resting ECGs of 701 healthy elite male athletes (mean age: 14 ± 5.6 years) were analysed by Gervasi et al.13: QTc obtained with the Bazett formula resulted to be considerably dependent on HR, especially in younger subjects, while the Fridericia correction was more accurate with higher HR. The mean difference in QTc duration after Bazett and Fridericia correction was about 24 ms. According to our results, we recommend to take seriously into account the formulae used for correcting QT interval in children. Particularly in case of elevated resting HR, with borderline QT-interval duration, we suggest using both Bazett and Fridericia formulae, given the significant difference found in QT correction between these two formulae. However, the Fridericia correction seems to be clinically more appropriate in preadolescents, which usually have a higher resting HR, according to its greater stability at higher HR as compared to Bazett formula.
Limitations
The most significant limitation of this study is the lack of a control group. However, the aim of the study was to identify the dynamic ECG changes observed in preadolescents practicing competitive sport through a longitudinal design, with a within-subject comparison. Furthermore, the study was planned to characterize the QT interval and not to identify potential training-induced ECG changes. Indeed, recent evidences demonstrated no differences in terms of QT interval between young athletes and non-athletes.4,5
Data collected in the present study derived from Italian preadolescents and adolescents of Caucasian origins. Therefore, the results of this study should be applied with caution to a non-Caucasian population, although previous studies suggested QT interval is not affected by ethnicity.5
Clinical implications
A prolongation of QTc interval is rare in preadolescents and adolescents. When QTc interval is ≥480 ms, after confirmation with both Bazett and Fridericia formulae, the prolongation of QTc interval persists during the study period and after detraining, confirming that subjects with these values of QTc interval should be regarded with suspicion and strictly followed-up. Although the disqualification from some competitive sports in subjects with pathological QT duration but in absence of symptoms, family history of SCD and arrhythmias is still debated, particularly, after the institution of treatment and appropriate precautionary measures, in this study, children with pathological QT duration were disqualified in agreement with the Italian protocol for sports eligibility and disqualification.8 In these cases, a comprehensive evaluation, including ECG stress test, Holter ECG monitoring, genetic test, and an ECG in first-degree relatives should be performed to confirm the presence of LQTS. Conversely, in subjects with borderline values, i.e. 460 ms < (QTc) <480 ms, QT interval should be corrected both with Bazett and Fridericia formulae and physicians should be aware that the Bazett formula tends to provide greater values of QT interval in this setting. In preadolescents and adolescents with borderline values and with prolonged QT interval not confirmed by both the formulae (i.e. only by the Bazett formula), we did not restrict sports practice but we strictly followed them up with yearly evaluations in order to identify a normalization of QTc interval during preadolescence that often occurred in these cases. However, in these cases and particularly when the clinical suspicion is high, a comprehensive evaluation including an accurate personal and family history, exercise stress test, Holter ECG monitoring, and ECG screening of first-degree relatives should be performed in order not confirm or disconfirm the presence of an LQTS. Finally, the use of Bazett and the Fridericia correction formulae is not interchangeable and the Fridericia formula is less affected by HR and should be used when resting HR is ≥82 b.p.m. Therefore, we recommend using this formula to correct QT interval in preadolescents with HR ≥82 b.p.m.
Conclusions
A minority of preadolescents and adolescents practising sport present a QTc interval ≥480 ms. In these subjects, QTc interval remains prolonged during the follow-up even if they withdraw from sports competition, indicating that sport does not affect QTc interval in these cases. Conversely, in young athletes with borderline QTc, a mid-term follow-up is useful to identify a potential normalization of QTc interval during growth. In this study, sports practice was continued in subjects with borderline QTc interval in absence of clinical events. In this study, we did not observe significant changes in QTc-interval duration over time in subjects with a normal duration of this interval.
Clinicians should take into account that the Bazett and the Fridericia correction formulae are not interchangeable and different values of QTc interval can be obtained with different formulae. We recommended correcting QT interval with both the formulae although the Fridericia correction seems to be less affected by resting HR and should be used when HR is ≥82 b.p.m.
Acknowledgements
The authors wish to thank Cosetta Meniconi, Angela Benelli, Francesca Rossi, Silvia Giovani, all the staff, and the nurses for their precious help in collecting ECG data.
Conflict of interest: none declared.
