


Abstract
Pathogenic gain-of-function variants in CACAN1C cause type-8 long QT syndrome (LQT8). We sought to describe the electrocardiographic features in LQT8 and utilize molecular modelling to gain mechanistic insights into its genetic culprits.
Rare variants in CACNA1C were identified from genetic testing laboratories. Treating physicians provided clinical information. Variant pathogenicity was independently assessed according to recent guidelines. Pathogenic (P) and likely pathogenic (LP) variants were mapped onto a 3D modelled structure of the Cav1.2 protein. Nine P/LP variants, identified in 23 patients from 19 families with non-syndromic LQTS were identified. Six variants, found in 79% of families, clustered to a 4-residue section in the cytosolic II–III loop region which forms a region capable of binding STAC SH3 domains. Therefore, variants may affect binding of SH3-domain containing proteins. Arrhythmic events occurred in similar proportions of patients with II–III loop variants and with other P/LP variants (53% vs. 48%, P = 0.41) despite shorter QTc intervals (477 ± 31 ms vs. 515 ± 37 ms, P = 0.03). A history of sudden death was reported only in families with II–III loop variants (60% vs. 0%, P = 0.03). The predominant T-wave morphology was a late peaking T wave with a steep descending limb. Exercise testing demonstrated QTc prolongation on standing and at 4 min recovery after exercise.
The majority of P/LP variants in patients with CACNA1C-mediated LQT8 cluster in an SH3-binding domain of the cytosolic II–III loop. This represents a ‘mutation hotspot’ in LQT8. A late-peaking T wave with a steep descending limb and QT prolongation on exercise are commonly seen.
The majority of type-8 long QT syndrome (LQT8)-causing genetic variants cluster in a very small ‘mutation hotspot’ of the CACNA1C gene.
This encodes a region of the Cav1.2 protein involved in binding important regulatory STAC proteins. Altered binding of these proteins may mediate the pathogenic effects of the variants.
Patients with these variants had a significant risk of arrhythmic events despite displaying less QT prolongation than patients with pathogenic variants in other areas of the gene.
The electrocardiogram phenotype of LQT8 displays QT prolongation after exercise similarly to LQT2.
Introduction
The CACNA1C gene encodes the core α-1 subunit of the voltage-gated L-type calcium channel (LTCC) Cav1.2. CACNA1C is expressed in multiple cell types including cardiomyocytes. Specific variants (p.G402S and p.G406R) in exon 8, and the alternatively spliced 8A (p.G406R), were reported in the first descriptions of Timothy syndrome (TS).1,2 Timothy syndrome is a rare systemic disorder characterized by dysmorphic features, syndactyly, congenital heart disease, immune deficiency and developmental delay along with QT prolongation, and an increased risk of sudden death.2 Subsequently, additional CACNA1C variants outside of exon 8 have been reported in patients with non-syndromic long QT syndrome [referred to as type 8 LQTS (LQT8)] as well as in patients with: Brugada syndrome; hypertrophic cardiomyopathy, either alone or with a prolonged QT interval; and sudden unexplained death (SUD). Type 8 LQTS accounts for 1–2% of all LQTS cases. Functional assessments of LQT8-associated variants have demonstrated a gain-of-function of the LTCC through various mechanisms.3–6
Electrocardiographic features at rest and during exercise have yet to be reported in a series of unrelated patients with CACNA1C-mediated LQTS. Variant distribution within the CACNA1C-encoded Cav1.2 and electrocardiographic phenotype at rest and during exercise are presented.
Methods
Study population
Data from four genetic testing laboratories: GeneDx; Blueprints Genetics; the Princess Margaret Hospital Genetic Lab; and the Mayo Clinic Windland Smith Rice Sudden Death Genomics Laboratory were queried to identify patients with rare CACNA1C variants that were discovered between 1 January 2000 and 31 January 2017. Principal physicians in additional centres were contacted directly to identify further cases. Treating physicians were then invited to provide associated phenotypic data. Both probands and asymptomatic relatives identified through cascade screening were included. Patients were clinically assessed by their treating physicians. Only patients with non-syndromic LQT8 were included. Patients with other phenotypes including neurological effects suggestive of TS were not included. The study protocol was approved by the Research Ethics Board at the University of British Columbia.
Variant classification
All variants classified as: pathogenic (P); likely pathogenic (LP); or of uncertain significance (VUS) by the reporting lab were originally included. Patients with P/LP variants in other LQTS or Brugada syndrome-susceptibility genes were excluded (n = 1). All variants were assessed independently by three authors (G.J.M., K.B., N.J.B.) as per the 2015 American College of Medical Genetics (ACMG) guidelines.7 The variants were annotated according to reference sequence NM_000719.6. The Exome Aggregation Consortium and Genome Aggregation Databases were used to identify general population frequencies. In silico pathogenicity prediction was performed using the Combined Annotation Dependent Depletion (CADD) algorithm. Public access databases were interrogated in November 2017. In addition, results of homology modelling and structural analysis (see below) were considered in variant classification. Sequence-based analyses of variants do not take into account the 3D environment of amino acid residues, which may have an important impact on function. Variants affecting residues that are buried or at an interface with another protein are more likely to be pathogenic. We, therefore, mapped the variants on to a 3D model of CaV1.2. Variants identified as locating to domains critical to protein function or clustering in a mutation hotspot were assigned a moderate evidence of pathogenicity criterion (designated PM1) as per the guideline recommendation.7 Phenotypic data analysis was restricted to patients with non-syndromic LQTS and a CACNA1C P/LP variant.
Homology modelling and structural analysis
Since no structure is available for the entire CaV1.2 complex, the 3D model for human CaV1.2 was built using the cryo-electron microscopy (cryo-EM) structure of CaV1.1 complex8 (PDB ID: 6BYO as a template, with the exclusion of cytosolic loops that are intrinsically disordered). PHYRE2 server was used for the structural modelling of CaV1.2 α1c subunit. The overall sequence identity is 58% (69% sequence similarity), but upon exclusion of the flexible areas, which were not modelled, the overall sequence identity is 75% (86% sequence similarity), allowing for the construction of a reliable model. A sequence alignment between template and target model is shown in Supplementary material online, Figure S1. Quality control analysis by the PROCHECK programme identified 93% residues of the model in the most favourable regions of the Ramachandran plot. P/LP variants were mapped on to the structure using the UniProt Q13936-12 sequence, corresponding to the NM_000719 transcript. The structural model of the CaV1.2 851–860 peptide and STAC2 (SH3 and cysteine rich domain 2) tandem SH3 domains complex was built using the crystal structure of STAC2-CaV1.1 II–III loop complex (PDB ID: 6B27).9 To further investigate the contribution of the II–III loop variants on binding, we calculated the contribution of each amino acid residue within the binding site to overall binding affinity using analysis by PISA (https://www.ebi.ac.uk/pdbe/pisa/).10 All the structural figures were prepared and analysed using Pymol (The PyMOL Molecular Graphics System, Version 1.8 Schrödinger, LLC.).
Phenotypic assessment
Site investigators provided clinical data and reports of resting and exercise electrocardiograms (ECGs). Original ECG traces were provided where available. Measurements of the QT intervals were made manually using the maximum slope technique, also known as the tangent method, from 12-lead ECG recordings (25 mm/s, 0.1 mV/mm). Bazett’s formula was used for heart rate correction. T-wave morphology was inspected visually. T-wave notching was recorded if two discrete peaks were seen within the T wave. The ratio of the QTpeak/QTend was used to quantify relative timing of QTpeak. Low volume T waves were defined where the peak T-wave amplitude was ≤0.1 mV. Where an exercise treadmill test was performed, QTc, heart rate, and T-wave morphology details were recorded while: supine resting; immediately on standing; at peak exercise; at 1 min into recovery; and at 4 min into recovery.
Statistical analysis
Baseline characteristics were described using means with standard deviations. Continuous variables were compared using the Student’s t-test. Categorical variables were compared using the χ2 test. A two-tailed P-value of <0.05 was considered significant.
Results
Genetic variant assessment
Initially, 21 unique CACNA1C variants in 38 individuals from 30 families were identified from laboratory reports. Following pathogenicity assessment and evaluation of clinical data, 9 variants identified in 23 patients from 19 families with a non-syndromic LQTS phenotype were classified as either pathogenic (P, n = 6) or likely pathogenic (LP, n = 3) (see Table 1). The remaining 12 variants (see Supplementary material online) were either non-pathogenic (n = 10) and/or associated with phenotypes other than non-syndromic LQTS (n = 6) and were not further investigated. Homology modelling and structural analysis (see below) contributed a moderate evidence of pathogenicity criterion (PM1) for one variant (p.Ala1154Val, [LP]) due to its presence in a functional domain. In addition, six of the nine (67%) P/LP variants (p.P857R, p.P857L, p.R858H, p.R860G, p.R860Q, p.R860P) identified in 15 (79%) families, were noted to cluster to a 4-amino acid long section (857–860) of the CaV1.2 protein. These variants were considered to reside in a mutation hotspot and were therefore also assigned a moderate evidence of pathogenicity criterion (PM1).
Pathogenic/likely pathogenic variants identified with ACMG 2015 guideline criteria for pathogenicity
| Variant no. | c.DNA change | Amino acid change | Protein topology | No. of individuals | No. of families | Variant classification | Evidence of pathogenicity |
|---|---|---|---|---|---|---|---|
| 1 | c.1204G>A | p.Gly402Ser | Rpt I S6 | 1 | 1 | Pathogenic | PS3, PM1, PM2, PP2, PP3 |
| 2 | c.1553G>A | p.Arg518His | I-II cytosolic loop | 4 | 2 | Pathogenic | PS3, PS4-M, PM2, PP1, PP2, PP3, |
| 3 | c.2570C>G | p.Pro857Arg | II-III cytosolic loop | 1 | 1 | Pathogenic | PS3, PM1*, PM2, PP1, PP2, PP3, |
| 4 | c.2570C>T | p.Pro857Leu | II-III cytosolic loop | 3 | 3 | Pathogenic | PS1, PM1*, PM2, PM5*, PP1, PP2, PP3, |
| 5 | c.2573G>A | p.Arg858His | II-III cytosolic loop | 8 | 8 | Pathogenic | PS3, PM1*, PM2, PP2, PP3, |
| 6 | c.2578C>G | p.Arg860Gly | II-III cytosolic loop | 1 | 1 | Pathogenic | PS3, PM1*, PM2, PP2, PP3, |
| 7 | c.2579G>A | p.Arg860Gln | II-III cytosolic loop | 3 | 1 | Likely Pathogenic | PM1*, PM5*, PP2, PP3 |
| 8 | c.2579G>C | p.Arg860Pro | II-III cytosolic loop | 1 | 1 | Likely Pathogenic | PM1*, PM2, PM5*, PP2, PP3 |
| 9 | c.3461C>T | p.Ala1154Val | Rpt III S6 | 1 | 1 | Likely Pathogenic | PM1*, PM2, PP2, PP3, |
Based upon reference sequence NM_000719.6. Asterisks denote evidence arising directly from this investigation.
Mapping of variants on 3D protein structures
The main Cav1.1 subunit (CaVα1s) consists of a ∼2000 amino acid polypeptide, with 24 transmembrane helices arranged in four repeats (I–IV). Each repeat contains six transmembrane helices (S1–S6), along with additional pore helices, whereby S1–S4 constitute a voltage sensing domain (VSD), and S5–S6 contribute to the pore. These four repeats are linked by long cytosolic linkers (termed I–II loop, II–III loop, and III–IV loop), and followed by a very long C-terminal cytosolic segment.
Several cytosolic loops are highly flexible and thus missing from the model, but additional high-resolution crystal structures are available for: the CaVβ subunit bound to its interaction site in the I–II loop11–13; for calmodulin bound to the IQ domain in the channel’s proximal C-terminus14; and for STAC (SH3 and cysteine rich domain) proteins bound to the II-III loop of CaV1.1.9 These allowed us to extend the structural analysis to portions not covered by the CaV1.1 cryo-EM structure.
Figure 1 shows the homology model, with the variants mapped and labelled. As described above, six variants (p.P857R, p.P857L, p.R858H, p.R860G, p.R860Q, and p.R860P) localize to a small proline-rich region within the II–III loop. This region forms a motif recognized by SH3 domains, and the corresponding area in CaV1.1, which shows a high degree of sequence conservation with CaV1.2, forms a binding site for an SH3 domain in STAC proteins9 (Figure 1E). STAC proteins have been shown to bind to the CaV1.2 II-III loop in vitro9 and to affect the channel inactivation properties.9,15,16 Recently, STAC2 was shown to be expressed in cardiac tissue.16 The location of the variants right at the interface with the first SH3 domain of STAC2 implies they are likely to decrease affinity. The PISA analysis shows the largest contributions to binding stability are made by Pro857 and Arg858, two residues targeted by the P/LP variants in the patient cohort (Table 3). Arg858 is of particular importance, as this residue makes cation-π interactions with a Trp in STAC2 and makes several salt bridge interactions. A third residue, Arg860, is harder to interpret, since the corresponding residue in CaV1.1 was flexible in most molecules of the asymmetric unit in the STAC2 complex. However, since the STAC2 structure only covered the tandem SH3 domains, and not the N-terminal regions, this residue may interact with portions not crystallized. Therefore, it remains to be tested whether variants affecting Arg860 affect binding of STAC or other SH3-domain containing proteins.
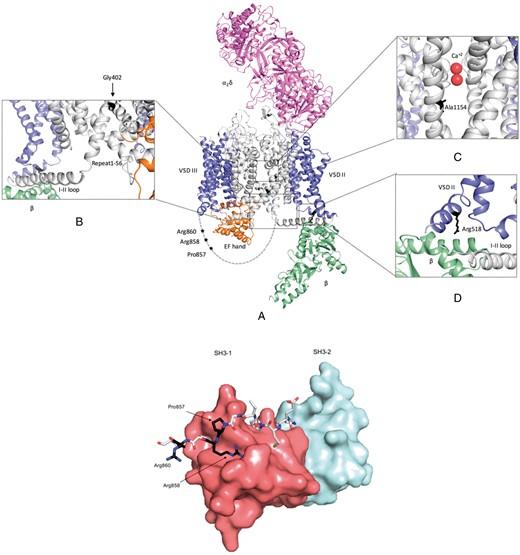
Homology model of CaV1.2 complex and structural model of the CaV1.2 851–860 peptide and STAC2 tandem SH3 domains complex (A) CaV1.2 domains are coloured as follow: α1s VSD—Blue; α1s pore region and cytoplasmic loops—Grey; β subunit—Light green; α2δ subunit—Magenta; and α1s C-terminal domain—Orange. Enlarged view of the insets are presented to highlight location of the variants and nearby secondary structures. (B) CaV1.2-p.Gly402Ser mutant is located at the C-terminal end of Repeat I S6. This mutation might affect the rigidity of S6 helix, which can interfere with the mobility of the I–II loop (C) CaV1.2-p.Ala1154Val variant is located within transmembrane segment S6 of repeat III, near the calcium binding site. (D) CaV1.2-p.Arg518His is located in the S0 helix of repeat II. This mutation is in close proximity to the CaVβ subunit binding site. (E) STAC2 is shown in surface representation with the first SH3 domain in red, and the second in light blue. The CaV1.2 peptide is shown in sticks with the residues targeted by pathogenic/likely pathogenic variants in black.
Three variants are located within the transmembrane region. The p.G402S variant is at the C-terminal end of Repeat I S6. It has been linked previously to TS,2 and has been proposed to interfere with the mobility of the I–II loop.17 The p.A1154V variant is located within transmembrane segment S6 of repeat III and faces the ion permeation pathway. As a result, it has the potential to interfere with Ca2+ flux. As S6 is also involved in the opening/closure of the intracellular gate, p.A1154V may also have an effect on gating. One cytosolic variant (p.R518H) is located in the S0 of repeat II. This loop forms a binding site for the CaVβ subunit, but the residue is downstream of the interaction site, and is thus not likely to impact binding directly. However, p.R518H-containing calcium channels have an in vitro gain-of-function electrophysiological phenotype.3
Phenotypic assessment
The mean age of the cohort was 28.3 ± 19.4 years. 16 (70%) were probands, of whom 11 (69%) were symptomatic. The remaining 7 (30%) were relatives identified through cascade genetic testing following a familial diagnosis of LQT8 (n = 6) or a SUD event with a positive molecular autopsy (n = 1).
The mean QTc on the resting 12-lead ECG of the 23 patients with P/LP variants was 487 ± 36 ms. A late peaking T wave (QTpeak/QTend ≥0.75) with a steep descending limb was the predominant T-wave morphology, observed in 15/18 (83%) patients where original ECG traces were available. The mean QTpeak/QTend was 0.80 ± 0.06 (see Figure 2). A minority of patients (n = 2) displayed low amplitude notched T waves.
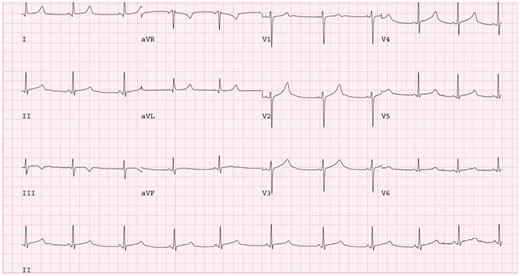
A 12-lead ECG of patient with R860Q variant. Note prolonged QTc with late peaking T wave and steep descending limb. 25 mm/s, 10 mm/mV. ECG, electrocardiogram.
Prior syncope or aborted sudden cardiac arrest had occurred in 11 of 23 (48%) patients. All patients with cardiac arrest (n = 3) and 6/8 (75%) patients with syncope had variants in the II–III cytosolic loop. However, there was no statistically significant difference in symptomatic presentation between those patients with II–III cytosolic loop-localizing variants and those patients with variants that localized to other regions of the channel: Three out of 17 (17.6%) patients with II–III cytosolic loop variants had a cardiac arrest and 6 out of 17 (35%) had a prior syncopal event compared to none of the 6 (0%, P = 0.54) and 2 out of 6 (33%, P = 1.0) individuals with other pathogenic variants, respectively. There was a history of SUD below 30 years of age in 9 (47%) families. A history of SUD was only reported in families with II–III loop variants (60% vs. 0%, P = 0.03). Mean QTc was similar in symptomatic and asymptomatic patients (491 ± 33 ms vs. 489 ± 43 ms, P = 0.79). However, resting QTc measurements in patients with variants in the II–III cytosolic loop (n = 17) were shorter than in patients with other P/LP (n = 6) variants (477 ± 31 ms vs. 515 ± 37 ms, P = 0.03). Clinical characteristics are summarized in Table 2. Individual patient data is presented in Supplementary material online, Table S2.
Clinical characteristics stratified by site of pathogenic variant
| Overall cohort | II–III loop variants | Other pathogenic variants | P-value | |
|---|---|---|---|---|
| n (%) | 23 (100) | 17 (74) | 6 (26) | – |
| Age (SD) | 28.3 (19.4) | 28.4 (16.7) | 28.2 (27.6) | 0.98 |
| Male (%) | 12 (52) | 10 (59) | 2 (33) | 0.28 |
| Proband | 16 (69) | 12 (71) | 4 (67) | 0.86 |
| Relative | 7 (31) | 5 (29) | 2 (33) | |
| Prior symptoms | 11 (48) | 9 (53) | 2 (33) | 0.41 |
| Prior VF | 3 (13) | 3 (18) | 0 (0) | 0.27 |
| Prior syncope | 8 (35) | 6 (35) | 2 (33) | 0.93 |
| Family history of SUD ≤30 years | 9 (47)a | 9 (60)a | 0 (0)a | 0.03 |
| QTc (SD) | 487 (36) | 477 (31) | 515 (37) | 0.03 |
| QTp/QT (SD) | 0.80 (0.06) | 0.80 (0.06) | 0.84 (0.07) | 0.38 |
LQTS, long QT Syndrome; SUD, sudden unexplained death; VF, ventricular fibrillation.
Proportions based upon number of families included. Ntotal = 19, nII–II loop = 15, nother = 4.
Solvent accessibility contribution of CaV1.2 residues in the CaV1.2 851–860 peptide and STAC2 tandem SH3 domains complex model
| Residue | Accessible surface area (ASA) | Buried surface area (BSA) | Solvation free energy (kcal/M) |
|---|---|---|---|
| Pro851 | 189.66 | 91.34 | 1.03 |
| Glu852 | 161.46 | 9.45 | −0.08 |
| Met853 | 182.00 | 81.97 | 2.38 |
| Pro854 | 119.89 | 91.85 | 1.23 |
| Val855 | 157.86 | 0.15 | −0.00 |
| Gly856 | 34.11 | 15.09 | 0.09 |
| Pro857 | 124.38 | 6.13 | −0.07 |
| Arg858 | 187.46 | 158.17 | −1.05 |
| Pro859 | 114.22 | 85.09 | 1.08 |
| Arg860 | 226.54 | 0.00 | 0.00 |
Pro 857 and Arg858 shows negative solvation free energy, which corresponds to hydrophobic interfaces or positive protein affinity.
Exercise electrocardiograms
An exercise ECG was performed in 17 (74%) patients. The mean QTc when supine pre-exercise was 463 ± 23 ms. QTc prolongation was seen upon standing (489 ± 53 ms) and late in recovery after exercise (479 ± 36 ms) (see Figure 3). There were insufficient numbers to compare exercise test results in those with and without II–III loop variants.
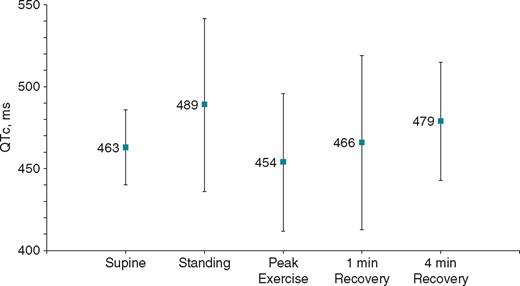
QT dynamics during exercise testing. LQT8 patients display QT prolongation on standing and during late recovery after exercise. LQT8, type-8 long QT syndrome.
Discussion
Splawski et al.1 first described TS associated with CACNA1C variants in 2004. Subsequently, there have been multiple cases reported of non-syndromic LQTS (LQT8) with pathogenic variants in CACNA1C outside of the canonical exon 8/8A.4–6,18 This study represents the largest cohort of patients with LQT8 to date. Analysis of this cohort has allowed identification of common themes both in terms of phenotype and underlying genotype.
Genotype and 3D protein modelling
A striking observation from this study is that 67% of P/LP variants are tightly clustered in four consecutive amino acid residues of a protein which is 2000 amino acids in length. Furthermore, variants in this region were over-represented in the cohort, identified in 79% of families. The p.R858H variant alone was seen in eight unrelated individuals. In addition, several of the variants from within this region have previously been reported in LQT8 patients, both by authors within this group (P857R,4 P857L4) and elsewhere (R858H19, R860G6). Finally, data from the genome Aggregation Database shows that the sum frequency of alleles with missense/nonsense variants in amino acids 857–860 in the general population is low, at 5.67 × 10⁻⁵, further supporting this region as a relative ‘mutation hotspot’ in CACNA1C.
The availability of several structures relating to CaV1.2 and its subunits, along with a cryo-EM structure of full-length CaV1.1, allowed us to map pathogenic variants on to a 3D model. The mutation hotspot lies in a region 10 residues (amino acid 851 to 860) long found in the cytosolic II–III loop. Functional studies in three of the previously reported variants in this region have shown a gain-of-function effect. Fukuyama et al.5 identified the p.R858H variant in three unrelated cases of previously genotype negative LQTS. Patch-clamp assays showed an increase in current density in p.R858H cells compared to wild-type.5 Wemhöner et al.6 performed patch-clamp testing on the p.R860G variant and showed a positive shift in voltage dependence of inactivation. Boczek et al.4 identified the p.P857R variant in a three-generation pedigree of previously genotype negative LQTS. In vitro cell models demonstrated an increase in ICaL and increased cell surface expression of CaV1.2. It was hypothesized that since the II–III loop contains a PEST domain [a sequence motif rich in proline (P), glutamic acid (E), serine (S) and threonine (T)] known to act as part of the signalling cascade for protein degradation, variants interrupting this sequence may lead to increased membrane stability of the channel.4 This would lead to an increased number of functioning channels which in turn could be responsible for the increased current causing prolongation of the action potential duration and risk of early after depolarizations. More recently, it has been shown that this region contains a predicted SH3-domain binding motif, and indeed was shown to bind to SH3 domains in STAC proteins,9 a relatively recently described family of adapter proteins that have been shown to associate with CaV1.1 and CaV1.2. STAC proteins can modulate membrane trafficking and slow down channel inactivation.9,15,20 In skeletal muscle, this interaction site is crucial for excitation–contraction coupling and is targeted by a mutation causing Native American Myopathy. Neuronal tissue expresses both STAC1 and STAC2, where they may interact with CaV1.2. STAC2 expression has recently been demonstrated in cardiomyocytes16; however, it remains to be confirmed whether it associates with CaV1.2 in these cells. In addition, SH3 domains are commonly found in a large range of proteins including the cardiac protein BIN1, which is crucial for normal CaV1.2 expression.21 This opens the possibility that these variants are also at an interface for another SH3-domain containing binding partner. Clustering of pathogenic variants in this region, particularly affecting residues which are shown to affect binding affinity, may suggest that their pathogenic mechanism may be due to altered binding of such a partner, as an alternative, or in addition to effects on the PEST domain. Further work is needed to elucidate the identities of additional SH3-domain containing proteins that may affect CaV1.2 function.
Phenotype
Phenotype–genotype correlation is well-established in the three canonical subtypes of LQTS with triggers for arrhythmic events, prognosis, response to beta-blockade, and T-wave morphology all varying in LQT1-3. Largely this phenotypic difference is explained by the underlying ionic culprits, with LQT1 (reduction in IKs repolarizing current), LQT2 (reduction in IKr repolarizing current), and LQT3 (increased INa depolarizing current) displaying unique clinical features.
We, therefore, aimed to identify common phenotypic features in LQT8. The dominant T-wave morphology was a late peaking T wave with a steep descending limb, similar to classic descriptions of asymmetric late-peaking T waves in LQT3 which is also caused by an excess or prolonged depolarizing current. Changes in QT duration during exercise and recovery also differ between genotypes, with QT prolongation on exercise having been well-described in LQT1 and LQT2,22 while patients with LQT3 can have variable responses.23 A trend towards QTc prolongation on standing and in late recovery after exercise was seen in patients with LQT8 (see Figure 3). This is similar to the response seen in LQT2.22 However, the small numbers of patients who underwent exercise testing preclude any firm conclusions and it is currently not possible to differentiate LQT8 from other subtypes based upon ECG phenotype. Future studies, with larger numbers of patients, may demonstrate unique features.
Prior clinical events were common, as might be expected in a cohort composed largely of probands. All three patients with a prior cardiac arrest and the majority with a prior syncope had variants in the II–III cytosolic loop, despite having only mild QT prolongation. Although differences in clinical events were not statistically significantly different between groups, a family history of premature sudden death was also higher in those families with II–III loop variants. Therefore, while it is not possible to conclude that variants in this region lead to a more malignant phenotype than those localized elsewhere within the gene, it a hypothesis which requires further evaluation. The poor correlation between absolute QT prolongation and clinical events also suggest there may be an alternative mechanism of arrhythmogenesis associated with II-III loop variants in CACNA1C. The variant p.P857L has previously been reported in three unrelated individuals amongst a cohort of 174 cardiac arrest survivors without a clear phenotype undergoing genetic testing.24 In addition, a recent report of a large family with the p.R858H variant demonstrated similar discordance between arrhythmic events and QT prolongation.25 The authors even conclude the term ‘arrhythmogenic channelopathy’ may be more appropriate than LQTS in this family. Further investigation of the mechanism of arrhythmogenesis are required in addition to prospective studies to judge the prognosis of Cav1.2 II–III loop variants and their response to treatment, which we were unable to assess. For now, it appears clear that the cytosolic II–III loop is a vital regulatory region of the Cav1.2 protein, and genetic variants affecting this area are likely to be pathogenic.
Study limitations
The limitations to this study are inherent to a relatively small observational case series involving multiple centres. Only a portion of patients had exercise treadmill tests performed and did not routinely have treadmill tests performed both before and after the initiation of beta-blockers. The data was also collected at each participating centre individually and the analysis of the resting and exercise ECG parameters was not standardized or blinded. Functional studies supporting pathogenicity were not available for all variants described.
Conclusions
We have identified a novel mutational hotspot in CACNA1C-encoded Cav1.2 associated with non-syndromic LQT8. The majority of pathogenic/likely pathogenic variants in Cav1.2 in patients with LQT8 cluster in a small region in the cytosolic II–III loop that can bind SH3 domains. Associated arrhythmic event rates were similar to variants elsewhere despite shorter QTc intervals. The predominant T-wave morphology was a late peaking T wave with QT prolongation on exercise.
Conflict of interest: none declared.
References
Author notes
Greg J. Mellor and Pankaj Panwar authors contributed equally to the study.
Members of the European Reference Network for Rare and Low Prevalence Complex Diseases of the Heart (ERN GUARDHEART; http://guardheart.ern-net.eu).
