


Abstract
CACNA1C mutations have been reported to cause LQTS type 8 (LQT8; Timothy syndrome), which exhibits severe phenotypes, although the frequency of patients with LQT8 exhibiting only QT prolongation is unknown. This study aimed to elucidate the frequency of CACNA1C mutations in patients with long QT syndrome (LQTS), except those with Timothy syndrome and investigate phenotypic variants.
CACNA1C gene screening was performed in 278 probands negative for LQTS-related gene mutations. Functional analysis of mutant channels using a whole-cell patch-clamp technique was also performed. Using genetic screening, we identified five novel CACNA1C mutations: P381S, M456I, A582D, R858H, and G1783C in seven (2.5%) unrelated probands. Seven mutation carriers showed alternative clinical phenotypes. Biophysical assay of CACNA1C mutations revealed that the peak calcium currents were significantly larger in R858H mutant channels than those of wild-type (WT). In contrast, A582D mutant channels displayed significantly slower inactivation compared with WT. The two mutant channels exerted different gain-of-function effects on calcium currents.
In patients with LQTS, the frequency of CACNA1C mutations was higher than reported. Even without typical phenotypes of Timothy syndrome, CACNA1C mutations may cause QT prolongation and/or fatal arrhythmia attacks.
In this study, five novel variants in CACNA1C were identified, presenting the long QT syndrome (LQTS) without Timothy syndrome phenotype. This study reports variations of CACNA1C mutations in LQT8 about their topological locations, clinical phenotypes, and functional changes.
In the functional analysis, two mutations were found to significantly increase the ICa current density.
The frequency of CACNA1C mutation in LQTS was suspected to be higher than that previously reported, and the severity oftheir phenotype was more than reported for Timothy syndrome.
Introduction
Long QT syndrome (LQTS) is a primary cardiac channelopathy generally characterized by a prolongation of the corrected QT (QTc) interval, syncope, ventricular arrhythmias, and high risk of sudden cardiac death.1 Its prevalence has recently been estimated at ∼1 : 2000.2 This disease is genetically heterogeneous, and 15 genes are responsible for LQTS.3
CaV1.2 protein encoded by CACNA1C gene is α1-subunits of cardiac L-type calcium channel (LTCC) and constitutes the ion permeating subunit, which determines the main biophysical and pharmacological properties of the channel.4
In 2004, a CACNA1C mutation (G406R) was identified in patients with Timothy syndrome or LQTS type 8 (LQT8), a specific subtype of LQTS.5 The syndrome has been considered to be a rare variant of LQTS, accompanied by severe phenotypes and early fatality. Its extracardiac phenotypes involve multiple organ systems and include congenital heart disease, syndactyly, immune deficiency, and central nervous system and metabolic abnormalities, justifying its separate classification. Since the first report, only two CACNA1C mutations have been reported in patients with LQT8: p.G402S and p.G406R.6
In autosomal dominant inherited LQTS, without any clinical signs suggestive of Timothy syndrome,7 three CACNA1C mutations were identified by whole-exome sequencing. Accordingly, the number of variations of CACNA1C mutations remains small. On the other hand, in our previous study,8 we identified LTCC-related genes in seven probands with Brugada syndrome and idiopathic ventricular fibrillation (VF). We therefore raised a possibility that CACNA1C variants were associated with other types of fatal arrhythmic diseases including LQTS. In our cohort, there are many LQTS probands in whom no causative gene has been identified. This study aims to identify CACNA1C mutation carriers among LQTS probands using direct sequencing to investigate the variant of clinical phenotypes and effects of mutant channels on phenotype and functional analysis.
Patient cohort and methods
Subjects
The study cohort included 278 Japanese probands registered at the Shiga University of Medical Science and Kyoto University Graduate School of Medicine between 1996 and 2012 for genetic analysis. They were suspected as clear or potential [whose electrocardiography (ECG) showed borderline QT prolongation] LQTS, showing one or more of the following phenotypes: QT prolongation in 12-lead ECG or personal/family history of syncope, seizures, sudden death, severe bradycardia for their age,9 or arrhythmic events. QT intervals were manually measured in lead II or V5, as shown on 12-lead ECG.2 QT intervals were corrected (QTc) for the heart rate (HR) using Bazett's formula. In brief, the ECG criteria for QTc intervals are ≥440 ms for males and ≥460 ms for females.10 The LQTS risk score (Schwartz score) was calculated following 1993–2012 LQTS diagnostic criteria.3 In the recent consensus for LQTS diagnosis,11 the cut-off value of Schwartz score is ≥3.5 points; however, not all patients in our cohort fulfilled the diagnostic requirements. In our cohort, 123 of 278 (44%) had ≥3.5 points on the score. Because patients with cardiomyopathy were excluded, their ejection fractions were not reduced in echocardiograms. All subjects gave written informed consent in accordance with the guidelines approved by each institutional review board.
Gene scanning
Genomic DNA was extracted from peripheral blood leucocytes. Gene screening was performed using high-resolution melting (HRM)12 or denaturing high-performance liquid chromatography (dHPLC; WAVE system Model 3500; Transgenomic) and subsequent direct sequencing, as previously reported.8 To detect any homozygous mutations, we mixed the samples from two unrelated probands on HRM and dHPLC screening. The probands were negative for mutations and single nucleotide polymorphisms (SNPs), which were reported to affect the QT prolongation in KCNQ1, KCNH2, SCN5A, KCNE1, KCNE2, and KCNJ2. According to previous reports,13,14 the possible impact of amino acid substitutions on the structure and function of human protein was evaluated using three prediction software packages, PolyPhen-2 (http://genetics.bwh.harvard.edu/pph2/), MutPred (http://mutpred.mutdb.org/), and Align GVGD (http://agvgd.iarc.fr/agvgd_input.php).
Mutagenesis and functional expression
The human wild-type (WT) CACNA1C cDNA tagged by (EYFP) Nα1c, 77 in pcDNA vector and cDNAs of CACNB2b and CACNA2D1, both cloned in pcDNA3.1 vector (Invitrogen), were used. Vectors were gifts from Dr Charles Antzelevitch (Masonic Medical Research Laboratory). Site-directed mutagenesis was performed using QuickChange-II-XL kit (Stratagene). Mutated genes were functionally expressed in Chinese hamster ovary (CHO) cells. Chinese hamster ovary cells were transfected with cDNA encoding WT or mutant CACNA1C subunits (2 µg) along with cDNA encoding CACNB2b (0.5 µg) and CACNA2D1 (0.5 µg) using 6 µL of Fugene 6 (Roche Diagnostics).5 Chinese hamster ovary cells were perfused with an external solution containing the following (in mmol/L): N-methyl-d-glucamine, 130; KCl, 5; CaCl2, 15; MgCl2, 1; and 4-(2-hydroxyethyl)-1-piperazineethanesulfonic acid (HEPES), 10 (pH 7.35 with HCl). Recording pipettes were filled with an internal solution containing the following (in mmol/L): CsCl2, 120; MgCl2, 2; MgATP, 2; HEPES, 10; CaCl2, 5; and ethylene glycol tetraacetic acid, 10 (pH 7.25 with CsOH); these solutions were made according to previous reports.5,15
Electrophysiology
Reconstituted calcium channel currents were recorded 36–48 h after transfection using the whole-cell patch-clamp technique at 38°C. After the baseline current was recorded, 1 µM nisoldipine was used to block the current. Reconstituted L-type calcium currents were obtained by digital subtraction of the two current traces.
Statistical analysis
Continuous clinical data are expressed as mean ± standard deviation, and continuous patch-clamp data are expressed as mean ± standard error (mean ± SEM). Differences between the two groups were examined using independent Student's t-tests. A P value <0.05 was considered statistically significant.
Results
Identification of mutations
We identified five novel CACNA1C variants in seven LQTS probands (2.5%): P381S, M456I, A582D, R858H (in three probands), and G1783C (Figure 1). These variants were absent in 500 reference alleles obtained from 250 healthy Japanese individuals and have not been previously reported according to the NHLBI Exome Sequencing Project Exome Variant Server (http://evs.gs.washington.edu/EVS). To achieve differentiation of rare variants identified in the healthy Japanese controls, we checked CACNA1C in 200 healthy Japanese subjects. There was only one non-synonymous variant (R1895Q), which was not reported in any SNP database (1/200 = 0.5%). An array of amino acid sequences among different species is shown below each electropherogram, indicating that every mutated amino acid is highly conserved (Figure 1).
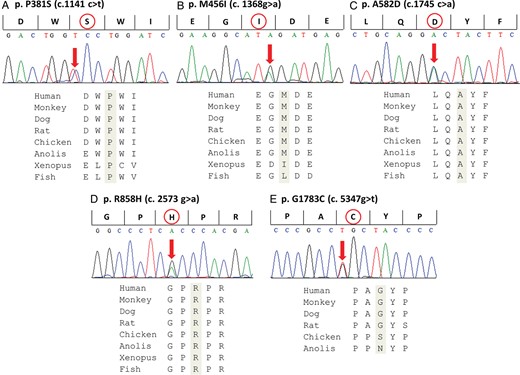
Identified mutations in CACNA1C. Upper: Electropherograms of mutant CACNA1C gene revealing heterozygous transitions. Lower: Amino acid sequence alignments. The amino acids are highly conserved among multiple species.
Table 1 summarizes the clinical data of these probands. The mean QT interval was 468 ± 71 ms, and the mean QTc interval was 474 ± 58 ms. The mean HR was 63 ± 12 b.p.m., and the mean QRS interval was 76 ± 23 ms. Mean Schwartz score was 3.9 ± 1.2 points, and four of seven carriers had ≥3.5 points.
Summary of CACNA1C mutations and mutation carriers
| Patient | Age/sex | Schwartz Score | Symptom | Family history of SD | HR (b.p.m.) | PR interval (ms) | QRS interval (ms) | QT interval (ms) | QTc interval (ms) | Mutation | Location |
|---|---|---|---|---|---|---|---|---|---|---|---|
| 1 | 8/F | 5 | (−) | (−) | 71 | 160 | 80 | 440 | 480 | p.P381S | DIS6 |
| 2 | 12/F | 3 | (−) | (−) | 73 | 180 | 60 | 420 | 464 | p.M456I | DI/DII |
| 3 | 12/F | 5.5 | (−) | (−) | 56 | 140 | 60 | 620 | 597 | p.A582D | DII S2/S3 |
| 4 | 54/F | 4.5 | VF | (+) | 58 | 180 | 120 | 444 | 435 | p.R858H | DII/DIII |
| 5 | 7/M | 2.5 | (−) | (+) | 77 | 160 | 60 | 420 | 476 | p.R858H | DII/DIII |
| 6 | 15/M | 2.5 | syncope | (−) | 44 | 170 | 90 | 490 | 420 | p.R858H | DII/DIII |
| 7 | 58/F | 4.5 | syncope | (+) | 63 | 140 | 60 | 440 | 449 | p.G1783C | C-terminus |
M, male; F, female; VF, ventricular fibrillation; SD, sudden death; HR, heart rate; QTc, corrected QT; D, domain; S, segment.
Clinical and genetic characteristics of seven proband families
Figure 2 summarizes the family trees of probands, and Figure 3 shows their ECGs.
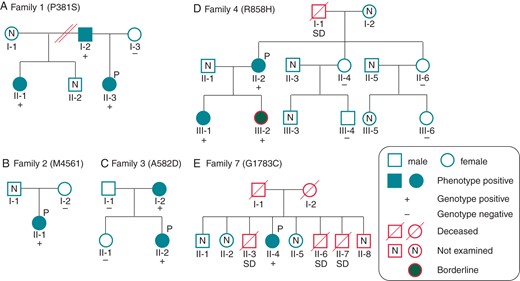
Pedigrees of the available families for CACNA1C mutations. Pedigrees of (A) P387S, (B) M456I, (C) A582D, (D) R858H, and (E) G1783C families. Squares indicate males; circles, females. Solid symbols depict phenotype positive and grey solid symbols depict borderline (QTc = 440−460 ms). +, genotype positive; −, negative. P marks indicate probands. N, not examined.
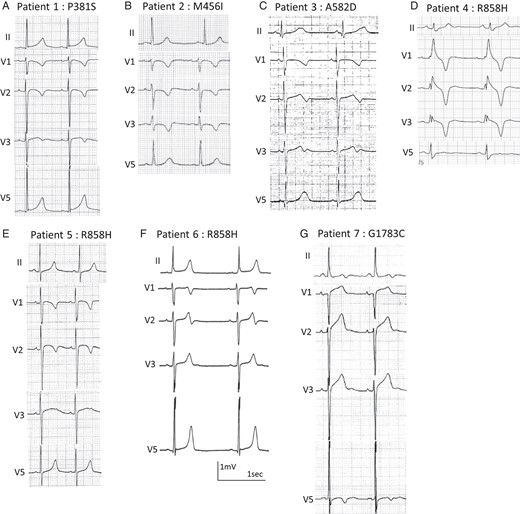
Electrocardiograms of CACNA1C mutation carriers. (A) An 8-year-old girl, p. P381S; (B) a 12-year-old girl, p. M456I; (C) a 12-year-old girl, p. A582D; (D) a 54-year-old woman, p.R858H; (E) a 7-year-old boy, p. R858H; (F) a 15-year-old boy, p.R858H; (G) a 58-year-old woman, p.G1783C.
Family 1
A heterozygous p. P381S (c.1141 c>t) was identified in an asymptomatic 8-year-old girl (Figure 1A, II-3 in Figure 2A). Her 12-lead ECG revealed QT prolongation (Figure 3A). In an exercise stress test, her QTc interval prolonged to 548 ms at 3 min after exercise (see Supplementary material online, Figure S1A). Her father (I-2 in Figure 2A) and paternal half-sister (II-1 in Figure 2A) carried the same mutation and displayed QT prolongation (see Supplementary material online, Figure S2A and B). Her paternal half-sister (II-1 in Figure 2A) often experienced syncope while running and naturally recovered, although it was uncertain that the syncope was due to ventricular arrhythmias.
Family 2
An asymptomatic 12-year-old girl showed heterozygous p. M456I (c.1368 g > a) (Figure 1B, II-1 in Figure 2B). Although her QTc interval showed mild prolongation at rest (486 ms) (Figure 3B), the interval prolonged to 568 ms at 3 min after exercise (stress test) (see Supplementary material online, Figure S1B). Her mother (I-2 in Figure 2B) was negative for this mutation, and her father's genomic DNA was not available.
Family 3
The third mutation was heterozygous p. A582D (c.1745 c>a) (Figure 1C), identified in a 12-year-old girl (II-2 in Figure 2C). Her QTc interval was significantly prolonged and notched in V4 (Figure 3C), and she had bradycardia (HR, 50 b.p.m.). The mutation was inherited from her mother (I-2 in Figure 2C), whose resting ECG also showed QT prolongation (612 ms) (see Supplementary material online, Figure S2C). The mother had paroxysmal atrial fibrillations and miscarried with her third child in 12 weeks of pregnancy because of prenatal cardiac arrest.
Family 4
One of three heterozygous p. R858H (c. 2339 g>a) carriers was a 54-year-old woman (Figure 1D, II-2 in Figure 2D). The proband was the third case in our previous report.8 She had been successfully resuscitated during an electrical storm at midnight. Her father suddenly died at midnight at the age of 46, but no further information regarding him was available. The proband had been diagnosed with idiopathic VF. Her resting ECG displayed a bizarre complete right bundle-branch block (Figure 3D). After exercise, her QTc interval was prolonged to 567 ms with a 3 min recovery (see Supplementary material online, Figure S1C). She received an implantable cardioverter-defibrillator. At the first time, she was suspected as Brugada syndrome, and prescribed oral cilostazol (200 mg per day) to prevent VF; cilostazol is a phosphodiesterase inhibitor, which is related to the increase in HR and/or to an increase of calcium current.16 However, cilostazol significantly increased her cardiac arrhythmic attacks. The subsequent replacement with a beta-blocker, atenolol (37.5 mg), completely prevented her VF. The same mutation was identified in her two daughters (III-1 and III-2 in Figure 2D). The elder daughter's ECG revealed QTc prolongation (QTc, 480 ms), but the younger's QTc interval was borderline (QTc, 444 ms) (see Supplementary material online, Figure S2D and E).
Family 5
The next heterozygous p. R858H carrier was a 7-year-old asymptomatic boy (not shown in Figures 1 and 2). He was noted to have QT prolongation at the regular health check-up at school (Figure 3E). His maternal uncle suddenly died during exercise at the age of 23. Other information and genomic DNA of his relatives were not available because they declined further medical examination.
Family 6
The last heterozygous R858H carrier was a 15-year-old boy (not shown in Figures 1 and 2). He was found unconscious on his way to school at ∼9 AM and naturally recovered while waiting for an ambulance. His 12-lead ECG revealed a prolonged QT interval and severe bradycardia (44 b.p.m.), which is not typical of children of his age (Figure 3F).9 His minimum HR recorded by Holter ECG was 36 b.p.m. at midnight. Unfortunately, we could not get informed consent for gene screening from family members.
Family 7
A heterozygous G1783C (c.5347 g>t) was identified in a 58-year-old woman with syncope (Figure 1F, II-4 in Figure 2E). Her 12-lead ECG at rest revealed notched T-waves (Figure 3G). In an exercise stress test, the QTc interval was prolonged to 725 ms with a notched T-wave (data not shown). Her three brothers suddenly died at the ages of 6, 12, and 44 (II-3, II-6, and II-7 in Figure 3E). Her elder brother (II-3 in Figure 3E) died during exercise at the age of 12; ventricular tachycardia was documented in one of her younger brothers (II-7 in Figure 3E, who died at the age of 44); however, more information and genomic DNAs of family members were not available because we could not get informed consent.
All probands showed no findings of Timothy syndrome, such as structural cardiac abnormalities that originated from congenital disease, syndactyly, immune deficiency, and central nervous system.
We applied three analytical methods to obtain an indication of the potential impact of sequence variants on protein function. Three of the variants (P381S, A582D, and R858H) were judged using the PolyPhen-2 analysis to be probably damaging (Table 2).
Prediction of the impact of mutations
| PolyPhen-2 analysis | MutPred analysis | Align GVGD | |
|---|---|---|---|
| P381S | 0.998 (Probably damaging) | 0.722 (Probably damaging) | 73.35 (Class C65) (Probably damaging) |
| M456I | 0.001 (Benign) | 0.283 (Benign) | 10.12 (Class C0) (Benign) |
| A582D | 0.998 (Probably damaging) | 0.686 (Probably damaging) | 125.75 (Class C65) (Probably damaging) |
| R858H | 0.997 (Probably damaging) | 0.372 (Benign) | 28.82 (Class C25) (Possibly damaging) |
| G1783C | 0.002 (Benign) | 0.337 (Benign) | 158.23 (Class C65) (Probably damaging) |
Electrophysiology
Using a heterologous expression system, we evaluated the ICa characteristics of WT and five mutant channels. Table 3 summarizes the biophysical parameters measured in multiple cells (the number of experiments is indicated in parentheses). Figure 4A depicts representative whole-cell current traces from six different CHO cells expressing CACNA1C-WT and five mutant channels. The current densities of cells transfected with CACNA1C-R858H were significantly larger than those of WT. In Figure 4B, peak inward current densities are plotted as a function of test potential. Compared with WT (open circles), peak inward current densities were significantly larger in R858H (squares) at potentials between −10 and +30 mV, with a maximum of 52% increase at +10 mV (−51.5 ± 8.8 vs. −78.3 ± 6.6 pA/pF, P < 0.05) (Figure 4B).
Biophysical parameters on CACNA1C-WT and mutant channels
| Biophysical parameters | WT (n = 22) | P381S (n = 22) | M456I (n = 13) | A582D (n = 18) | R858H (n = 22) | G1783C (n = 14) |
|---|---|---|---|---|---|---|
| Activation | ||||||
| Peak density (pA/pF) | −51.5 ± 8.8 | −53.5 ± 5.4 | −54.9 ± 8.6 | −61.1 ± 12.8 | −78.3 ± 6.6* | −41.6 ± 7.7 |
| Vh (mV) | −2.1 ± 1.3 | −2.7 ± 1.0 | −2.7 ± 1.3 | −0.03 ± 1.3 | −4.4 ± 0.7 | −2.1 ± 1.3 |
| k | 7.7 ± 0.5 | 7.1 ± 0.5 | 8.1 ± 0.9 | 8.9 ± 0.3* | 7.0 ± 0.3 | 7.6 ± 0.3 |
| Conductance | ||||||
| Vrev (mV) | 72.5 ± 2.8 | 73.4 ± 2.3 | 72.0 ± 3.8 | 67.4 ± 1.7 | 70.0 ± 2.0 | 72.9 ± 2.7 |
| Peak density (pS) | 1.1 ± 0.2 | 1.0 ± 0.1 | 1.0 ± 0.2 | 1.3 ± 0.2 | 1.5 ± 0.2 | 0.8 ± 0.1 |
| Inactivation | ||||||
| Vh (mV) | −22.3 ± 2.1 | −21.5 ± 0.9 | −23.9 ± 2.5 | −21.8 ± 1.7 | −21.5 ± 1.8 | −28.6 ± 4.8 |
| k | −7.6 ± 1.0 | −7.3 ± 0.6 | −9.6 ± 0.9 | −9.0 ± 1.4 | −11.2 ± 1.1* | −9.7 ± 1.2 |
| Time constant (ms) | ||||||
| 0 mV | 17.9 ± 1.5 | 19.4 ± 1.6 | 18.8 ± 1.9 | 20.6 ± 1.5 | 14.8 ± 1.1 | 19.7 ± 1.6 |
| +10 mV | 16.7 ± 1.1 | 16.7 ± 1.3 | 16.2 ± 1.2 | 24.6 ± 1.1** | 14.5 ± 0.7 | 18.4 ± 1.2 |
| +20 mV | 17.5 ± 1.0 | 17.7 ± 1.4 | 17.0 ± 1.1 | 29.1 ± 1.3** | 16.4 ± 0.9 | 19.7 ± 1.2 |
Peak current densities of activation were measured at +10 mV, peak densities of conductance were measured at +50 mV, and time constants were measured at 0–20 mV.
*P < 0.05 vs. WT.
**P < 0.0001 vs. WT.
Plus–minus values are means ± SEM.
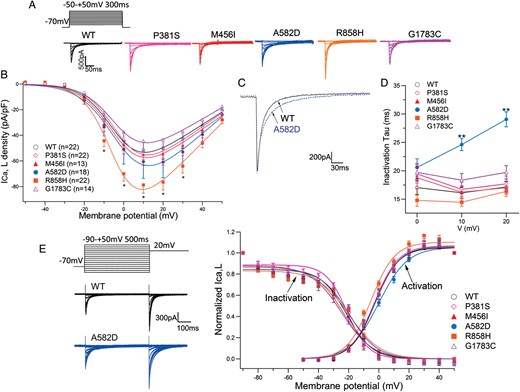
Functional analysis of the mutant Ca2+ channels. (A) Whole-cell current recordings of WT and mutant Ca2+ channels. Peak inward current–voltage relationships were constructed applying 300 ms pulses from a holding potential of −70 mV to potentials ranging from −50 to +50 mV. (B) Peak inward current–voltage relationship. Peak inward currents were normalized to cell capacitance to give a measure of Ca2+ current density. Symbols indicate means of data obtained from 13 to 22 cells. *P < 0.05. (C) Overlapping ICa traces expressing WT and A582D. Currents were elicited from a holding potential of −70 to +10 mV. (D) Time constants for the voltage dependence of inactivation in WT and mutant channels. **P < 0.0001. (E) Inset to the left of graph shows the two-step voltage-clamp protocol for measuring voltage dependence of inactivation. Voltage dependence of steady-state inactivation and activation for WT and mutant channels are plotted against test potentials.
Figure 4C shows overlapping traces of two representative ICa currents recorded from WT and A582D (dotted trace) mutant channels. The mutant A582D current indicated a slower decay, and time constants (τ) for inactivation calculated as described in the Patient cohort and methods section are summarized as a function of test potentials in Figure 4D. Time constants for A582D (blue circles) were significantly larger than those for WT (open circles) at +10 and +20 mV test potentials. There were no significant differences between WT and other mutations.
Figure 4E depicts conductance–voltage activation and inactivation curves for WT and five mutants. Smooth lines were drawn by fitting to the Boltzmann equation. Activation of R858H channels showed an ∼2 mV negative shift compared with WT. In contrast, inactivation of A582D and R858H channels showed an ∼2 mV positive shift. Thus, both R858H and A582D mutations exerted gain-of-function effects, and eventually their window currents were larger than those of the WT. The P381S, M456I, and G1783C mutations demonstrated no significant differences in gating of ICa current.
Discussion
The present study is the first comprehensive attempt to associate genetic and phenotypic variations in CACNA1C with LQTS, including detailed functional analysis for all variants and clinical information. We identified five novel CACNA1C mutations in seven unrelated probands in our cohort (Table 1). This mutation frequency (2.5%) is higher than that of LQT8 previously reported. Furthermore, the frequency of rare variants with unknown significance (VUS) in CACNA1C in our healthy control samples was only 0.5% (in this study), and the frequency of VUS in Japanese subjects has not been established. Although the number of mutation carriers was small, mutations were predominantly found in females. Most of our carriers tended to have bradycardia at their age, and more than half of them were young, consistent with a previous report;9 particularly, young age patients with LQTS often showed bradycardia. Two of three symptomatic patients experienced cardiac events in their 50s, indicating that careful observation of the clinical time course of asymptomatic young carriers was also required.
There were three probands with Schwarz score ≤3.0 (Table 1). Two of them were indeed asymptomatic and showed a modest QT interval prolongation. Remaining one proband had syncope, nature unknown, without family history, and his QTc (420 ms) was totally normal. The score defined them as ‘intermediate probability of LQTS’, which is very different from defining as ‘low probability of LQTS’. In addition, biophysical assay of the R858H variant (two of the probands, Table 1) clearly demonstrated that the mutation exerted a gain-of-function effect on LTCCs. Therefore, we should carefully observe the clinical course of these probands.
In the pedigrees of probands' families which were available (Figure 2), each mutation had completely penetrated in three families. Family 7 displayed a severe history of sudden death, but unfortunately, no further clinical information was available due to the lack of informed consent. Regarding three families carrying the heterozygous R858H, we considered that these families were unrelated because three probands had no overlapped SNP near the mutation, and there were no kinships in three generations of the family members.
Topologically (Figure 5), we observed alternative locations of mutation. Four of the five identified mutations were located in the intracellular region and one (P381S) in the transmembrane region. Two mutations reported in Timothy syndrome (p. G402S and p. G406R; Figure 5) are close to P381S and M456I. A582D is the mutation first found in the segment 2–3 linker of the domain II.17 R858H is located in next to CACNA1C-P857R, which was recently reported in long QT patients.7
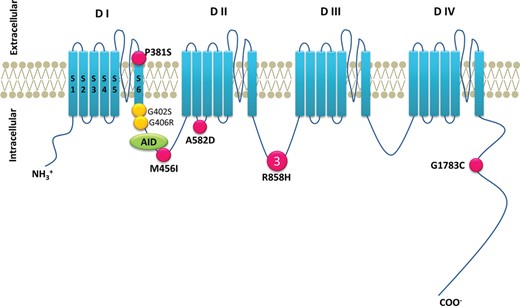
Location of the CACNA1C mutations. Predicted topology of the CaV1.2 (α) subunit. AID, α subunit interaction domain; S, segment; D, domain. Pink filled circles indicate positions of presented mutation. Yellow filled circles denote mutations causing Timothy syndrome. Larger symbols with numbers denote multiple probands with the same mutation.
In the functional analysis, both A582D and R858H were shown to be gain-of-function mutations. A582D peak current was not significantly different from that of WT. However, A582D-ICa inactivation was significantly slower than that of WT, and the k value of its activation was significantly larger. The functional analysis on A582D mutation was a slow ICa inactivation and resembled that found on CACNA1C-G406R, although our carrier showed QT prolongation alone without extracardiac phenotypes of Timothy syndrome.
In contrast, R858H-ICa showed a significantly larger current density than WT. Mutant channels showed peak ICa density similar to that of P857R channels at +10 mV.7 Despite the increased ICa current, two out of three R858H carriers did not show significant QT prolongation but suffered from severe arrhythmic attacks. Different results of functional analyses are in accordance with the difference in QT and QRS shapes between A582D and R858H mutation carriers.
The M456I and G1783C mutations, which were predicted to be ‘benign’ by the PolyPhen-2 analysis, revealed no significant differences in the functional analysis. Although P381S-ICa showed no significant differences in our functional analysis, a damaging effect of this mutation was predicted by all three software packages. According to the previous report,14 P381S was considered to be a causal mutation. The probands carrying these mutations showed QTc intervals <480 ms at rest (Table 1), but in all of them, exercise prolonged QTc intervals >500 ms. Approximately 20–25% of genotype-confirmed LQTS patients have a normal range of QTc18 and exercise stress testing would be useful to unmask patients with concealed LQTS.19 Therefore, there still remain some unexplained mechanism(s) underlying the discrepancy between genotype and phenotype, such as interactions between specific proteins, trafficking, or adrenergic stimulation, in the difference between in vivo and in vitro.
Study limitations
Although we extensively explored the families' clinical and genetic background, we could not identify mutation carriers in four out of seven families, particularly in families with M456I or G1783C mutations, which are equivocal for the aetiology of the disease. The genotype–phenotype correlations are indispensable to elucidate the mechanism of LQT8.
Conclusions
Calcium channelopathy causes various phenotypes in inherited arrhythmia syndromes; LQT8 as gain-of-function and Brugada syndrome (BrS3) and short QT syndrome as loss-of-function.
CACNA1C mutations also cause LQTS without extracardiac phenotypes observed in Timothy syndrome, suggesting that their frequency is higher than reported. Therefore, gene screening of CACNA1C may be of clinical importance in patients with LQTS in whom no mutations have been identified.
Supplementary material
Supplementary material is available at Europace online.
Funding
This work was supported by research grants from the Ministry of Education, Culture, Science, and Technology of Japan; health science research grants from the Ministry of Health, Labour and Welfare of Japan for Clinical Research on Measures for Intractable Diseases; and Translational Research Funds from the Japan Circulation Society (to M.H.).
Acknowledgements
We are grateful to the following medical doctors for clinical information: Drs Takashi Higaki, Akihiko Shimizu, and Akiko Chishaki. We thank Ms Arisa Ikeda and Ms Aya Umehara for assaying KCNQ1, KCNH2, and SCN5A.
Conflict of interest: none declared.
