


Abstract
QT prolongation during mental stress test (MST) has been associated with familial idiopathic ventricular fibrillation. In long QT syndrome (LQTS), up to 30% of mutation carriers have normal QT duration. Our aim was to assess the QT response during MST, and its accuracy in the diagnosis of concealed LQTS.
All patients who are carrier of a KCNQ1 or KCNH2 mutations without QT prolongation were enrolled. A control group was constituted of patients with negative exercise and epinephrine tests. Electrocardiogram were recorded at rest and at the maximum heart rate during MST and reviewed by two physicians. Among the 70 patients enrolled (median age 41±2.1 years, 46% male), 36 were mutation carrier for LQTS (20 KCNQ1 and 16 KCNH2), and 34 were controls. KCNQ1 and KCNH2 mutation carriers presented a longer QT interval at baseline [405(389; 416) and 421 (394; 434) ms, respectively] compared with the controls [361(338; 375)ms; P < 0.0001]. QT duration during MST varied by 9 (4; 18) ms in KCNQ1, 3 (−6; 16) ms in KCNH2, and by −22 (−29; −17) ms in controls (P < 0.0001). These QT variations were independent of heart rate (P < 0.3751). Receiver operating characteristic curve analysis identified a cut-off value of QT variation superior to −11 ms as best predictor of LQTS. It provided 97% sensitivity and 97% specificity of QT prolongation in the diagnosis of LQTS.
We identified a paradoxical response of the QT interval during MST in LQTS. Easy to assess, MST may be efficient to unmask concealed LQTS in patients at risk of this pathology.
Mental stress induces a paradoxical increase of the QT interval in long QT syndrome patient.
Mental stress test may be efficient to early unmask patients with concealed type 1 and type 2 long QT syndromes.
Introduction
Long-QT syndrome (LQTS) is an inherited arrhythmia characterized by a high risk for ventricular arrhythmia in patients with morphologically normal hearts.1
Major progress in the field of genetics during the last 20 years has enabled the identification of more than 15 associated genes (KCNQ1, KCNH2, SCN5A, ANKB, KCNE1, KCNE2, KCNJ2, CACNA1C, CAV3, SCN4B, AKAP9, SNTA1, KCNJ5, CALM1, and CALM2).2 The first three genes represent the great majority of the genetic abnormalities identified in more than 80% of genotyped LQTS patients. Mutations in each of these three genes induce a specific electrocardiogram (ECG) pattern that could help to diagnose the disease.3
Despite this genotype–phenotype correlation, QT prolongation, the main ECG feature in LQTS, can be difficult to recognize. In families in which a mutation has been identified, 30–40% of the carriers have a normal ECG.2,3 Moreover, although genetic analyses are currently considered as the gold standard in this disease, no genetic defect is identified in approximately 30% of the patients.1,2,4 The latest HRS guidelines recommend considering a diagnosis of LQTS not only in case of corrected QT prolongation greater than 480 ms, but also in case of identification of a pathogenic mutation or a Schwarz score greater than 3.5.1,5
The exercise and epinephrine tests have been suggested to improve LQTS diagnosis.6–9 These tests rely on the paradoxical increase of the QT interval on adrenergic stimulation (physiological or pharmacological) in LQTS patients. However, despite good sensitivity and specificity in uncertain cases, these tests sometime remain inconclusive and quite difficult to interpret in clinical practice.10 The quick standing test described by Viskin et al.11–13 is increasingly used and may be of interest in this context.
We, recently, noted that a psychological stress [mental stress test (MST)] could help to identify a catecholamine-induced QT prolongation in cases of familial idiopathic ventricular fibrillation.14 This association between mental stress and repolarization abnormalities has been previously suggested in healthy or LQTS subjects.15,16 However, only few data are available to describe the response to a MST.17,18 It role in establishing diagnosis has never been investigated in LQTS patients.
The aim of this study was to describe QT response during a MST in concealed LQTS patients and to evaluate the potential role of a MST in LQTS diagnosis.
Methods
Study population
All consecutive patients from 2013 to 2017 who presented genetic diagnosis of LQTS and a concealed QT prolongation (QTc < 470 ms) were enrolled in this study at the Nantes University Hospital.
A population of asymptomatic patients free of any personal past medical history of heart disease was enrolled. This control group has included (i) genotype-negative relatives of LQTS patients with LQTS and (ii) relatives of families with history of unexplained sudden cardiac death (SCD). For the latter, a negative clinical and genetic screening was required in both the patient and the family, including pharmacological and exercise test, as previously described.19
Epinephrine and exercise test were performed according to previous report and to the last guidelines.1,5–9 A positive test was defined by a QTc superior to 480 ms at any moment or by a delta QTc superior to 30 ms. Patients under medication that could interfere with the QT interval, and patients under the age of 15 were excluded. Each patient underwent an ECG at rest and during MST. In order to ensure catecholamine clearance, a minimum interval of 30 min between MST, exercise stress, and epinephrine tests was implemented.
This study was conducted according to European guidelines for clinical and genetic research and approved by the institutional review board. Informed written consent was obtained from each patient who agreed to participate in the clinical and the genetic study.
Mental stress test
During the MST, the subject was exposed to psychological pressure while ECG was recorded to evaluate the effect of stress on electrical activity. The usual method, we used was mental arithmetic (see Supplementary data online, Figure 1) as previously described in Ref.20 The patient was placed in the supine position with no explanation on the course of the test. Mental stress was then performed abruptly. Mental arithmetic constituted the first line questioner. If the subject is willing, additional question (regarding geography or fruits name) was asked according to the patient’s level of education (see Supplementary data online, Figure 1). The test was stopped when steady state was reached.
Electrocardiogram was recorded at baseline and permanently during the test. The baseline ECG at minimal heart rate, and the ECG maximal heart rate during the MST was considered to evaluate QT variation.
Electrocardiogram measurements
Two physicians blinded to the clinical and genetic status of the patients reviewed ECG. In case of disagreement, the measurement was performed by consensus.
P wave, PQ interval, QRS, QT peak, QTend, QTc duration (corrected by Bazett's formula), and Tpeak-Tend interval (TPE, time interval between the peak and the end of the T wave) durations were measured. QT interval was measured (QT) in DII or V5 lead, from the beginning of the QRS complex to the end of the T-wave (defined as the intersection of the tangent of the T-wave and the isoelectric line). The same lead was used for the measurement of baseline and MST ECG in a same patient. When a U-wave was present, it was excluded from the measurement of the QT interval. Three consecutive beats were used for the each QT measurement.
We then calculated variations of these intervals from basal during MST (ΔQT, ΔTPE, and ΔQTc).
All measurements were performed using the Image J software (National Institutes of Health, Bethesda, Maryland, http://rsb. info.nih.gov/ij) as previously described in Ref.21
Statistical analysis
Data were analysed with the GraphPad PRISM software (PRISM version 6.0h; GraphPada Software Inc, La Jolla, CA, USA). Continuous variables are described as mean ± standard deviation or median (inferior quartile; superior quartile), as appropriate. Analysis of continuous variables was performed using the Mann–Whitney test, Kruskal–Wallis rank sum test or ordinary one-way analysis of variance (ANOVA), as appropriate. Categorical variables are described as numbers (percentages). Analysis of categorical variables was performed using the Pearson’s χ2 or Fisher’s exact test, as appropriate.
Linear regression model was used to evaluate the relationship between QT variation (ΔQTtm) and heart rate variation (ΔHR). Receiver operating characteristic curves were performed for each significant parameter. The parameter with the higher area under the curve was defined, and its best threshold value calculation performed. Sensitivity and specificity were presented with 95% confidence intervals. All tests were two tailed and a P-value under 0.05 was considered as statistically significant.
Results
Patient population
Of the 70 subjects (median age 41 ± 2.1 years, 15–83 years, 46% male) enrolled from June 2013 to October 2017, 20 had type 1 LQTS (LQT1), 16 type 2 LQTS (LQT2), and 34 were considered as controls.
Among the LQTS patients (mean age 42 ± 2.7 years, 42% male), 31 presented familial history of LQTS (including seven unexplained SCDs) and five were identified after incidental identification of morphological T wave abnormalities. All of those patients were asymptomatic but carried a familial mutation in the KCNQ1 or KCNH2 genes (mutations are presented in Supplementary data online, Table 1). Exercise test was positive in 14 LQT1 patients (out of 18 patients tested) and in 6 LQT2 patients (out of 11 patients tested). All LQTS patients with negative exercise test have presented a positive epinephrine test.
In the control patients (median age 41 ± 3.2 years, 50% male), eight were family members of LQTS patients but non-carriers of the family mutation. The 26 remaining control patients were from families with histories of unexplained SCD and negative familial and personal genetic and clinical screening.
Long QT syndrome patients presented a longer QT interval at baseline [QT = 405 (389; 416) ms in LQT1 patients; 421 (394; 434) ms in LQT2 patients; 361 (338; 375) ms in controls; P < 0.0001). Heart rate at baseline was higher in controls vs. LQT2 patients [72 (63; 78) b.p.m. vs. 61 (55; 66) b.p.m., respectively; P = 0.0195], but there were no differences between LQT1 and LQT2, and between LQT1 and controls.
Clinical characteristics and ECG measurements are presented in Table 1.
Clinical and electrocardiographic characteristics at baseline
| LQTS (n = 36) | LQT1 (n = 20) | LQT2 (n = 16) | Controls (n = 34) | P-value | |
|---|---|---|---|---|---|
| Clinical characteristics | |||||
| Age (years) | 42 ± 2.7 | 43 ± 3.7 | 40 ± 4.3 | 41 ± 3.2 | 0.9143 |
| Sex (male/female) | 15/21 | 7/13 | 8/8 | 17/17 | 0.5232 |
| Schwartz score | 1.7 ± 0.15 | 1.6 ± 0.17 | 1.8 ± 0.26 | 0.4 ± 0.08 | <0.0001 |
| Baseline ECG | |||||
| Heart rate (b.p.m.) | 61 [56; 68] | 65 [57; 70] | 61 [55; 66] | 73 [63; 78] | 0.0195 |
| PR (ms) | 154 [133; 163] | 155 [137; 167] | 151 [130; 159] | 150 [142; 174] | 0.4655 |
| QRS (ms) | 74 [62; 86] | 71 [61; 90] | 75 [66; 85] | 78 [69; 91] | 0.2203 |
| QT (ms) | 411 [390; 428] | 405 [389; 416] | 422 [394; 434] | 361 [338; 375] | <0.0001 |
| QTc Bazett (ms) | 416 [400; 434] | 420 [395; 437] | 415 [404; 426] | 387 [375; 394] | <0.0001 |
| QTc Fridericia (ms) | 419 [403; 423] | 415 [397; 423] | 419 [407; 424] | 374.8 [364; 383] | <0.0001 |
| Qtpeak (ms) | 349 [328; 361] | 348 [335; 355] | 354 [308; 362] | 300 [277; 318] | <0.0001 |
| TPE (ms) | 62 [52; 73] | 58 [49; 63.03] | 70 [63; 82] | 62 [55; 66] | 0.0036 |
| Stress mental | |||||
| Δ heart rate (b.p.m.) | 18 [15; 22] | 19 [16; 22] | 16 [8; 25] | 21 [14; 26] | 0.3751 |
| ΔQT (ms) | 6 [1; 17] | 9 [4; 18.] | 3 [-6; 16] | −22 [-29;-17] | <0.0001 |
| ΔQTc Bazett (ms) | 67 [44; 91] | 73 [53; 91] | 55 [37; 101] | 24 [10; 40] | <0.0001 |
| ΔTPE (ms) | 8 [−4; 21] | 7 [−4; 20] | 10 [−8; 21] | −9 [−13; −4] | 0.0003 |
ECG, electrocardiogram; LQTS, long QT syndrome; LQT1, type 1 LQTS; LQT2, type 2 LQTS; QT, duration measured on ECG; QTc, QT duration corrected by heart rate; TPE, T peak-Tend interval.
Mental stress test
During the MST, an increase in heart rate was observed in both groups [19 (16; 22) b.p.m. and 16 (8; 25) b.p.m. in the LQT1 and LQT2 patients, respectively vs. 21 (14; 26) b.p.m. in the controls; P = 0, 3751].
During MST, QT interval increased in the LQTS patients [6 (1; 17) ms] while it decreased in the controls [−22 (−29; −17) ms, P < 0.0001] (Figure 1A). This statistical difference was independent of heart rate variation (P = 0.1748, Figure 1B).
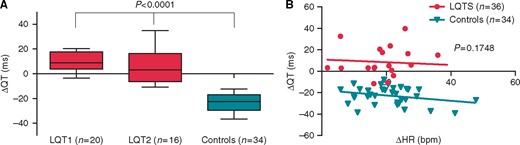
Response to mental stress test (MST) in LQTS patients and controls. QT interval variation from baseline electrocardiogram (ECG) to the ECG with the maximum heart rate during MST is presented in (A) for type 1 LQTS patients (LQT1), type 2 LQTS patients (LQT2), and controls. Statistical significance (***P < 0.0001) is defined between LQT1 patients and controls and LQT2 patients and controls. Variation of the QT interval according to the heart rate is represented in (B) for LQTS patients and controls. Modelization of the variation is presented in each group as a line.
The increase in QT tended to be higher in the LQT1 patients compared with the LQT2 patients without statistical significance [9 (4; 18) ms in the LQT1 patients vs. 3 (−6; 16) ms in the LQT2 patients, P = 0.1662] (Figure 2).
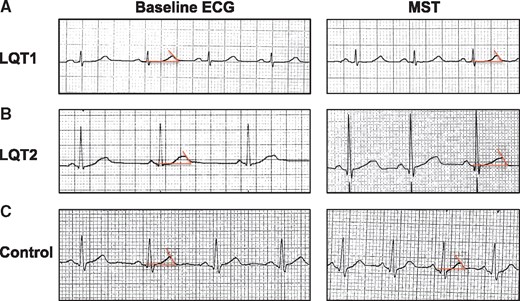
Example of electrocardiogram (ECG) at baseline and during mental stress test (MST) in type 1 LQTS patient (A), type 2 LQTS patients (B), and controls (C). ECG was performed at 25 mm/s and 10 mm/mV. QT interval measurement is defined as the intersection of the tangent of the T-wave and the isoelectric line (red line).
Variation in corrected QT, ΔQT/ΔHR, and TPE were also significantly higher in the LQT1 and LQT2 patients compared with the controls (Table 1).
Diagnostic accuracy of mental stress test
Receiver operating characteristic curve analysis was performed for each significant ECG parameter of the MST (Table 2, Figure 3). Compared with TPE, QTc, QT/HR, ΔQT, ΔTPE, ΔQTc, and ΔQT/ΔHR, ΔQT had the best diagnostic performance with the greatest area under the curve (Table 2).
Areas under the ROC curve estimated for significant parameters
| Area | 95% confidence interval | P-value | |
|---|---|---|---|
| QT | 0.9845 | 0.9600–1.009 | <0.0001 |
| TPE | 0.8084 | 0.7041–0.9127 | <0.0001 |
| QTc | 0.9812 | 0.9559–1.007 | <0.0001 |
| QT/HR | 0.8799 | 0.7971–0.9627 | <0.0001 |
| ΔQT | 0.9975 | 0.9915–1.004 | <0.0001 |
| ΔTPE | 0.7819 | 0.6693–0.8944 | <0.0001 |
| ΔQTc | 0.8554 | 0.7648–0.9460 | <0.0001 |
| ΔQT/ΔHR | 0.9812 | 0.9566–1.006 | <0.0001 |
ECG, electrocardiogram; QT, QT duration measured on ECG; QTc, QT duration corrected by heart rate; TPE, T peak-Tend interval; ΔQT, ΔTPE, ΔQTc, ΔQT/ΔHR, variation of QT, TPE, QTc and QT/HR from baseline; ROC, receiver operating characteristic.

Receiver operating characteristic curves for significant electrocardiogram parameters of the mental stress test (MST). (A) Absolute value measurements and (B) variations from baseline measurement. The best parameter appears to be the variation of QT interval during MST (area under the curve = 0.9845).
Receiver operating characteristic curve analysis identified a cut-off value of QT variation superior to −11 ms as the best predictor of LQTS. It diagnosed LQTS with a sensitivity of 97 (85; 100)% and a specificity of 97 (85; 100)%.
Complications
One LQTS patient had premature ventricular beats during MST. There was neither non-sustained or sustained ventricular tachycardia, nor additional events during MST in any patient.
Discussion
We report a paradoxical response of the QT interval in LQTS during MST. This paradoxical response may add diagnostic value in concealed LQTS patient.
Several observational studies have demonstrated the association between stress and ventricular repolarization abnormalities.22 Stress has also been associated with an increased risk of death among patients with coronary artery disease or with an implanted cardioverter-defibrillator (regardless of the clinical indication).23 Patients with a symptomatic form of LQTS report a higher rate of stressful events compared with asymptomatic ones.24 Interestingly, Finlay et al.20 have recently demonstrated that MST can induce electrophysiological changes even in the context of normal heart function with an heterogeneous shortening of the cardiac action potential in the heart, particularly at short coupling intervals. This dispersion of repolarization could explain the pro-arrhythmic effect of mental stress.14 The paradoxical response to catecholergic stimulation observed in the context of LQTS8 could enhance this pro-arrhythmic effect and explain the relationship between ventricular arrhythmia and psychological stress observed for decades in patients with LQTS.17
In a previous study, on the basis of exercise and epinephrine test in LQTS, we first considered a delta QT >30 ms as a positive MST.6–9,14 This study demonstrates a better sensitivity and specificity with a −11 ms cut-off value. This difference may increase the role of MST in the diagnosis of LQTS.
In a diagnostic setting, QT prolongation on baseline ECG remains inconclusive in 30–40% of LQTS patients.4 While psychological stress appears to be a significant parameter of adrenergic stimulation, which enhances this prolongation, to date only pharmacological and exercise challenges are commonly used in LQTS screening.1 Exercise and epinephrine tests also remain difficult to interpret for diagnosis—a limitation that reduces their use in current guidelines.1,5 Their value has been demonstrated in uncertain cases but protocol standardization and validation remain to be assessed before inclusion in usual screening in the context of LQTS.1,5,7–10 Moreover, given possible misinterpretation and contraindication in some cases, their use in daily practice remains challenging.10,19 Mental stress test has the advantage of being rapid and simple to apply. It could additionally decrease the apparent non-penetrance encountered in LQTS.1,4,5
The autosomal mode of inheritance of LQTS has enabled genotype–phenotype correlation both in diagnosis and prognosis. While arrhythmias preferentially occur during emotional or auditory stress in patients with LQT2, they tend to occur during exercise in the context of LQT1 because IKs activates slowly and is tachycardia-dependent.25 Likewise, while continuous infusion of epinephrine enables accurate diagnosis of LQT1, this test is less effective in LQT2 and LQT3 patients, in whom taking T-wave morphology into account is necessary but leads to decreased specificity.1,3,8
In our study, the MST may also be able to induce QT prolongations in type-2 LQTS. In unaffected individuals, cardiac repolarization occurs with inactivation of ICaL and activation of IKs and IKr. LQT1 and LQT2 are respectively due to an impairment of IKs and IKr. IKs is activated more slowly than IKr, which then is inactivated very rapidly.26,27 These electrophysiological differences explain the differences observed in response to exercise or pharmacological stress.3,8,17,22
In previous studies, these differences appear less important during psychological stress than during pharmacological stress or exercise.3,8,17,22 Although the smaller response of LQT2 appears to decrease the cut-off value of QT variation, the MST appears to remain efficient in diagnosing LQTS with excellent sensitivity and specificity. This may be explained by the induction during MST of a physiological increase in intrinsic sympathetic activity, involving both parasympathetic and sympathetic components. On the contrary, with a global effect on cardiac electrophysiology, the fusion of incremental epinephrine may masked the complex asymmetric and regional effect of the sympathic activity in the heart.20 Additionally, Paavonen et al.17 have demonstrated that the QT interval shortening in response to exercise stress is less important during mental stress test in both LQT1 and LQT2 patient. This effect may be due to a higher adrenaline and lower noradrenaline response during mental stress test than during exercise. Interestingly, as observed in our study, the QT interval shortening observed during exercise stress was more pronounced than the corresponding response to mental stress.17
The QTc prolongation in controls during MST might be difficult to understand since a higher HR usually might shorten the QTc, at least in the spectrum of HR a Bazett’s effect itself is unlikely. Our results are concordant with previous studies suggesting a physiological effect of the stress itself.16
As easy to perform during consultation, MST may be of great interest as a first-line diagnostic test. The supine-standing test have also be suggested to easily provide diagnosis information in LQTS.11 Unfortunately, this test was not performed before the introduction of beta-blockers in our study population that does not allow comparison with MST.
Limitations
First, our study was single centred and should be confirmed by other centres before widespread implementation of MST to identify LQTS. Reproducibility of MST is also unknown, but might be complicated by self-learning effects (e.g. conditioning and knowledge of answers) thereby diminishing is potential clinical use.
Additionally, although we have performed a continuous monitoring of the QT interval during the test, QT measurements were only performed at baseline and at maximum heart rate. Dynamics of QT changes during mental stress may differ in LQT1 and LQT2 patients and be relevant in the diagnosis of LQTS.
Moreover, the use of the Bazett formula may overcorrect and undercorrect QT values according to the heart rate. However, because of it current use in previous studies and because heart rate was similar among groups it appears to us more accurate than Fridericia formula in this study.
Additionally, the overlap between normal epinephrine and exercise tests and normal MST is unknown. Considering, in our control group, patients with normal repolarization reserve, as defined by negative provocative test may select individuals who are expected to have a negative MST. This may artificially increase the specificity of MST in our study.
Several case–control studies have identified different cut-off values for the diagnosis of exercise or epinephrine tests.6–8 Although our criteria are identified as statistically reliable in our study, few data are available to compare the diagnostic thresholds of each value and each test that have been proposed for LQTS. Comparative studies including exercise, epinephrine tests and MST should be performed to define the interest of each test in LQTS screening.
Last, the sensitivity of the tests has been evaluated in a population with a high risk of long QT syndrome. Then, this value can be lower in general population.
Conclusion
We have identified a paradoxical increase of the QT interval during MST in LQTS. In our study, MST appears to allow diagnosis of LQTS in patients with concealed QT prolongation and a familial mutation. Then, MST appears to be a simple, rapid and sensitive test to unmask LQT syndrome in patients at risk of this pathology.
Acknowledgements
We would first like to thank the patients who agreed to be involved in this study. We are also grateful to the ‘Centre de référence des troubles du rythme cardiaque héréditaires ou rares de l’Ouest’, in particular to Annabelle Rajalu and to the molecular diagnosis team of the University Hospital of Nantes, for their help in this study.
Funding
This research received a specific grant from Hôpitaux Universitaires du Grand Ouest and Fondation Maladies Rares [RC17_0357].
Conflict of interest: none declared.
