


Abstract
The primary objective of this study was to use computer simulations to suggest an optimal age for initiation of screening for unknown atrial fibrillation and to evaluate if repeated screening will add value.
In the absence of relevant clinical studies, this analysis was based on a simulation model. More than two billion different designs of screening programs for unknown atrial fibrillation were simulated and analysed. Data from the published scientific literature and registries were used to construct the model and estimate lifelong effects and costs. Costs and effects generated by 2 147 483 648 different screening designs were calculated and compared. Program designs that implied worse clinical outcome and were less cost-effective compared to other programs were excluded from the analysis. Seven program designs were identified, and considered to be cost effective depending on what the health-care decision makers are ready to pay for gaining a quality-adjusted life-year (QALY). Screening at the age of 75 implied the lowest cost per gained QALY (€4 800/QALY).
In conclusion, examining the results of more than two billion simulated screening program designs for unknown atrial fibrillation, seven designs were deemed cost-effective depending on how much we are prepared to pay for gaining QALYs. Our results showed that repeated screening for atrial fibrillation implied additional health benefits to a reasonable cost compared to one-off screening.
What’s new?
This is the first cost-effectiveness study that with a systematic methodological approach trying to optimize a screening program for atrial fibrillation in terms of when the screening is scheduled.
This study suggests several different designs of a population screening program for unknown atrial fibrillation that can be considered cost-effective.
In the absence of clinical studies of different ages of screening initiation and repeated screening, this study attempts to provide a basis for the discussion concerning optimal implementation of screening for atrial fibrillation.
Introduction
Atrial fibrillation (AF) is a common arrhythmia present in approximately 3% of the adult population.1 It is an important risk factor for ischemic stroke.2,3 and is often associated with reduced quality of life.4,5 Stroke is associated with high costs,6 morbidity,4,5 and mortality.7,8 The stroke risk can be effectively reduced through oral anticoagulation treatment (OAC).9 However, approximately 12–24% of all strokes are due to unknown AF.10,11 To reduce the burden of ischemic stroke, opportunistic screening for unknown AF using pulse palpation is recommended by the European Society of Cardiology in individuals aged 65 years and above. Additionally, according to the guidelines population screening may be considered in certain populations.12
The STROKESTOP-study, which was the first randomized multicenter study of systematic population screening for untreated AF using ambulatory ECG recording, was published in 2015.13 The study showed that 25% (210 of 846) of the AF found in the trial was previously undetected. Moreover, it also reported screening to be a clinically- and cost-effective technique for identifying AF in 75/76-year-old individuals.13,14
The STROKESTOP-study was conducted in Sweden, where 53% of all patients diagnosed with AF were aged <75 years.1 If the proportion of undetected AF is similar in this younger age group, then many younger individuals will not receive the appropriate treatment if the first screening occurs at the age of 75 years. On the other hand, many individuals may have the first onset of AF after the age of 75 years. Hence, in the absence of repeated screening, many cases of AF probably remain undetected, and not treated according to the international guidelines. The STROKESTOP study13 and sub-studies14 based on that trial only answer whether screening should be done, as most other screening studies do. These studies do not answer some major questions such as the time-frame for the initiation of the screening and requirement for repetition of the screening. As most health-care decision makers aim to provide as much health as possible in a restricted budget, it is important to use the most effective screening design in terms of when the screening is to be initiated and how often it is to be repeated. Interestingly, compared to drugs and devices that often can be studied in only a few different ways, screening programs can have an almost infinitive number of different designs. This implies that it is virtually impossible to study all possible program variants in clinical trials.
Therefore, the primary objective of this study was to use computer simulations based on the scientific literature to suggest at which age screening for unknown AF should be initiated and whether it should be repeated.
Methods
Model overview
This study was based on a decision-analytic simulation model whose core structure and most important data have been previously published.14 The main purpose of the mathematical Markov model was to simulate how different designs of screening affected a population of 55-year-olds (i.e. 55 years was used as the starting age for all simulated designs). The data used in our model was mainly obtained from the STROKESTOP study13 and was supplemented with inputs from other published studies and registers. In an attempt to be as consistent as possible, the data for various parameters were collected from a Swedish setting whenever possible. Major parameters of the model are presented in Table 1. A lifelong time horizon and a three percent discount rate were used for both cost and effects.
Essential parameters used in the simulation model
| Parameter | Mean | Reference |
|---|---|---|
| Age at simulation start (years) | 55 | Assumption |
| Yearly ischemic stroke risk in AF | ||
| With Apixaban | ||
| CHA2DS2-VASc 2 | 0.008 | 9, 17, 19 |
| CHA2DS2-VASc 3 | 0.012 | 9, 17, 19 |
| CHA2DS2-VASc 4 | 0.018 | 9, 17, 19 |
| CHA2DS2-VASc 5 | 0.027 | 9, 17, 19 |
| CHA2DS2-VASc 6 | 0.037 | 9, 17, 19 |
| Without oral anticoagulants | ||
| CHA2DS2-VASc 2 | 0.024 | 19 |
| CHA2DS2-VASc 3 | 0.036 | 19 |
| CHA2DS2-VASc 4 | 0.054 | 19 |
| CHA2DS2-VASc 5 | 0.083 | 19 |
| CHA2DS2-VASc 6 | 0.113 | 19 |
| Hemorrhagic stroke | 0.33% | 17 |
| Major bleeding | 2.55% | 17 |
| Minor bleeding | 14% | 17 |
| Costs (€) | ||
| Screening handheld ECG | 110 | 27 |
| Stroke ≤1 year | 18 600 | 26 |
| Stroke >1 year | 4400 | 26 |
| Utility weights | ||
| Age 50–59 years | 0.839 | 23 |
| Age 60–69 years | 0.808 | 23 |
| Age 70–79 years | 0.794 | 23 |
| Age 80+ years | 0.733 | 23 |
| QALY-loss ischemic stroke (yearly) | 0.15 | 5 |
| QALY-loss bleeding stroke (yearly) | 0.30 | 5 |
| Assumptions used for all ages | ||
| Proportion unknown | 25% | 13 |
| Yearly spontaneous detection of asymptomatic AF | 5% | Assumption |
| Accepted OAC therapy after screening | 93% | 13 |
| Discontinuation rate <2.5 years after initiation | 11% | 17 |
| Discontinuation rate >2.5 years after initiation | 8% | 18 |
Parameter data
Handheld electrocardiography (ECG) was used as the screening technique to identify previously untreated AF. As in the STROKESTOP-study,13,21 the hypothetical individuals were asked to do a 30 s ECG recording twice daily for two weeks. We assumed that the attendance rate of 53% found in the STROKESTOP study was also relevant when the screening was repeated. However, we assumed that 25% of the population never attended screening regardless of the number of screening occasions. This assumption is supported by the findings of screening studies in other areas.22
The most important finding of the STROKESTOP-study was that previously unknown but detectable AF represented approximately 25% of the total prevalence of AF in 75/76-year-old individuals. In the analysis, this ratio was assumed to be applicable to all individuals aged between 55 and 85 years when no screening was performed, as no other data were available. The yearly incidence of new, detectable unknown AF was calculated based on these prevalence data. Additionally, based on the results of the same study, Apixaban (Eliquis, Pfizer) was expected to be used in 93% of the individuals if AF was detected,13 and the characteristics of the individuals fulfilled the criteria for OAC treatment recommendation in international guidelines.12 A discontinuation rate of 11% per year15 was applied to the model for the first 2.5 years, and after that, we used a yearly rate of 8%.20
The prevalence of diagnosed AF and the mean CHA2DS2-VASc in individuals diagnosed with AF was obtained from a Swedish registry study1,16 (Figure 1). As shown in the Figure1, the CHA2DS2-VASc score increases with age. The risk for untreated individuals to experience ischemic stroke was modelled according to this stroke risk system. The risk reduction of OAC treatment, the risk for other types of cardiac events and complication rates were obtained from the meta-analysis of Hart et al.9 and the ARISTOTLE-study.15,23,24 Moreover, the non-stroke related mortality based on gender and age was obtained from statistics of the overall Swedish population.25
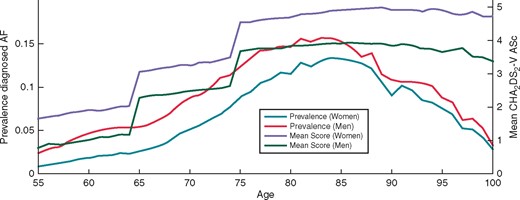
Furthermore, we have assumed that 5% of all unknown AF were spontaneously detected every year. For the control group with no screening, the prevalence and incidence of diagnosed AF were modelled according to real-world data from a Swedish registry study (Figure 1).1
The age and gender dependent quality of life in the simulated population was obtained from Burstrom et al.19 In the study, health-related quality of life was collected with EuroQol- 5 Dimension (EQ-5D) and was translated into utility weights, i.e. quality-adjusted life-years (QALYs), using the British value-set published by Dolan.26 Decrements in the quality of life due to ischemic and haemorrhagic stroke were obtained from Lee et al.5
All costs were calculated from a health care payer perspective and no production losses were included in the base-case scenario. The drug costs were gathered from Pharmaceutical Specialties in Sweden (FASS),27 and the costs of stroke were obtained from a Swedish registry study that included costs incurred for acute visit, rehabilitation and follow-up, drugs, home assistance, and residential housing.18 No costs or health effects related to informal care were used in the analysis. The cost for the screening procedure was obtained from a previously published cost-effectiveness study of screening using handheld ECG stroke survivors.17
All unit costs were adjusted to the year 2016 and converted to Euro using the exchange rate on 10 January 2016 (€1 = 9 SEK, £1= €1.2). Additionally, 3% was used as a discount rate for both costs and effects.
Initiation age and repeated screening
In Sweden, approximately 80% of all patients diagnosed with AF are between 55 and 85 years.1 Thus, it seems reasonable to assume that screening for unknown AF is most appropriate for individuals within this age interval. We have also assumed that a maximum of one screening occasion every year would be adequate. Using these assumptions for screening initiation and repeated screenings, there are 2, 147, 483 and 648 different possible designs of programs with population screening for unknown AF. These programs are defined in Table 2.
Definition of possible program designs
| Program design | Design definition |
|---|---|
| 1 | No screening |
| 2 | Screening at the age of 55 years |
| 3 | Screening at the age of 56 years |
| 4 | Screening at the ages of 55 and 56 years |
| 5 | Screening at the age of 57 years |
| 6 | Screening at the ages of 55 and 57 years |
| … | … |
| 34, 635, 777 | Screening at the ages of 70, 75 and 80 years |
| … | … … |
| 2, 147, 483, 648 | Screening every year from age 55 to 85 years |
In the model simulation, all these designs of screening were tested and analysed in MathWorks MATLAB. A thousand individuals were simulated for invitation to be screened or not for each possible screening design. The thousand hypothetical individuals simulated without screening served as reference group in the analysis. From the total number of possible designs, many were excluded from the analysis as they indicated worse outcome to higher costs compared to another program design. Program designs which implied inferior clinical outcome and were less effective (in terms of cost per gained QALY) compared to any of the other programs were also removed as these never can be considered cost-effective. Additionally, designs that implied a cost per gained QALY that was over €100 000 were not considered in the analysis.
Sensitivity analyses
To assess the robustness of our results, deterministic two-way sensitivity analyses were performed on the assumptions made in our model. Furthermore, probabilistic analyses were conducted to study the statistical uncertainty.
Results
The results of the simulation model revealed that screening led to increased detection of AF compared to no screening. Moreover, if the number of screening occasions were increased, this resulted in earlier detection of AF but at a higher cost. When all the possible designs of screening programs were considered, screening at the age of 75 years demonstrated the lowest cost per gained QALY (€4, 800 per gained QALY).
After excluding ineffective program designs, seven program designs remained and can be considered cost effective depending on how much the health-care decision makers are ready to pay for gaining additional QALYs. The cost-effectiveness results of these program designs are shown in Figure 2 and presented in Table 3. Table 3 shows that it is possible to gain increasingly more QALYs by changing the design of the screening program, but this comes with an increasingly higher price per QALY. Population screening for unknown AF is cost-effective if a cost of €4 800 (or higher) per gained QALY is considered reasonable, while no screening should be implemented if this is not an acceptable cost. If we are prepared to pay between €4, 800 and €31, 000 per QALY, then screening once at the age of 75 years is the best option. Using a value for gaining a QALY that is between €40, 000 and €74, 000, screening at the ages of 65, 75 and 80 years is cost-effective. The cost per gained QALY of all screening designs compared to the next best option is showed by the lower limit in the range presented in Table 3.
Outcome of the optimal designs of screening for AF with handheld-ECG
| Age when screening is conducted (years) | Cost per gained QALY compared to no screening (€) | The design is the best option when a QALY is worth between (€) | Prevented stroke per 1000 simulated 55-year-olds (Cost per stroke €) |
|---|---|---|---|
| All | |||
| No screening | – | <4 800 | |
| 75 | 4 800 | 4 800*–31 000 | 3.1 (7 300) |
| 75, 80 | 9 500 | 31 000–37 000 | 4.1 (13 200) |
| 68, 75, 80 | 15 800 | 37 000–40 000 | 4.7 (21 000) |
| 65, 75, 80 | 16 400 | 40 000–74 000 | 4.7 (20 600) |
| 65, 75, 78, 82 | 19 500 | 74 000–77 000 | 5.1 (23 900) |
| 65, 70, 75, 78, 82 | 24 500 | 77 000–10 0000 | 5.3 (31 600) |
The cost per QALY compared to the next best screening option is showed by the first number in this range.
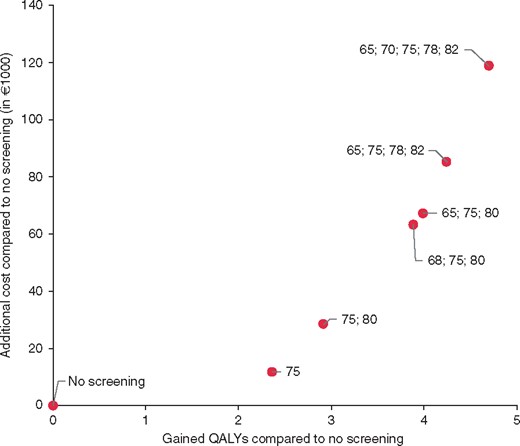
Costs and effects of the potentially optimal designs for screening for AF with handheld-ECG in 1000 hypothetical individuals.
The sensitivity analyses of the major assumptions in the model are presented in Table 4. Probabilistic figures, where the statistical uncertainty of the model was studied, are available in the supplementary material online, Appendix (see Supplementary material online, Figures S1 and S2) . Furthermore, the simulation model showed that when men and women are in separate programs, the cost per gained QALY is lower in women [especially in younger age groups (Supplementary material online, Appendix)].
Sensitivity of important assumptions used in the model on the cost per gained QALY
| Screening scheduled to | Reference (Cost/QALY vs. no screening) | Cost of the screening | Spontaneous detection | Discount rate | Initial OAC adherence | Incidence of unknown atrial fibrillation | Ischemic stroke risk of screening detected compared to spontaneous detected AF | ||||||
|---|---|---|---|---|---|---|---|---|---|---|---|---|---|
| −25% | +25% | 0% | 10% | 0% | 5% | 50% | 100% | −25% | +25% | −25% | +25% | ||
| 75 years | 4800 | 2300 | 7300 | 3000 | 6900 | 400 | 8400 | 14 100 | 4100 | 8800 | 2500 | 16 600 | Dominant |
| 75 and 80 years | 9500 | 6100 | 12 900 | 8000 | 11 200 | 4500 | 13 500 | 22 300 | 8500 | 15 000 | 6200 | 23 400 | 1900 |
| 68,75 and 80 years | 15 800 | 11 000 | 20 500 | 13 600 | 18 200 | 8400 | 22 200 | 31 000 | 17 000 | 22 800 | 11 600 | 32 100 | 7000 |
| 65, 75 and 80 years | 16 400 | 11 500 | 21 200 | 13 800 | 19 200 | 8300 | 23 700 | 32 100 | 15 100 | 23 500 | 12 100 | 32 700 | 7600 |
| 65,75, 78 and 82 years | 19 500 | 13 800 | 25 100 | 17 100 | 21 900 | 11 200 | 26 900 | 37 600 | 18 100 | 27 700 | 14 600 | 37 100 | 9900 |
| 65, 70, 75, 78 and 82 years | 24 500 | 18 100 | 31 000 | 22 400 | 26 800 | 14 900 | 33 100 | 45 200 | 22 900 | 34 100 | 18 700 | 44 200 | 13 800 |
OAC, Oral anticoagulants; AF, Atrial fibrillation.
Discussion
This analysis was, to our knowledge, the first study trying to identify an optimal design of a screening program for unknown AF using a methodological approach. In the study, we systematically analysed and evaluated numerous different designs of screening programs for unknown AF that could be considered optimal. Depending on the willingness to pay for gaining QALYs of various health-care systems, different programs could be considered as cost-effective. Most countries do not have a stated cost-effectiveness threshold (the maximum we are prepared to pay for gaining a QALY). However, with a threshold value of approximately €50, 000 per QALY, which often has been used in the literature for Sweden,28,29 the most optimal program in a Swedish setting would be to screen at the ages of 65, 75 and 80 years. In comparison with the program design used in the STROKESTOP-study (one-off screening at the age of 75 years),13 this design is expected to reduce the number of strokes with 1.5 and gain 1.6 additional QALYs to a total cost of approximately €55, 400 per 1000 invited individuals. This implies a cost of €34, 000 per gained QALY. There are no reasons to expose 65- and 80-year-old individuals to the high risks of ischemic stroke if it can be avoided at a reasonable cost. In a country sized as Sweden, this program design implies 174 gained QALYs and a cost of €5.8 million compared to the screening performed in the STROKESTOP-study and 461 gained QALYs to a cost of €7.5 million compared to no screening. Hence, our results indicate that more screening than is recommended by European Society of Cardiology could be clinical- and cost-effective. Currently, only opportunistic screening and screening in stroke survivors is recommended, while population screening in high risk individuals may be considered.12 Clinical studies with longer follow-up are needed to validate our simulation generated results.
Even though the simulation models are not considered equivalent to randomized clinical trials by policy makers, they are important in areas such as screening programs, where it is virtually impossible to clinically study all the different possible programs. Our results can be applied to identify the designs that are deemed optimal, which could then be studied clinically. Using this approach, we can save the scarce resources of the society by reducing the risk of studying and using ineffective program designs. Additionally, our study can serve as a basis for further debate regarding if and how screening for AF should be implemented.
A limitation of simulation models in complex areas such as health and health care is that they rely on assumptions about required unknown parameters such as stroke risk, drug adherence and costs. This uncertainty was controlled by using two-way sensitivity analyses to study the importance of assumptions in the model. One of the most important assumption was that approximately 25% of all AF are undetected if no screening is implemented.13 It is difficult to validate this number as, to the best of our knowledge, only one study has performed population screening for asymptomatic AF. Further studies are necessary to validate this parameter, especially in populations not aged 75/76 years. Another assumption used in our model was that 93% of the individuals started OAC therapy when AF was found. This was based on data from the STROKESTOP-study13 and the discontinuation rates were based on the ARISTOTLE-study15 and a Swedish registry study.20 The discontinuation rates are lower than what have been found in other parts of the world30 but is higher than the findings in another Swedish study.31 As shown in the sensitivity analyses, it is important for the cost-effectiveness results that individuals with detected AF and a high risk of stroke are treated. This could motivate efforts to design screening programs for AF in a way that achieve high adherence rates to anticoagulant treatments for patients with newly detected AF, but also to improve the adherence in those that are previously diagnosed. Another assumption, that is important for the cost-effectiveness, was that screening detected AF entailed the same risk for ischemic stroke as spontaneous detected. There is currently inconclusive data regarding this and the screening program should be reevaluated if long-term follow-up data from STROKESTOP-study13 or other studies shows that this is not the case. Furthermore, in this analysis we used a conservative approach and did not include cost related to production losses or informal care. If these costs were included, the cost-effectiveness of screening would improve, especially for designs with several screening occasions.
We investigated population screening for different ages. Nevertheless, all 65 years do not have CHA2DS2-VASc ≥ 2. One example of an option not investigated in this analysis was to screen only 65-year-olds with additional risk factors and then later perform the mass screening. Another strategy could be to use different programs for men and women. The women benefited more from more frequent screening occasions in our simulation, despite a lower prevalence of AF, because they are expected to have a higher risk of stroke in case of AF (according to CHA2DS2-VASc) and they generally live longer than men. However, the risk in women compared to men needs to be further studied in order to serve as a basis for any conclusions.
Another limitation of our study was to include only handheld ECG as the technique to determine and screen for AF. Various studies have shown that 24-h Holter ECG, pulse palpation, insertable cardiac monitors and 14-day ambulatory ECG adhesive patch monitors are also effective in identifying previously unknown AF.32–38 The rate of new AF found in these studies were generally lower than in the STROKESTOP-study, which are expected as these included younger individuals and often used one-off screening. However, screening with pulse palpation39,40 and iPhone ECG41 have still been deemed cost-effective. The cost-effectiveness in these studies were similar to the results of this study and the small differences can be explained by the use of opportunistic screening, different settings and other screening techniques. Further studies should investigate the relative effectiveness of the other screening techniques. However, despite differences in setting and screening technique, the analysis of Moran et al.40 showed, as our study, that repeated screening can increase the benefits to a reasonable cost. Further, the analysis also showed that the lowest cost per gained QALY was achieved when the screening was conducted once at the age of 75 years. The small differences between the current analysis and the analysis of STROKESTOP study14 (€4800 vs. €4300) are due to the differences in the AF prevalence of 75-year-olds in the STROKESTOP-study and in the general population of Sweden.
Conclusions
In conclusion, examining the results of more than two billion simulated population screening program designs for unknown atrial fibrillation, seven designs were deemed cost-effective depending on how much we are prepared to pay for gaining QALYs. Our results showed that repeated screening for atrial fibrillation implied additional health benefits to a reasonable cost compared to one-off screening.
Supplementary material
Supplementary material is available at Europace online.
Conflict of interest statement: Mattias Aronsson reports no conflicts of interest. Emma Svennberg has received lecture fees from MSD, BMS-Pfizer, Boehringer-Ingelheim, Bayer and Sanofi, and a research grant from Boehringer-Ingelheim. Johan Engdahl has received consultancy fees from Sanofi and Pfizer, lecture fees from Astra Zeneca, Boehringer-Ingelheim, Medtronic and Bristol-Myers Squibb, travel expenses from Boehringer-Ingelheim and Sanofi. FA-K has received lecture fees from Pfizer-BMS, Boehringer-Ingelheim, Bayer and Sanofi-aventis. MR has received consultancy fees, research grants and lecture fees from Bayer, Boehringer-Ingelheim, Bristol-Myers Squibb, Medtronic, Pfizer, St Jude Medical and Zenicor. LF has received research grants from Bayer, Boehringer-Ingelheim, Bristol-Myers-Squibb and Sanofi and fees for lectures from Bayer, Boehringer-Ingelheim, Bristol-Myers-Squibb, Sanofi and St Jude Medical.VF-K has received lecture fees/grants from MSD, Medtronic, Bayer, Boehringer-Ingelheim, Laerdahl and research collaboration with St Jude Medical and Medtronic. L-ÅL reports economic support for lecturing, advisory boards and research from AstraZeneca, Bayer, Boehringer Ingelheim, Pfizer and St Jude Medicals.
Funding
This research was supported by grants from The Dental and Pharmaceutical Benefits Agency.
