


Abstract
Health economic considerations have become increasingly important in healthcare. The aim of this study was to investigate the incremental cost effectiveness of cardiac resynchronization therapy (CRT) plus medical therapy compared with medical therapy alone in the Greek health-care system.
The health economic analysis was based on the CARE-HF trial, a randomized clinical trial estimating the efficacy of adding CRT (n = 409) to optimal pharmacological treatment (n = 404) in patients with moderate-to-severe heart failure with markers of cardiac dyssynchrony. Health care resource use from CArdiac REsychronization in Heart Failure was combined with costs for CRT implantation and hospitalization from publicly available sources. The analysis was based on a lifetime perspective, with the life expectancy estimated from the clinical trial data. Shorter time horizons were explored in the sensitivity analysis. The cost per quality-adjusted life year (QALY) gained with CRT was €6 045 in Greece, with a 95% confidence interval for the cost-effectiveness ratio of €4 292–9 411 per QALY gained.
The results of the economic evaluation of CRT in Greek health-care setting indicate that it is a cost-effective treatment compared with traditional pharmacological therapy. Cardiac resynchronization therapy can therefore be recommended for routine use in patients with moderate-to-severe heart failure and markers of dyssynchrony.
Introduction
Cardiovascular disease is the leading cause of death in Western societies,1 and is associated with high health-care costs.2 Although the mortality from cardiac disease in Greece is below the European average,3 it is still a major public health problem. Heart failure has a prevalence of 1–2% in the developed countries, and is the leading cause of hospitalization in patients >65 years.4
Standard therapy for heart failure involves diuretics, angiotensin-converting enzyme inhibitors, and beta-blockers.5 Even though there have been improvements in the therapy of heart failure, the prognosis remains poor for patients with moderate-to-severe heart failure, with a mortality rate 4–8 times higher than that of the general population of the same age.6 Randomized controlled trials have shown that the addition of cardiac resynchronization therapy (CRT) to standard and optimized pharmacological treatment improves symptoms, exercise capacity, ventricular function, and quality of life (QoL), and reduces complications and mortality, in patients with moderate or severe symptoms of heart failure.7 The CArdiac REsychronization in Heart Failure (CARE-HF) trial was the first to show that CRT leads to improved survival in addition to improving symptoms and QoL.8,9
Cardiac resynchronization therapy is recommended in patients with severe heart failure, i.e. New York Heart Association (NYHA) function Class III–IV with broad QRS complex >120 ms, and left ventricular dysfunction with left ventricular ejection fraction <35%, who despite optimal pharmacological therapy have not improved.5,7 Cardiac resynchronization therapy is also indicated in patients with severe heart failure if hypotension or bradycardia makes effective medical therapy difficult.
Although several economic evaluations of CRT have previously been published,10 clinical routines associated with device implant procedures, post-implant monitoring of patients and follow-up may vary significantly between different countries. The aim of this study was to assess the cost effectiveness of CRT in a Greek health-care setting based on the CARE-HF trial. In order to adapt the results from the clinical trial so that the economic evaluation accurately reflects the cost effectiveness in Greece, we used data from CARE-HF, combined with information from Greek data sources on unit costs for CRT and hospitalizations.
As noted by Calvert et al.11 in an economic evaluation of CRT in the United Kingdom based on CARE-HF, a within-trial approach to economic evaluation underestimates the total benefit of CRT, since survival is truncated at the end of follow-up. In the present analysis we instead used a lifetime perspective as main analysis, which may furnish a more realistic estimate of the health benefits of CRT. A lifetime perspective has previously been used by Yao et al.12 who developed a simulation model analysing the cost-effectiveness of CRT with or without an implantable cardioverter-defibrillator (ICD) in a UK setting. The within-trial approach to estimating the health effects is conservative since benefits may continue to accrue during longer periods of follow-up. Our approach in this study may therefore offer a more realistic picture of the long-term benefits of CRT than a within-trial approach; the primary rationale for using a lifetime analysis as main analysis in the present study.
Methods
Clinical data
The CARE-HF trial included 813 patients with heart failure due to left ventricular systolic dysfunction and markers of cardiac dyssynchrony.8 Patients were randomized (with stratification by NYHA class) to receive pharmacological therapy alone (n = 404) or in combination with CRT (n = 409). The primary end-point was time to death from any cause or an unplanned hospitalization for a documented major cardiovascular event. Major events included worsening heart failure, myocardial infarction, unstable angina, arrhythmia, stroke, or other major cardiovascular event (e.g. pulmonary embolism or ruptured aortic aneurysm). Hospitalization due to a serious procedure-related complication (e.g. infection, pericardial haemorrhage, or tension pneumothorax) was also counted as a major event. Only the first event in each patient was included in the analysis. The principal secondary end-point was death from any cause. Quality of life, which was also a secondary end-point, was measured with the Minnesota Living with Heart Failure (MLWHF) questionnaire at baseline, 3 months, 18 months, and the end of study, and the EuroQoL EQ-5D instrument at baseline and 3 months.8,13,14 The mean follow-up time was 29.4 months. The primary end-point was reached by 159 patients in the CRT arm, compared with 224 patients in the arm receiving pharmacological treatment alone [hazard ratio (HR) 0.63; 95% confidence interval (CI) 0.51–0.77; P< 0.001]. There were 82 deaths in the CRT arm, compared with 120 in the medication arm (HR 0.64; 95% CI 0.48–0.85; P< 0.002).8
Health economic analysis
The health economic analysis evaluated the cost effectiveness of CRT plus medical therapy compared with medical therapy alone, to assess whether the health improvement achieved with CRT gives good value for the money in Greek health-care setting. The base case analysis was based on a lifetime approach with extrapolated survival and health utility. A within-trial approach, only considering costs and health effects accrued within the CARE-HF trial, was included as a sensitivity analysis.
Effectiveness was assessed in terms of quality-adjusted life-years (QALYs) gained which not only measures health gains in terms of increased life expectancy but also takes improvements in health utility into account.15 Health utility was estimated based on results from the EuroQoL EQ-5D questionnaire.13,16 We also estimated the results in life years gained (LYG) without any quality adjustment. In order to assess the cost effectiveness, the cost per QALY gained was compared with a threshold value, i.e. the ‘willingness to pay’ (WTP) per QALY gained, which should reflect how much society would be willing to pay for an additional QALY.17
Health utilities directly based on the EQ-5D score were available in the study at baseline and 3 months. Health utilities were estimated at 18 months and at the end of the study based on a mixed model of the relationship between change in EQ-5D score to change in MLWHF as described by Calvert et al.11 A utility of 0 was applied to patients at death, and at the time of censorship for patients receiving a heart transplant or withdrawing from the study. A last observation carried forward approach was used for the extrapolation of utility during further lifetime gains beyond the end of follow-up in the clinical trial.
Survival analysis
For the base case analysis, extrapolated survival beyond the clinical trial was used in order to capture the long-term benefits of CRT therapy. The survival time within the trial follow-up period was estimated from the Kaplan–Meier curves in the main study (mean follow-up of 29.4 months).8 We assumed that patients surviving throughout the clinical trial had an expected additional lifetime that was determined by fitting a parametric survival function to the clinical-trial data. It was assumed that the survival in the treatment and control group followed two different exponential survival curves estimated from the respective within-trial survival curves for the remaining lifetime of the patients.18 The exponential survival curve was chosen because it had the best model fit according to the Akaike information criterion.11 Based on manufacturer data and clinical expertise, previous analyses have assumed that CRT batteries would be replaced every 6.5 years and CRT-ICD batteries every 5.5 years.19,20 Although most patients had CRT devices, for the base case analysis we conservatively assumed replacement after 6 years for all devices. These assumptions were varied in the sensitivity analyses (see below).
The approach is illustrated in Figure 1. The extrapolated curves in Figure 1 start when trial follow-up ends, which means that the extrapolated survival curve will start at a higher level in CRT group compared with the control group. The difference in survival is represented by the difference in area between the two survival curves (Kaplan–Meier curves from trial continued with extrapolated survival curves).15
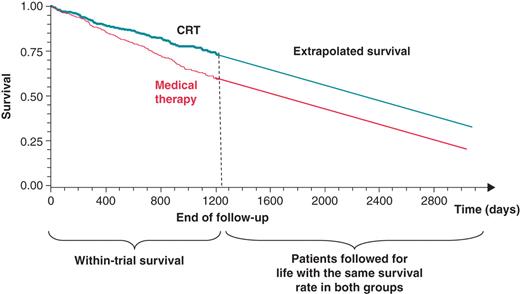
Within-trial survival and predicted survival curves beyond the end of follow-up in the clinical trial. CRT, cardiac resynchronization therapy.
Estimation of costs
The analysis was undertaken from the perspective of the health-care payers in Greece, i.e. the social insurance funds.21,22 As there are differences between public and private providers, the analysis took both sectors into account. The health-care resource use was taken from the CARE-HF clinical trial database, while hospitalization costs were collected from the database of the National Insurance Fund (IKA), the largest social insurance fund covering 50% of the population.21 This analysis is applicable for the other social insurance funds in Greece and costs are expressed in Euros and in 2011 prices. Since there were no significant differences between the treatment group and the control group in terms of pharmaceutical consumption (P value = 0.72), in spite of a longer mean follow-up time in the treatment group, the pharmaceutical costs were excluded from the analysis.
In Greece the reimbursement for an implantation of a CRT-P (without defibrillation capability) or CRT-D (with defibrillation back-up) device covers the cost of the device plus some of the hospitalization costs. There is no reimbursement for the procedure as such. Claims (reimbursement) data were obtained from the main social insurance fund IKA. The database comprised 12 469 patients who had a pacemaker or an ICD implantation between 2004 and 2008. Those patients who had a CRT-P or CRT-D either in 2007 and 2008 were identified and from this sample an average reimbursement cost was estimated for the private and public health-care sectors both separately and combined. The cost estimation for devices was complemented and updated with data on 2011 prices from the price observatory of the National Procurement Committee in Greece. The weighted cost was used in the base case analysis. Total cost was broken down into the cost of device and the remaining costs. As data specifically on failed operations or re-operations are not available, it is assumed that the cost and the reimbursement tariff is the same as that of an initial operation.
The reimbursement cost per hospital day (clinic, cardiac care unit, or intensive care unit) is set by legislation and is standard across public and private hospitals. The same applies for primary care visits. It should be noted that in the private sector there are co-payments made directly by patients, but since the analysis is from the perspective of the third-party payer such co-payments are not considered in this analysis.
In Greece the reimbursement for a percutaneous coronary intervention (PCI) or a coronary artery bypass grafting is set at a fixed amount which covers the hospitalization, the diagnostic procedure and the intervention. Extra changes are possible under certain circumstances; for example, extra balloons and stents are added on top of the fixed amount for a PCI. Claims (reimbursement) data were obtained from the main sickness fund IKA. The average reimbursement cost in 2011 was estimated for the private, public, and the entire health-care sector. The unit costs are listed in Table 1.
Unit costs (€) from hospital price lists
| Resource | Cost(€) | Comment |
|---|---|---|
| CRTa | 7 906 | Total cost of treatmentb |
| CRT-ICDa | 20 573 | Total cost of treatmentb |
| Failed CRT operation | 1 906 | Assumed to be the same as the total cost of treatment minus the device cost |
| CRT re-operation | 1 906 | Assumed to be the same as the total cost of treatment minus the device cost |
| Heart transplant | 14 674 | Cost per procedureb |
| CABG | 9 572 | Cost per procedureb |
| PCI | 5 397 | Cost per procedureb |
| ICU stay | 188 | Cost per dayc |
| CCU stay | 94 | Cost per dayc |
| Hospital stay (cardiac) | 70 | Cost per dayc (59–103; average assumed to be 70) |
| Other wards | 70 | Cost per dayc (59–103; average assumed to be 70) |
| Cardiac day care | 73 | Cost per dayc |
| Cardiac outpatient visit | 5 | Cost per visitc (does not include examinations or tests) |
CRT, cardiac resynchronization therapy; ICD, implantable cardioverter-defibrillator; ICU, intensive care unit; CCU, cardiac care unit; CABG, coronary artery bypass grafting; PCI, percutaneous coronary intervention.
aIncluding device cost, implantation procedure, and hospitalization.
bReimbursement claims data from the Hellenic Social Insurance Fund (IKA) and the price observatory of the National Procurement Committee (2011 price level).
cReimbursement rate determined in IKA document FEK 99/B/10–2–1998, Y4a/oik.1320.
Since a surviving patient may have use for the device for several years beyond the follow-up of the trial, the device cost was calculated as an annuity, i.e. a yearly stream of fixed costs over the lifetime of the device, rather than as a lump sum cost at the time of the intervention.23 The full cost of the device was attributed to patients who died or underwent heart transplantation. For patients with CRT who survived until the end of the study the costs were spread over the entire battery lifetime of the device, i.e. 6 years in the main analysis. In the main analysis, both the health effects and the costs were discounted at a rate of 3%.24
Methods used to investigate uncertainty of data
Statistical simulation techniques
The methodology used for estimating the uncertainty of the data combines bootstrap resampling of data from the clinical trial with stochastic modelling of the expected remaining lifetime after the clinical trial for the patients who were alive after the end of follow-up.25,26 Bootstrapping is a statistical method for estimating the sampling distribution of an estimator by sampling with replacement from the original sample.25 Resampling was performed for the CRT group and for the control group separately. In each group, 2000 resamples with sizes equal to the original sample sizes were drawn with replacement (n = 409 for CRT and n = 404 for control). Each individual patient who was resampled from the clinical trial data by the bootstrap technique, and who was alive at the end of follow-up, was assigned an expected additional lifetime drawn from an exponential distribution estimated from clinical trial data. The confidence intervals (CIs) were then calculated by the percentile method.25
Sensitivity analysis
The sensitivity analysis was performed by varying variables for which there is uncertainty over a reasonable range and recording the related changes in the final results. The uncertain variables included in the sensitivity analysis were the average additional lifetime after the end of follow-up, the discount rate, and the difference in survival between the CRT group and the control group. The discount rate for both costs and health effects was varied between 0 and 5%. The discount rate for the health effects was also set to 0%, while keeping the discount rate for costs at 3% in the main analysis. The assumption regarding the survival after the end of follow-up was varied in several ways, as described in the paragraph below.27 In the main analysis, different survival curves were assumed for the treatment and the control group for 6 years. Then the same survival curve was used in both groups for the remaining lifetime.
In the base case analysis, a lifetime perspective was used. It was also assumed that treatment would go on indefinitely with battery change performed every 6 years. The sensitivity analyses further tested the following three situations: (i) the same mortality rate was assumed for both groups after the end of trial for a timeframe of up to 6 years (up to the first battery change); (ii) extrapolated mortality rates were assumed to persist in the treatment and the control groups for a timeframe of up to 6 years;9 and (iii) extrapolated mortality rates were assumed to persist in the treatment and the control groups for a timeframe of up to 6 years, then the same mortality rates were used in both groups for the remaining lifetime of the patients. The two first scenarios have a shorter timeframe, while the third uses a lifetime analysis, but with the assumption that the CRT device would not be replaced after 6 years. These three scenarios are all more pessimistic than the base case scenario. The sensitivity of the base case results to device lifetime was also assessed by varying the device lifetime between 5 and 7 years, the former being more pessimistic than the base case and the latter more optimistic. The base case analysis used weighted costs combining the public and private health-care sector perspectives, but the sensitivity analysis includes separate results for the two perspectives. The cost-effectiveness of CRT-D was estimated by adding the difference in cost between the CRT-D and CRT-P (€20 573−€7 906 = €12 667) to all patients with a CRT intervention in the CRT arm. As the effectiveness of CRT-P cannot be estimated from the CARE-HF study alone, the incremental effect of CRT-D compared with CRT-P was taken from a previous study by Yao et al.,12 which estimated the incremental effect between CRT-D and CRT-P at 0.69 QALYs. This difference was added to all patients with a CRT intervention.
A cost-effectiveness acceptability curve was produced to illustrate the probability that CRT is cost effective compared with the standard therapy alone for a range of threshold values for the WTP per QALY.28
Results
Base case results
The costs associated with medical therapy and additional CRT therapy are shown in Table 2. The incremental cost per QALY gained associated with CRT therapy was €6 045 per QALY gained (95% CI: €4 292–9 411) and €6 222 (95% CI: €4 251–10 412) per LYG.
Cost and health effects in the main analysis
| Costs/effects | Medical therapy arm | CRT arm | Mean difference |
|---|---|---|---|
| (n= 404) | (n= 409) | (CRT-MT) | |
| Mean cost (€) | 4 374 | 12 898 | 8 524 |
| Mean QALYs | 3.98 | 5.39 | 1.41 |
| Mean life years | 5.38 | 6.75 | 1.37 |
| Cost per QALY or per life year gained | Lower CI limit | Upper CI limit | |
| ICER (€/QALY) | 6 045 | 4 292 | 9 411 |
| ICER (€/LYG) | 6 222 | 4 251 | 10 412 |
CRT, cardiac resynchronization therapy; ICER, incremental cost-effectiveness ratio; LYG, life year gained; MT, medical therapy; QALY, quality-adjusted life year; CI, confidence interval.
Figure 2 shows the cost-effectiveness acceptability curves for the main scenario. Given a WTP threshold > €25 000 per QALY, the probability that CRT is cost effectiveness is close to 100%.
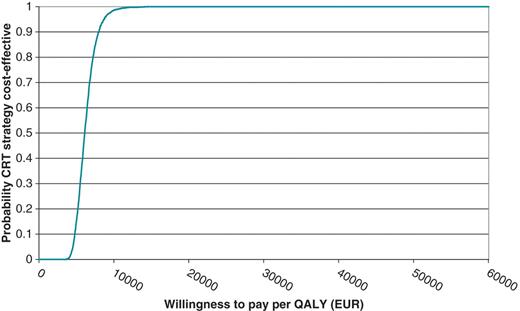
Cost-effectiveness acceptability curve for the base case analysis (€). QALY, quality-adjusted life year.
Sensitivity analysis
Within-trial analysis
The results from the within-trial analysis are shown in Table 3. Compared with the main scenario, which was based on an analysis extended beyond the clinical trial, both costs and health effects are lower. The cost per QALY gained for CRT compared with pharmacological therapy alone was €16 780 (95% CI: €10 399–31 602).
Cost and health effects in the within-trial analysis
| Costs/effects | Medical therapy arm | CRT arm (n= 409) | Mean difference |
|---|---|---|---|
| (n= 404) | (CRT-MT) | ||
| Mean cost (€) | 3 262 | 6 618 | 3 356 |
| Mean QALYs | 1.22 | 1.42 | 0.20 |
| Mean life years | 1.91 | 2.01 | 0.10 |
| Cost per QALY | Lower CI limit | Upper CI limit | |
| ICER (€/QALY) | 16 780 | 10 399 | 31 602 |
| ICER (€/LYG) | 33 560 | Dominant | 234 090 |
Dominant implies that the costs are lower and health effects are better.
CRT, cardiac resynchronization therapy; ICER, incremental cost-effectiveness ratio; LYG, life years gained; NMB, net monetary benefit; MT, medical therapy; QALY, quality-adjusted life year.
Additional sensitivity analyses
The results of the additional sensitivity analyses show that the cost-effectiveness results are relatively stable for variations in the discount rate, and the battery lifetime of the CRT device (Table 4). The largest variation was obtained by varying the survival assumptions after the end of follow-up. However, in no scenario were the variations in results large enough to change the conclusions from the analysis.
Sensitivity analysis
| Scenario | Difference in cost (€) | Difference in effect (QALYs) | ICER €/QALY (95% CI) |
|---|---|---|---|
| Main analysis (lifetime timeframe) | 8 524 | 1.41 | 6 045 (4 292–9 411) |
| Costs and health effects undiscounted (lifetime timeframe) | 11 774 | 2.44 | 4 825 (3 320 –7 958) |
| Costs and health effects discounted at 5% (lifetime timeframe) | 11 911 | 1.02 | 11 677 (8 181–17 697) |
| Health effects undiscounted, costs discounted at 3% (lifetime timeframe) | 12 023 | 2.45 | 4 907 (3 437–8 187) |
| Same mortality rate in CRT and control groups assumed between end of trial and 6 years (6 year time frame) | 1 986 | 0.43 | 4 619 (2 163–10 602) |
| Different mortality rates in CRT and control groups assumed between end of trial and 6 years (6 year time frame) | 1 977 | 0.52 | 3 802 (1 895–7 368) |
| Same mortality rate in CRT and control groups assumed from the end of trial and onwards (lifetime timeframe) | 1 972 | 0.70 | 2 817 (1 179–9 799) |
| Device longevity 5 years (lifetime timeframe) | 9 450 | 1.41 | 6 702 (4 820–10 642) |
| Device longevity 7 years (lifetime timeframe) | 7 536 | 1.41 | 5 345 (3 795–8 378) |
| Hellenic NHS perspective | 8 275 | 1.41 | 5 869 (4 193–9 162) |
| Private health-care perspective | 9 186 | 1.41 | 6 515 (4 725–10 202) |
| CRT with defibrillation back-up (CRT-D) | 24 949 | 2.10 | 11 880 (9 479–16 076) |
Mean incremental cost-effectiveness ratio (95% confidence interval). Costs in €.
QALY, quality-adjusted life year; ICER, incremental cost-effectiveness ratio; CRT, cardiac resynchronization therapy; NHS, National Health Service.
Discussion
The cost-effectiveness ratio per QALY gained was €6 045 in the base case analysis. The 95% CIs for the cost per QALY gained varied between a lower limit of €4 292 to an upper limit of €9 411 in Greece. In the extended analysis the complete cost for device, implantation, and hospitalization were included, but not in the within-trial analysis. With a mean follow-up of 29.4 months, and a battery lifetime of 6 years, less than half of the total cost for device and implantation is included in the within-trial analysis. This also gave a higher variability in the analyses of uncertainty, and wider CIs (€10 399–31 602). However, the benefits are also lower in the within-trial analysis, which means that the point estimate of the cost effectiveness is also higher (€16 780).
Comparison with previous studies
The first cost-effectiveness analysis of CRT using within-trial analysis on the basis of data from a large, prospective, randomized, controlled trial (CARE-HF) was performed from a UK health-care perspective by Calvert et al.11 The within-trial analysis in this study was performed according to the same methodology as in the UK study,11 but with the difference that the complete cost for device, implantation, and hospitalization were transformed to a 6-year annuity rather than the device cost alone. For a within-trial analysis with only the device costs distributed as an annuity, the incremental cost-effectiveness ratio would have been €16 780 per QALY gained in this study, which is slightly lower than the incremental cost-effectiveness ratio in the UK study, which was €19 319 per QALY gained (95% CI: €5 482–45 402). Using a lifetime perspective, Yao et al.12 estimated the incremental cost effectiveness of CRT compared with medical therapy alone to be €7 538 (95% CI: €5 325–11 784) per QALY gained in a 65-year-old patient in a UK setting. In the Nordic analysis based on CARE-HF, the cost-effectiveness ratio per QALY gained was €4 800 in Denmark, €3 600 in Finland, and €6 500 in Sweden,29 The 95% CIs for the cost per QALY gained varied between a lower limit of €1 169 in Finland to an upper limit of €17 482 in Sweden. The cost-effectiveness results in Greece were thus comparable to those observed in the United Kingdom and in the Nordic countries.
Threshold value of the cost-effectiveness ratio
Even if there seems to be no formal threshold for the cost-effectiveness ratio in Greece, the cost per QALY gained that was found in this analysis can be considered as favourable based generally accepted threshold values.10,30,31 The World Health Organization (WHO) has argued for international threshold values of three times the gross domestic product per capita, which would correspond to a threshold value of €62 640 per QALY gained based on the GDP per capita in Greece in 2009.32,33 In the USA, threshold values of $50 000–100 000 per year of life gained have been recommended in some studies.34,35 In a survey among health economists about what threshold value to use in a cost-effectiveness analysis, Newhouse reported a mean value of $60 000 per year of life gained.31
Limitations
The survival beyond the trial was estimated based on data from the trial, but it is difficult to know whether this accurately reflects the uncertainty that would be observed with long-term follow-up in a real-life setting. Another limitation is that a last-observation-carried-forward approach was used for the estimation of QoL after the end of the clinical trial. However, the improvements in QoL observed in the CRT group during the CARE-HF trial appeared to be sustained in the long term.36
Conclusion
The results show that CRT in addition to standard pharmacological therapy is a cost-effective treatment in Greece compared with pharmacological therapy alone and can therefore be recommended for routine use in heart failure patients with markers of dyssynchrony.
Conflict of interest: M.K. is an employee of Medtronic the sponsor of the study. M.J.C. received funding to attend meetings and undertake research related to CARE-HF trial and authored the cost-effectiveness analysis. N.F. received funding for research, travel and consulting from Medtronic and from other organizations which manufacture treatments for heart failure. The remaining authors declare no conflicts of interest in relation to this work.
Funding
The study was supported by an unrestricted grant from Medtronic International, Tolochenaz, Switzerland.
Acknowledgements
We would like to thank Mr Ben Brown, Director of Reimbursement and Health Economics, Europe, Medtronic Switzerland for his review and comments.
