


Abstract
The mechanism responsible for premature ventricular complex (PVC)-mediated left ventricular (LV) dysfunction remains unclear. We sought to determine the electrocardiographic and electrophysiological characteristics of PVC-mediated LV dysfunction.
One hundred and twenty-seven patients who underwent radiofrequency catheter ablation (RFCA) for frequent PVCs (PVCs burden ≥10%/24 h) and had no significant structural heart disease were investigated. Left ventricular dysfunction (ejection fraction < 50%) was present in 28 of 127 patients (22.0%). The mean PVC burden (31 ± 11 vs. 22 ± 10%, P < 0.001), the presence of non-sustained ventricular tachycardia (53.6 vs. 33.3%, P = 0.05), and the presence of a retrograde P-wave following a PVC (64.3 vs. 30.3%, P = 0.001) were significantly greater in those with LV dysfunction than in those with normal LV function. The cut-off PVC burden related to LV dysfunction was 26%/day, with a sensitivity of 70% and a specificity of 78%. The PVC morphology, QRS axis, QRS width, coupling interval, the presence of interpolation, and PVC emergence pattern during exercise electrocardiogram were not significantly different between the two groups. The origin sites of PVCs, the acute success rate, and the recurrence rate during follow-up after RFCA were similar. In a multivariate analysis, the PVC burden (odds ratio 2.94, 95% confidence interval 0.90–3.19, P = 0.006) and the presence of retrograde P-waves (odds ratio 2.79, 95% confidence interval 1.08–7.19, P = 0.034) were independently associated with PVC-mediated LV dysfunction.
A higher PVC burden (>26%/day) and the presence of retrograde P-waves were independently associated with PVC-mediated LV dysfunction.
• A higher PVC burden is independently associated with PVC-mediated LV dysfunction. The cut-off PVC burden related to LV dysfunction was 26%/day, with a sensitivity of 70% and specificity of 78%.
• The presence of retrograde P waves is independently associated with PVC-mediated LV dysfunction. A retrograde contraction of the atrium following a PVC, which may cause an abnormal ventriculo-atrial contraction, has the potential to include transient hemodynamic compromise and LV dysfunction.
Introduction
Premature ventricular complexes (PVCs) are the most common arrhythmias observed in patients without structural heart disease.1 It has been reported that frequent PVCs can cause progressive left ventricular (LV) dysfunction2–4 and dilation,5,6 which may be restored to normal after successful catheter ablation of the PVCs.5–9 Mechanisms proposed for PVC-mediated LV dysfunction include alterations in calcium homeostasis,10,11 increased oxygen consumption,12,13 and ventricular dyssynchrony.14–16 Premature ventricular complex-mediated LV dysfunction may occur in patients with scar-related PVCs, further impairing LV function.17,18 The individual risk and time course of developing PVC-mediated LV dysfunction are both poorly understood. The purpose of this study was to determine the electrocardiographic (ECG) and electrophysiological characteristics of frequent PVC-mediated LV dysfunction.
Methods
Study population
We evaluated 127 consecutive patients [50 men and 77 women, mean age: 44 ± 13 years, mean left ventricular ejection fraction (LVEF): 54 ± 6%] who underwent radiofrequency catheter ablation (RFCA) because of frequent PVCs (PVC burden ≥10%/day) refractory to medical therapy. In seven patients (5.5%), PVC-related symptoms were not reported, while they received a beta-blocker or a calcium channel blocker. We obtained a complete medical history and performed a 12-lead surface ECG, 24 or 48 h Holter monitoring, an exercise ECG, and two-dimensional echocardiography on each patient. One hundred and twenty patients experienced symptoms of PVCs over a mean duration of 40 ± 47 months. Forty-eight of the 127 patients (37.8%) also had non-sustained ventricular tachycardia (VT) (defined as ≥3 consecutive PVCs with a duration <30 s and a frequency <1% of all PVC burdens on 24 h Holter monitoring). To evaluate the ECG and electrophysiological characteristics of PVCs, the patients were divided into the following two groups: the LV dysfunction group (EF < 50%, n = 28) and the normal group (EF ≥ 50%, n = 99). We excluded patients with significant structural heart disease, including coronary artery disease, valvular heart disease, and congenital heart disease. Patients with spontaneous or inducible sustained VT were also excluded from the study.
Baseline non-invasive evaluation
Two-dimensional echocardiography was performed at baseline using a commercially available system (Vivid-Seven, General Electric Vingmed, Horten, Norway). Left ventricular ejection fraction was assessed using the Simpson method during two consecutive sinus beats. Both systolic and diastolic LV dimensions were measured based on M-mode echocardiography in the parasternal long-axis view. In patients who underwent catheter ablation, baseline echocardiography was performed 3 months prior to the procedure. Baseline mean LVEF, LV end-systolic dimension (LVESd), and LV end-diastolic dimension (LVEDd) were measured.
We evaluated QRS width, axis, morphology, PVC coupling interval, interpolation, and the presence of retrograde P-waves based on 12-lead ECG recordings from all patients.
To assess the PVC prevalence in each patient, 24 or 48 h Holter monitoring was performed at baseline. The mean PVC burden and the presence of non-sustained VT were evaluated. The PVC burden was defined as the percentage of PVCs relative to the total number of QRS complexes. Patients with a PVC burden ≥10% were included in this study.
Of the 127 patients, exercise treadmill ECG (Bruce protocol) was performed in 91 patients. To evaluate the relationships between exercise and PVC characteristics, patients were divided into the following two subgroups according to their PVC emergence pattern during exercise and recovery: group I, PVCs emergence during exercise or recovery; group II, no PVCs during exercise and recovery.
Electrophysiological study and ablation
After informed consent was obtained, multipolar electrode catheters were positioned in the right ventricular apex, the His bundle region, and the high right atrium. Patients were studied in a fasting state without sedation. Antiarrhythmic drugs were discontinued for at least five half-lives before the procedure. Under local anaesthesia, programmed atrial and ventricular stimulation were performed with up to triple extrastimuli to assess the inducibility of sustained VT. If no spontaneous ectopy was present at baseline, isoproterenol (3–5 μg/min) was intravenously administered. In the presence of frequent spontaneous ectopies, activation mapping was performed using a 7 F deflectable ablation catheter. Pace mapping was performed at a similar pacing cycle length to the coupling interval of the spontaneous PVCs.
If the PVCs had a left bundle-branch block (LBBB) morphology with late transition on precordial leads and an inferior axis, activation mapping was first performed in the outflow tract of the right ventricle. If the PVCs had a right bundle-branch block (RBBB) morphology, activation mapping of the aortic cusps and the LV endocardium was first performed using a retrograde aortic approach. In 9 of the 127 patients, a 3D electroanatomic mapping system (EnSite Array, St Jude Medical, St Paul, MN, USA) was used to guide mapping. The endpoint of the procedure was the complete elimination and non-inducibility of clinical PVCs or non-sustained VT, with or without isoproterenol infusion.
Follow-up
Patients were evaluated every 3–6 months in an outpatient clinic to assess the recurrence of PVCs or non-sustained VT without any antiarrhythmic drugs. Follow-up monitoring using 24 or 48 h Holter recordings was performed at least once when patients were free of PVC-related symptoms, and was repeated to assure correlation of the symptoms with PVC recurrence during follow-up. In patients with LV dysfunction, follow-up echocardiography was performed after ablation.
Statistical analysis
Continuous variables are expressed as the means ± standard deviations, and comparisons were performed using Student's t-test. Discrete variables were compared using the χ2 test or Fisher's exact test, where appropriate. A P value of < 0.05 was considered statistically significant. Multivariate analysis was performed to detect the independent variables associated with LV dysfunction using all parameters with a P value of <0.05 on univariate analysis. We determined the cut-off value for the PVC burden associated with LV dysfunction based on the receiver–operator characteristic curve.
Results
Patient characteristics
Baseline clinical characteristics of each group according to LV function are shown in Table 1.
Baseline characteristics
| LV dysfunction (n = 28) | Normal LV (n = 99) | P value | |
|---|---|---|---|
| Age, years | 48 ± 14 | 43 ± 13 | 0.07 |
| Male gender, n (%) | 17 (60.7) | 33 (33.3) | 0.008 |
| Symptom duration, months | 46 ± 49 | 39 ± 46 | 0.49 |
| LVEF, % | 44 ± 5 | 57 ± 3 | <0.001 |
| LVEDd, mm | 56 ± 5 | 50 ± 4 | <0.001 |
| LVESd, mm | 39 ± 6 | 31 ± 4 | <0.001 |
| Hypertension, n (%) | 9 (32.1) | 18 (18.2) | 0.09 |
| Diabetes mellitus, n (%) | 3 (10.7) | 3 (3.0) | 0.09 |
| Medical therapy, n (%) | |||
| Class I antiarrhythmic drugs | 4 (13.3) | 38 (39.6) | 0.008 |
| Beta-blockers | 15 (50.0) | 45 (46.9) | 0.76 |
| Calcium channel blockers | 4 (13.3) | 3 (3.1) | 0.06 |
| Sotalol | 1 (3.3) | 3 (3.1) | 0.38 |
| Amiodarone | 6 (20.0) | 7 (7.3) | 0.04 |
| Number of AADs used, n (%) | 1.1 ± 0.6 | ±0.6 | 0.44 |
| Follow-up duration, months | 19 ± 17 | 13 ± 13 | 0.08 |
AADs, antiarrhythmic drugs; LVEF, left ventricular ejection fraction; LVEDd, left ventricular end-diastolic dimension; LVESd, left ventricular end-systolic dimension.
Twenty-eight patients (22.0%) with a mean LVEF of 44 ± 5% were included in the LV dysfunction group. The mean age of these patients was 48 ± 14 years, and 61% were men. The mean duration of symptoms before the first evaluation was 46 ± 49 months. Seven patients were asymptomatic. The mean PVC burden of these patients was 26 ± 10%, while they received beta-blocker or calcium channel blocker. Among them, two patients demonstrated LV dysfunction, and the remaining five patients demonstrated normal LV function on echocardiography. Male gender was more prevalent in the LV dysfunction group. There were no significant differences in age, symptom duration, or follow-up duration between the two groups.
Patients in the LV dysfunction group had significantly increased LVEDd and LVESd compared with those in the normal LV function group (56 ± 5 vs. 50 ± 4 mm, 39 ± 6 vs. 31 ± 4 mm, respectively, P < 0.001). There was no significant difference between the two groups with regard to the prevalence of hypertension or diabetes. Class I antiarrhythmic drugs were more commonly used in patients with normal LV function (P = 0.008). Medical therapy with beta-blockers, calcium channel blockers, or sotalol did not differ between those with and without LV dysfunction, except for the use of amiodarone, which was more commonly used in patients with LV dysfunction (P = 0.04).
Left ventricular function and electrocardiographic and electrophysiological characteristics of premature ventricular complexes
A comparison of the data for the two groups is presented in Table 2. In all patients, the mean PVC burden was 24 ± 11%/day, and one dominant PVC morphology was observed. Forty-eight (37.8%) of 127 patients had non-sustained VT. The mean number beats/day was 97 ± 128, the mean rate of 172 ± 31 b.p.m. and total duration was 4.0 ± 4.1 min/24 h. The PVCs had LBBB morphology in 105 patients (82.7%) and RBBB morphology in 22 patients (17.3%). The QRS axis was found to be inferior in 116 patients (91.3%) and superior in 11 patients (8.7%). The mean QRS duration of the PVCs was 145 ± 16 ms, and the average coupling interval was 440 ± 71 ms. No evidence of ischaemia was observed on exercise ECG testing in any of the patients.
Comparison of premature ventricular complex patients with and without left ventricular dysfunction
| LV dysfunction (n = 28) | Normal LV (n = 99) | P value | |
|---|---|---|---|
| PVC burden, % | 31 ± 11 | 22 ± 10 | <0.001 |
| Non-sustained VT, n (%) | 15 (53.6) | 33 (33.3) | 0.05 |
| Bigeminy/total PVC, % | 44.5 ± 31.5 | 37.6 ± 32.5 | 0.32 |
| Response to exercise, n | 19 | 72 | |
| PVC during exercise or recovery, n (%) | 15 (78.9) | 55 (76.4) | 0.81 |
| PVC during exercise only | 5 | 16 | 0.71 |
| PVC during recovery only | 3 | 20 | 0.28 |
| EP study and ablation | |||
| QRS width, ms | 148 ± 15 | 145 ± 17 | 0.37 |
| LBBB morphology, n (%) | 23 (82.1) | 82 (82.8) | 0.93 |
| QRS axis, inferior/superior | 25/3 | 91/8 | 0.66 |
| Coupling interval, ms | 457 ± 68 | 439 ± 60 | 0.22 |
| Retrograde P-wave, n (%) | 18 (64.3) | 30 (30.3) | 0.001 |
| Interpolation, n (%) | 2 (7.1%) | 6 (6.1%) | 0.84 |
| Site of origin | |||
| RVOT/non-RVOT | 18/10 | 66/33 | 0.81 |
| V-QRS, ms | 26 ± 6 | 31 ± 6 | 0.33 |
| Pace mapping (12/12), n (%) | 18 (64.3) | 72 (72.7) | 0.39 |
| Success rate, n (%) | 26 (92.9) | 91 (91.9) | 0.87 |
LBBB, left bundle branch block; LV, left ventricle; PVC, premature ventricular complex; RVOT, right ventricular outflow tract; V-QRS, the local ventricular activation time relative to the QRS onset; VT ,ventricular tachycardia.
There were significant differences in the mean PVC burden (31 ± 11 vs. 22 ± 10%, P < 0.001), the presence of non-sustained VT (53.6 vs. 33.3%, P = 0.05), and the presence of retrograde P-waves (64.3 vs. 30.3%, P = 0.001) (Figure 1) between the LV dysfunction group and the normal LV function group, respectively. There were, however, no significant differences in the incidence of bigeminy per total PVC beats, PVC morphology, QRS width, QRS axis, coupling interval, the presence of interpolation, earliest ventricular activation time, rate of full-matched pace mapping (12/12), or PVC emergence pattern during exercise ECG between the two groups.
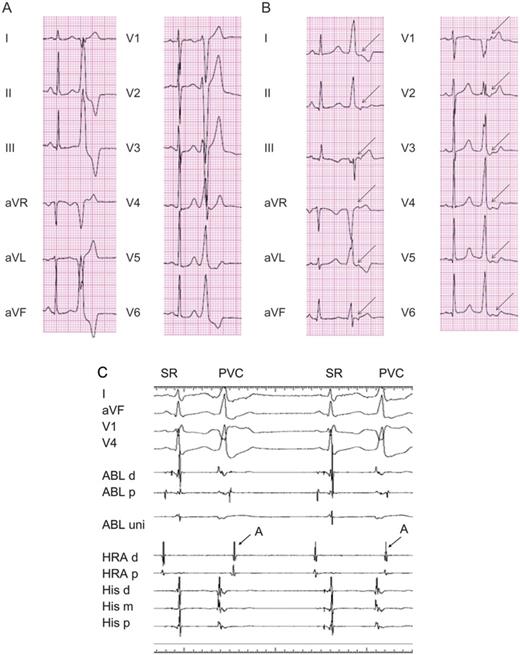
A representative 12-lead electrocardiogram showing a premature ventricular complex in the absence (A) and presence (B) of the retrograde P-wave. (A) Premature ventricular complexes with a left bundle branch block pattern and inferior-axis morphology were recorded. (B) The arrow denotes a retrograde P-wave following a premature ventricular complex. (C) An intracardiac electrogram during premature ventricular complexes showing retrograde atrial conduction. The distal electrode of the ablation catheter was positioned at the para-Hisian area. The arrows indicate retrograde atrial conduction.
On multivariate analysis, only a greater PVC burden (odds ratio 2.94, 95% confidence interval 0.90–3.19, P = 0.006) and the presence of a retrograde P-wave (odds ratio 2.79, 95% confidence interval 1.08–7.19, P = 0.034) were independent predictors of the development of LV dysfunction (Table 3).
Multivariate analysis of comparison of patients with and without left ventricular dysfunction
| Odds ratio | 95% CI | P value | |
|---|---|---|---|
| PVCs burden | 2.94 | 0.90–3.19 | 0.006 |
| Non-sustained VT | 1.45 | 0.57–3.69 | 0.438 |
| Retrograde P-wave | 2.79 | 1.08–7.19 | 0.034 |
| Odds ratio | 95% CI | P value | |
|---|---|---|---|
| PVCs burden | 2.94 | 0.90–3.19 | 0.006 |
| Non-sustained VT | 1.45 | 0.57–3.69 | 0.438 |
| Retrograde P-wave | 2.79 | 1.08–7.19 | 0.034 |
PVCs, premature ventricular complexes; VT, ventricular tachycardia; CI, confidence interval.
The cut-off value of PVC burden distinguishing patients with LV dysfunction from patients with normal LV function was 26%, with a sensitivity of 70% and a specificity of 78% (Figure 2).
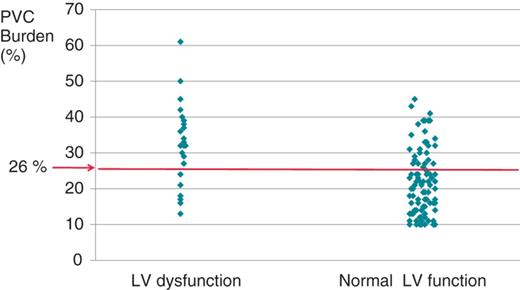
The correlation between the premature ventricular complex burden and left ventricular function. The cut-off value of premature ventricular complex burden in patients with left ventricular dysfunction was 26%, with a sensitivity of 70% and specificity of 78%.
Catheter ablation outcomes
Premature ventricular complexes originated from the right ventricular outflow tract (RVOT) in 84 (66.1%) of 127 patients and from other sites in 43 (33.9%) of 127 patients (i.e. an aortic cusp in 13 patients, the LV endocardium in 9 patients, the right ventricular inflow site in 6 patients, the mitral annulus in 5 patients, the pulmonary artery in 2 patients, the tricuspid annulus in 2 patients, the para-Hisian area in 2 patients, the aortomitral continuity in 1 patient, and the epicardial area near the anterior interventricular vein in 3 patients).
Successful RFCA was achieved in 117 (92.1%) of 127 patients. In nine of 127 patients, catheter ablation was performed using a non-contact mapping system (EnSite Array). After ablation, PVCs recurred in 22 (17.3%) of 127 patients during the mean follow-up period of 15 ± 14 months.
There were no significant differences in the sites of origin of PVCs between the two groups. The acute success rate of catheter ablation (92.9 vs. 91.9%, NS) and the recurrence rate (21.4 vs. 16.2%, NS) were not different between the two groups.
In 28 patients with LV dysfunction, follow-up echocardiography was performed at a mean of 4.1 ± 2.7 months after catheter ablation. Echocardiography demonstrated decreased LVESd in all but one patient (96.4%, mean 32 ± 3 mm) and decreased LVEDd in 24 patients (85.7%, mean 49 ± 4 mm). Twenty-one patients (75%) had normal LV systolic function. In the remaining seven patients, LVEF showed a nearly normal value (mean LVEF 47.5%). The mean change in LVEF improvement was 10 ± 6% (range 2–27%). During the mean follow-up of 19 ± 17 months, the change of LVEF was not significantly different between the recurrence and no-recurrence groups (7 ± 7 vs. 12 ± 6%, P = 0.19). In the patients with recurrence group, the PVC burden was also significantly decreased after ablation (32.4 ± 18.9 to 2.5 ± 1.3%, P = 0.02).
Discussion
The main finding of our study is that a greater PVC burden (cut-off value > 26%/day) and the presence of retrograde P-waves are independently associated with PVC-mediated LV dysfunction.
Prediction of the development of left ventricular dysfunction
Differentiation of PVC-mediated LV dysfunction vs. a primary cardiomyopathic process is often difficult, but both cardiac magnetic resonance imaging19 and the reversibility of LV dysfunction with suppression of PVCs2–9 can help to distinguish these conditions.
Although the mechanism of LV dysfunction in patients with frequent PVCs has not been clearly defined, several mechanisms have been proposed. Some investigators have suggested tachycardia-mediated cardiomyopathy as one mechanism responsible for LV dysfunction.7,9,20–22 Frequent PVCs are known to be associated with complex transient alterations in intracellular calcium and membrane ionic currents, as well as myocardial and peripheral autonomic stimulation and inhibition.10,11 Bradycardia has also been suggested as a mechanism of LV dysfunction,12,23,24 especially in patients who have a pause following each PVC. Another suggested mechanism is ventricular dyssynchrony, possibly due to interventricular or intraventricular discoordinated contractions.14–16
In the present study, PVC burden was identified as an independent parameter associated with LV dysfunction on multivariate analysis. Previously published studies have demonstrated that PVC burden is significantly associated with LV dysfunction.5,8,25,26 In these studies, a mean PVC burden >20% was related to LV dilatation with decreased LVEF and resulted in PVC-induced cardiomyopathy. The lowest PVC burden resulting in reversible cardiomyopathy was 10%.26 In the present study, we also found that a cut-off PVC burden greater than 26% per day was significantly associated with LV dysfunction. Therefore, physicians should consider aggressively suppressing PVCs to prevent further development of LV dysfunction, even in asymptomatic patients. In a previous study, improvements in LV dimension and function following RFCA were observed in a patient who only had 4% PVCs on 24 h Holter monitoring;20 this finding suggests that even a low PVC burden may cause deterioration of LV function. Therefore, PVC burden alone may not be sufficient to predict which patients are at high risk of developing LV dysfunction.
A retrograde P-wave after PVC indicates retrograde contraction of the atrium following PVC, which may cause an abnormal ventriculo-atrial contraction and has the potential to induce transient haemodynamic compromise. A characteristic of a failing heart is a diminished capacity to restore calcium levels during diastole.10,11 This characteristic suggests that in hearts with abnormal ventriculo-atrial contractions, abnormal intracellular calcium handling may be related to both systolic and diastolic dysfunction. We found that significantly more patients in the LV dysfunction group had retrograde P-waves following PVCs than were observed in the normal LV function group (P = 0.001), and this parameter was an independent predictor of LV dysfunction. In addition, in patients without LV dysfunction, retrograde P-waves were also observed in ∼30% of cases; therefore, frequent PVCs in hearts with normal LV function might evolve into LV dysfunction if the retrograde P-waves lasted a prolonged period of time. We speculate that long-term ventriculo-atrial discordant conduction may lead to LV dysfunction and dilatation. Further haemodynamic studies are required to confirm the role of retrograde atrial contraction following PVCs in LV dysfunction.
Patients with LV dysfunction presented more often with non-sustained VT in the present study. Frequent or incessant non-sustained VT may cause tachycardia-induced cardiomyopathy. As described previously, ≥3 consecutive PVCs with a duration <30 s and frequency <1% of all PVC burdens was defined as non-sustained VT, representing no frequent nor incessant episodes. However, this factor was not related to the significant difference in the multivariate analysis.
In our study, male patients more frequently presented with LV dysfunction. Although age, hypertension, and diabetes did not demonstrate significant but borderline relationships between the two groups, these factors could be considered clinical factors affecting progression of LV dysfunction.
A previous study reported that RVOT-PVC may be a possible cause of LV dysfunction and heart failure.5 In contrast to this report, another study demonstrated that reversible LV dysfunction was equally prevalent among patients who had PVCs with RBBB or LBBB configurations, although the number of cases evaluated in that study was too low to determine the true prevalence of PVC-induced cardiomyopathy.9 In our study, which was based on a larger sample size, PVCs with RBBB or LBBB morphology were equally prevalent among patients with or without LV dysfunction. It remains to be determined whether the degree of induced LV dysfunction or the time course of its development is different between patients with RBBB or LBBB PVC morphologies. Recently, the presence of interpolated PVCs was reported as a predictor of PVC cardiomyopathy.27 Another study demonstrated that symptom duration and absence of symptoms were associated with PVC-mediated cardiomyopathy.28 However, interpolated PVCs were relatively uncommon in the present study, and there was no significant difference between the two groups. In addition, symptom duration was also not significantly different in the present study. Asymptomatic patients may have a factor suspected to favour the occurrence of slowly evolving, silent cardiomyopathy. Only 7 asymptomatic patients were included in the present study. Among them, 2 patients demonstrated LV dysfunction, but the other asymptomatic patients did not develop LV dysfunction. Unfortunately, we do not have follow-up echocardiography of this subset of the patients for sufficient time period.
Clinical implications of premature ventricular complexes for left ventricular function
Frequent PVCs are considered benign and have no prognostic significance.29,30 However, our study showed that retrograde P-waves as well as high PVC burden were strongly associated with LV dysfunction. This result may imply that retrograde P-waves following PVCs could be a clue in the occurrence of LV dysfunction, especially in asymptomatic patients with PVCs. It is needless to say that reproducible, documented PVCs identified by 24 or 48 h Holter monitoring, or even longer event recorders at different times, and the total presentation duration of a high PVC burden are important to detection of PVC-mediated cardiomyopathy. Moreover, it is necessary to aware of the determining factors associated with the development of LV dysfunction.
Radiofrequency catheter ablation has proven to be safe and successful for curing various forms of PVCs or VT.3,4,5–9 In this study, RFCA was similarly effective in patients with LV dysfunction as well as patients with normal LV function. In addition, patients with VA recurrence, as well as patients with a successful outcome in the LV dysfunction group, demonstrated a decreased PVC burden after RFCA. Therefore, RFCA should be considered as a first-line therapy for patients with frequent PVCs who also have additional risk factors, such the presence of a retrograde P-wave following a PVC, as well as poor LV function.
Study limitations
To determine the PVC burden, we performed 24 or 48 h Holter monitoring. However, a single Holter recording may not reflect the true PVC burden. We found that the PVC burdens in 28 of 33 patients who underwent 24 h Holter monitoring more than twice at different time periods were very similar, suggesting that our results are consistent. Although retrograde P-waves were significantly associated with LV dysfunction, they were also observed in 30% of patients without LV dysfunction. This finding suggested that persistent retrograde P-waves with frequent PVCs in hearts with normal LV function may lead to LV dysfunction. Unfortunately, we have not examined the role of persistent retrograde VA conduction, as opposed to no VA conduction, in patients with frequent PVCs without LV dysfunction for a sufficient time period. This is the one of major limitations of this study. And patients with potential PVC-related cardiomyopathy but with a lower (<10%) PVC burden may also be missed. This was a retrospective study, and we evaluated a relatively small number of patients; further prospective studies including larger numbers of patients followed over longer periods of time are warranted to confirm our results.
Conclusion
A PVC burden >26%/day and the presence of retrograde P-waves following PVCs were associated with PVC-mediated LV dysfunction, for which RFCA was found to be an equally effective treatment as it was in patients with normal LV function.
Conflict of interest: none declared.
