


Abstract
High premature ventricular contractions (PVCs) burden does not always predict the development of PVC-cardiomyopathy (CM). We sought to evaluate post-extrasystolic potentiation (PESP) of left ventricular ejection fraction (LVEF) to predict the severity of PVC-CM in an animal model.
Right ventricular apical bigeminal PVCs were introduced for 12 weeks in 11 canines to induce PVC-CM. Echocardiograms were performed to obtain LVEF without ectopy (Echo-1) and during PVCs (200 and 350 ms coupling intervals, Echo-2, and Echo-3, respectively), and premature atrial contractions (PACs) (Echo-4) at baseline and after 12 weeks of bigeminal PVCs. PESP was calculated as delta-LVEF between the sinus beat post-ectopy LVEF (Echo-2, -3, and -4, respectively) and LVEF without PVC (Echo-1) at baseline and 12 weeks of high PVC burden. A hyperdynamic LV function (LVEF > 70%) was noted in all animals only with early-coupled PVCs (LVEF at 200 ms: 74.4 ± 6%) at baseline. While PVC PESP at 200 ms had a strong significant correlation with the final 12-week LVEF (R = 0.8, P = 0.003), PVC PESP at 350 ms and PAC PESP had a positive but non-significant correlation (R = 0.53, P = 0.09, and R = 0.29, P = 0.34, respectively). Premature ventricular contraction PESP at 350 ms was significantly higher after PVC-CM had developed (delta-LVEF baseline 2.7 ± 2.9% vs. 12 weeks 18.6 ± 12.3% P < 0.001).
Bigeminal early-coupled PVCs cause hyperdynamic left ventricular function in the structurally normal canine heart due to PESP. The degree of PESP at baseline is inversely proportional to the PVC-CM severity at 12 weeks and maybe a predictor of PVC-CM as it may assess the myocardial adaptation reserve to PVCs.
Bigeminal early-coupled premature ventricular contractions (PVCs) cause hyperdynamic left ventricular function in the structurally normal canine heart due to post-extrasystolic potentiation (PESP).
Post-extrasystolic potentiation at baseline may be a predictor of PVC-cardiomyopathy (CM) as it may assess the myocardial adaptation reserve to PVCs.
This data advocate for echocardiographic analysis of post-PVC/premature atrial contraction sinus beat and PESP in the clinical setting as it could assist us in identifying patients at risk and with diagnosis of PVC-CM.
Introduction
Premature ventricular contractions (PVCs) are the most common ventricular arrhythmia and are known to trigger ventricular fibrillation even in structurally normal hearts.1,2 Studies have shown that PVC burden has a direct correlation to the severity of left ventricular (LV) dysfunction and mortality.3–5 The cause-effect relationship between PVC and cardiomyopathy (CM) is not well understood as only 5% of patients with frequent PVCs (>10 000 per day) have associated PVC-CM.6 Different features have been suggested to predict the development of PVC-CM such as the symptom duration, PVC burden, epicardial origin, coupling interval dispersion, LV dyssynchrony, atrioventricular dissociation, and post-extrasystolic potentiation (PESP).2,4,7,8
Post-extrasystolic potentiation is a phenomenon characterized by a transient increase in contractility following either atrial or ventricular premature beat.9 PESP can be assessed at a cellular (myocyte shortening) or an organ level (stroke volume, dP/dt, fractional shortening, or ejection fraction).10 Recently, PESP measured by invasive blood pressure (BP) monitoring has been described as a predictor of LV function recovery after radiofrequency catheter ablation of PVCs.11,12
Our study aimed to assess the acute and chronic impact of PESP in LV function and sought to clarify if PESP can predict the development of PVC-CM using our previously published high PVC burden in canine model.13 Identifying additional non-invasive stronger predictors could assist in identifying patients with frequent PVCs at risk to develop PVC-CM.
Methods
A pacemaker with a previously validated premature pacing algorithm was implanted via left thoracotomy in 11 mongrel female canines to reproduce ventricular bigeminy. Premature pacing algorithm was developed solely to trigger PVCs on command as originally published.13 Through a left thoracotomy, a bipolar steroid-coated lead (lead Medtronic model 4968) was introduced through the right atrial (RA) appendage positioned in the endocardial high RA, while a sutureless bipolar Myopore™ (Greatbatch Medical, Alden, NY, USA) epicardial bipolar lead was screwed in the right ventricular (RV) apex for each animal. After complete surgical recovery, baseline ambulatory echocardiogram without PVCs (Echo-1), with bigeminal PVCs delivered at coupling intervals of 200 ms (Echo-2), and 350 ms (Echo-3), bigeminal premature atrial contractions (PACs) at a coupling interval of 200 ms with subsequent mean RR interval of 267.1 ± 26.1 ms (Echo-4), and a 24-h Holter monitor were performed. Once this initial evaluation was completed, canines started a persistent 12-week 50% burden of RV apical PVCs with coupling intervals of 200 ms. Ambulatory echocardiograms without ectopy (Echo-1) were repeated at 4, 8, and 12 weeks. The protocol was completed after 12 weeks when a final 24-h Holter and echocardiograms during bigeminal PVCs at both coupling intervals and bigeminal PACs were repeated (Echo-2, Echo-3, and Echo-4) (Figure 1). The protocol was approved by the Institutional Animal Care and Use Committee following the Guide for the Care and Use of Laboratory Animals.
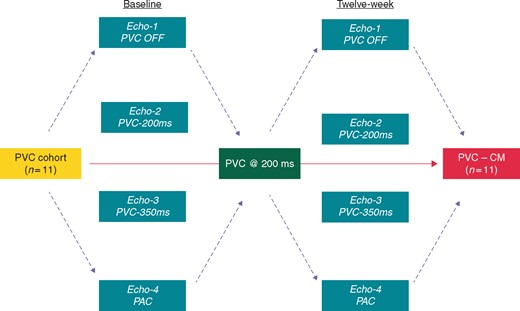
Flowchart to describe 12-week study protocol. Echo-1 without PVCs; Echo-2: bigeminal PVCs at 200 ms; Echo-3: bigeminal PVCs at 350 ms; and Echo-4: bigeminal PACs at variable cycle lengths (see Table 3). PAC, premature atrial contraction; PVC, premature ventricular contraction.
Holter and echocardiographic evaluation
All 24-h ambulatory Holter monitors (GE SEER, General Electric, USA) were quantified for mean heart rate and PVC burden (GE MARS, General Electric, USA). Echocardiography was performed with a 5 MHz probe using a commercial system (Vivid-7, Vingmed- General Electric, USA) with tissue Doppler imaging and Speckle-tracking strain analysis software (EchoPAC, GE, USA). All parameters were obtained following the American Society of Echocardiography guidelines. Baseline LV function was assessed by quantifying the left ventricular ejection fraction (LVEF; Simpson’s formula), fractional shortening, LV end-systolic and diastolic dimensions (LVESD and LVEDD), LV thickness, left atrial size, mitral valve function, and LV compliance (E/A ratio) during sinus rhythm, while PVCs were disabled (Echo-1). Left ventricular ejection fraction with and without ectopy was analysed from at least two different sinus beats in each animal.
With PVCs enabled at coupling intervals of 200 (Echo-2) and 350 ms (Echo-3), and PACs at 200 ms (Echo-4), LV end-diastolic volume, and end-systolic volume in apical four-chamber and apical two-chamber were obtained to calculate LVEF by Simpson’s method. Post-extrasystolic potentiation was calculated as the delta-LVEF between the post-ectopy sinus beat LVEF (Echo-2, 3, and 4) and sinus beat LVEF without PVC (Echo-1) at baseline and after 12 weeks of high PVC burden (ventricular bigeminy).
Statistical analysis
Continuous variables were expressed as mean ± standard deviation. Categorical variables were presented as proportions (%) and analysed using the χ2 test or Fisher’s exact test when appropriate. Normally distributed continuous variables were analysed using independent sample t-test. Correlation analysis was performed using the Pearson correlation coefficient. A P-value of ≤0.05 was considered as statistically significant. P-values for categorical variables with more than 2 × 2 tables were reported with a linear-by-linear association. All statistical analysis was performed using IBM SPSS Statistics, Version 25.0. (Armonk, NY: IBM Corp).
Results
Overall trends in echocardiographic and Holter parameters
Similar to previous publication of PVC-CM in this animal model,13,14 persistent 12-week ventricular bigeminy demonstrated a mean hazard ratio of 122.5 ± 14.5 b.p.m. and mean PVC burden of 49.8% (PVC count 86 499 ± 38 593). Echocardiographic changes are summarized in Table 1 and Figure 2. Left ventricular ejection fraction and peak circumferential strain (CS) declined significantly (delta-LVEF −20.5 ± 10.6%, P < 0.001; delta peak CS strain 6.3 ± 4%, P < 0.001), while LVEDD and LVESD significantly increased (delta 2 ± 3.1 and 7.7 ± 3.3 mm, respectively; P < 0.001) after 12-week exposure to bigeminal PVCs at 200 ms.
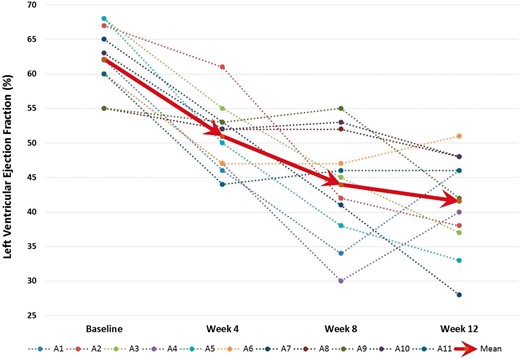
Trends in left ventricular ejection fraction in the 11 canines over 12 weeks with persistent bigeminal PVC at 200 ms. PVC, premature ventricular contraction.
Progression of mean echocardiographic data at baseline and after 12 weeks of persistent ventricular bigeminy (P-value, t-test, and data presented as mean ± SD)
| Parameter | Baseline | Week 12 | Delta | P-value |
|---|---|---|---|---|
| LVEF (%) | 62.1 ± 4.6 | 41.5 ± 7.1 | −20.5 ± 10.6 | <0.001 |
| Peak CS strain | −18.2 ± 3.3 | −11.8 ± 3 | 6.3 ± 4 | <0.001 |
| LVEDD (mm) | 35 ± 2.2 | 39 ± 7.1 | 2 ± 3.1 | <0.01 |
| LVESD (mm) | 24 ± 2.1 | 31 ± 3.4 | 7.7 ± 3.3 | <0.001 |
Images obtained during sinus beat without ectopy.
CS, circumferential strain; LVEF, left ventricular ejection fraction; LVEDD, left ventricular end-diastolic dimension; LVESD, left ventricular end-diastolic dimension; SD, standard deviation.
Post-extrasystolic potentiation after premature ventricular contraction-200 and premature ventricular contraction-350 ms
Table 2 summarizes LVEF during sinus beat without ectopy, sinus beat post-PVC, and PESP (delta-LVEF) at 200 and 350 ms coupling intervals before and after 12 weeks of bigeminal PVCs. At baseline (prior to chronic ventricular bigeminy), PESP was more prominent at early- (delta-LVEF at 200 ms: 12.3 ± 7.8%) rather than late-coupled PVCs (delta-LVEF at 350 ms: 2.7 ± 2.9%) in structurally normal hearts. Moreover, a clear hyperdynamic LV function (LVEF > 70%) was noted only in early-coupled (LVEF at 200 ms: 74.4 ± 6%) when compared with late-coupled PVCs (LVEF at 350 ms: 64.8 ± 3.8%, P = 0.003). Baseline PESP at 200 ms demonstrated a strong correlation with the degree of LV dysfunction (R = 0.8, P = 0.003, Figure 3), while PESP at 350 ms had a positive but non-significant correlation (R = 0.54, P = 0.09).
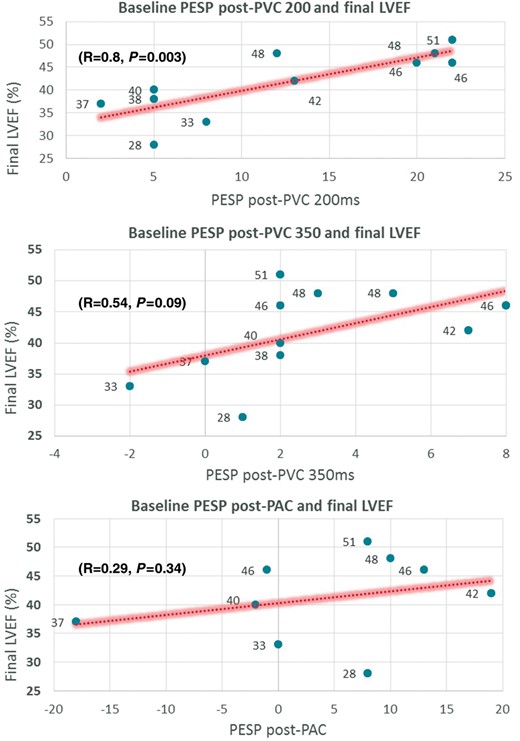
Correlation plots of baseline PESP (PVC200, PVC350, and PAC in a structurally normal heart before 12-week exposure to ventricular bigeminy) with final 12-week LVEF. LVEF, left ventricular ejection fraction; PAC, premature atrial contraction; PESP, post-extrasystolic potentiation; PVC, premature ventricular contraction.
LVEF during SB without ectopy and SB post-PVC at 200 and 350 ms coupling intervals before (baseline) and after the development of PVC-CM (Week 12 bigeminal PVCs)
| Baseline | Final (Week 12) | |||||||||
|---|---|---|---|---|---|---|---|---|---|---|
| No PVCs (Echo-1) | CI: 200 ms (Echo–2) | CI: 350 ms (Echo-3) | No PVCs (Echo-1) | CI: 200 ms (Echo-2) | CI: 350 ms (Echo-3) | |||||
| Animal | SB LVEF | SB post-PVC LVEF | PESP LVEF (delta) | SB post-PVC LVEF | PESP LVEF (delta) | SB LVEF | SB post-PVC LVEF | PESP LVEF (delta) | SB post-PVC LVEF | PESP LVEF (delta) |
| 1 | 62 | 84 | 22 | 70 | 8 | 46 | 66 | 20 | 57 | 11 |
| 2 | 67 | 72 | 5 | 69 | 2 | 38 | 70 | 32 | 72 | 34 |
| 3 | 68 | 70 | 2 | 68 | 0 | 37 | 66 | 29 | 64 | 27 |
| 4 | 60 | 65 | 5 | 62 | 2 | 40 | 60 | 20 | 50 | 10 |
| 5 | 68 | 76 | 8 | 66 | −2 | 33 | 68 | 35 | 66 | 33 |
| 6 | 60 | 82 | 22 | 62 | 2 | 51 | 58 | 7 | 49 | −2 |
| 7 | 65 | 70 | 5 | 66 | 1 | 28 | 72 | 44 | 63 | 35 |
| 8 | 55 | 76 | 21 | 58 | 3 | 48 | 61 | 13 | 62 | 14 |
| 9 | 55 | 68 | 13 | 62 | 7 | 42 | 76 | 34 | 62 | 20 |
| 10 | 63 | 75 | 12 | 68 | 5 | 48 | 54 | 6 | 55 | 7 |
| 11 | 60 | 80 | 20 | 62 | 2 | 46 | 52 | 6 | 62 | 16 |
| Mean | 62.1 ± 4.6 | 74.4 ± 6 | 12.3 ± 7.8* | 64.8 ± 3.8 | 2.7 ± 2.9 | 41.5 ± 7.1 | 63.9 ± 7.6 | 22.4 ± 13.3* | 60.2 ± 6.9 | 18.6 ± 12.3* |
| R = 0.8, P = 0.003 | R = 0.54 P = 0.09 | R = −0.9, P < 0.001 | R = −0.88, P < 0.001 | |||||||
PESP LVEF (%) = SB post-PVC LVEF (%) − SB LVEF without ectopy (%); correlation coefficient (Pearson, R) between PESP LVEF at 200 ms/350 ms and final LVEF.
CI, coupling interval; CM, cardiomyopathy; LVEF, left ventricular ejection fraction; PESP, post-extrasystolic potentiation; PVC, premature ventricular contraction; SB, sinus beat. *P value <0.05
After 12 weeks of bigeminal PVCs, a hyperdynamic LVEF is no longer evident during bigeminal short-coupled PVCs (LVEF 63.9 ± 7.6%, Table 2). However, PESP was prominent at early- (delta-LVEF at 200 ms: 22.4 ± 13.3%) and late-coupled PVCs (delta-LVEF at 350 ms: 18.6 ± 12.3%). Post-extrasystolic potentiation at 350 ms was significantly higher after PVC-CM had developed compared to baseline (delta-LVEF baseline 2.7 ± 2.9% vs. 12 weeks 18.6 ± 12.3% P < 0.001), especially in those with a more severe LV dysfunction. Moreover, PESP at early- and late-coupled PVCs had a significant negative correlation with the degree of CM at 12 weeks (early PVCs: R = −0.9, late PVCs: R = −0.88; P < 0.001, Figure 4).
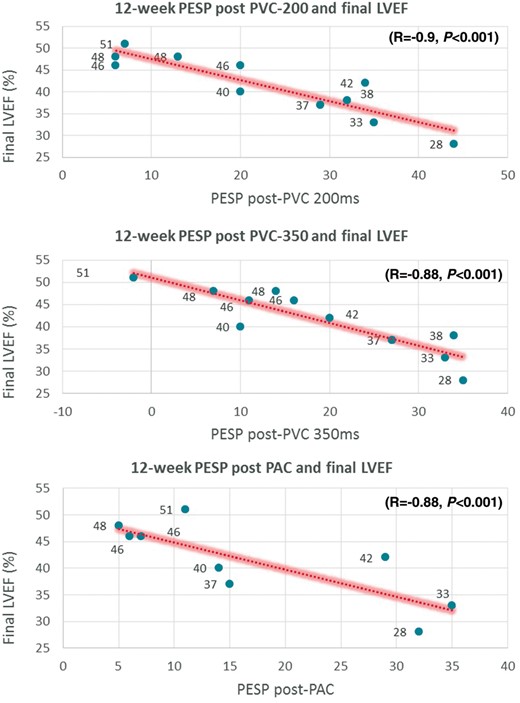
Correlation plots of 12-week PESP (PVC200, PVC350, and PAC after development of PVC-Cardiomyopathy) with final 12-week LVEF. LVEF, left ventricular ejection fraction; PAC, premature atrial contraction; PESP, post-extrasystolic potentiation; PVC, premature ventricular contraction.
Post-extrasystolic potentiation after premature atrial contractions
Table 3 summarizes LVEF during sinus beat without ectopy, sinus beat post-PAC and PESP (delta-LVEF) at variable coupling intervals before and after 12 weeks of bigeminal PVCs. At baseline, no significant potentiation was noted during sinus beat post-PAC as compared to sinus beat without ectopy (delta-LVEF was 4.1 ± 10.8% at a mean R-R interval of 267.1 ± 26.1 ms) in structurally normal hearts. In contrast to PVCs, PESP during PACs at baseline had a very weak non-significant correlation with the degree of CM after 12-week exposure of bigeminal PVCs.
LVEF during SB without ectopy and SB post-PAC before (baseline) and after the development of PVC-CM (Week 12 bigeminal PVCs)
| Baseline | Final (Week 12) | |||||||
|---|---|---|---|---|---|---|---|---|
| No PVCs (Echo-1) | Post-PAC (Echo-4) | No ectopy (Echo-1) | Post-PAC (Echo-4) | |||||
| Animal | SB LVEF | SB post-PAC LVEF | PESP LVEF (delta) | R-R interval (ms) | SB LVEF | SB post-PAC LVEF | PESP LVEF (delta) | R-R interval (ms) |
| 1 | 62 | 61 | −1 | 322 | 46 | 53 | 7 | 261 |
| 3 | 68 | 50 | −18 | 292 | 37 | 52 | 15 | 301 |
| 4 | 60 | 58 | −2 | 275 | 40 | 54 | 14 | 279 |
| 5 | 68 | 68 | 0 | 248 | 33 | 68 | 35 | 266 |
| 6 | 60 | 68 | 8 | 261 | 51 | 62 | 11 | 266 |
| 7 | 65 | 73 | 8 | 253 | 28 | 60 | 32 | 253 |
| 9 | 55 | 74 | 19 | 248 | 42 | 71 | 29 | 270 |
| 10 | 63 | 73 | 10 | 266 | 48 | 53 | 5 | 231 |
| 11 | 60 | 73 | 13 | 239 | 46 | 52 | 6 | 283 |
| Mean | 62.3 ± 4.2 | 68 ± 8.4 | 4.1 ± 10.8 | 267.1 ± 26.1 | 41.2 ± 7.5 | 58.3 ± 7.3 | 17.1 ± 11.8* | 267.8 ± 19.6 |
| R = 0.29, P = 0.34 | R = −0.8, P = 0.009 | |||||||
R-R interval is reported in each case due to variability in AV nodal conduction between animals despite a fixed PAC coupling interval of 200 ms. PESP LVEF (%) = SB post-PAC LVEF (%) − SB LVEF without ectopy (%); correlation coefficient (Pearson, R) between PESP LVEF at 200 ms/350 ms and final LVEF.
AV, atrioventricular; CM, cardiomyopathy; LVEF, left ventricular ejection fraction; PAC, premature atrial contraction; PESP, post-extrasystolic potentiation; PVC, premature ventricular contraction; SB, sinus beat.
After 12 weeks of bigeminal PVCs, PESP after PACs was significantly higher after PVC-CM had developed compared to baseline (delta-LVEF baseline 4.1 ± 10.8% vs. 12 weeks 17.1 ± 11.8%, P < 0.001), especially in those with a more severe LV dysfunction. Similar to PVCs, PESP with PACs had a significant negative correlation with the degree of CM at 12 weeks (early PVCs: R = −0.8, P = 0.009), in other words, the higher the PESP after PACs once PVC-CM has developed, the lower the LVEF when bigeminal PACs were not present.
Discussion
This PVC-canine study comprehensively validates prior clinical and animal model studies that analysed causal-relationship between PVCs and CM.3,8,13 Premature ventricular contraction-CM, like any other CM, leads to heart failure admissions and implantation of defibrillators and resynchronization devices. Consequently, PVC-CM carries a significant financial burden if untreated. Appropriate identification and treatment of PVC-CM could reverse this CM with a subsequent decrease in morbidity, mortality, and subsequent healthcare expenditure.15,16
Frequent PVCs of at least 10% have been shown to be associated with PVC-CM, while a mean PVC burden of 24% has been shown to have a sensitivity and specificity close to 80% for the diagnosis of PVC-CM.3 However, it is unclear why some patients with similar or higher PVC burdens do not develop PVC-CM, while some of those with CM do not improve LV function after PVC suppression.5,17–19 This leads to a clinical predicament about how to approach patients with frequent PVCs with a preserved LV systolic function.
Premature ventricular contractions lead to additional Ca2+ entry through L-type Ca2+ channels at a time when the cytosolic Ca2+ buffer capacity is saturated.9 Therefore, this Ca2+ surplus enters into the myocyte’s Ca2+ cycle constituting an additional source of sarcoplasmic reticulum Ca2+ load and release in the subsequent beat. This increase in Ca2+ release results in a cytosolic Ca2+ overload responsible for the phenomenon referred to as PESP. As shown in prior experimental studies, calcium overload and PESP are inversely proportional to coupling intervals and independent of loading conditions.10,20
Post-extrasystolic potentiation has been recently reported to predict response in patients with suspected PVC-CM.11,12 To our knowledge, this is the first study to present a detailed analysis of temporal changes of PESP as PVC-CM develops. Our main findings include (i) early-coupled PVCs are associated with a hyperdynamic LV (LVEF > 70%) in a structurally normal heart, while they normalize LV systolic function (LVEF > 50%) once PVC-CM has developed; (ii) baseline PESP after PVCs at 200 ms demonstrate a strong statistically significant correlation with future development of PVC-CM (R = 0.74, P < 0.01), while baseline PESP after PVC at 350 ms and PAC have positive correlations without significance (R = 0.54, P = 0.09 and R = 0.29, P = 0.34, respectively), that is to say, that animals that showed a higher degree of PESP at baseline had a better LVEF after 12 weeks of bigeminal PVCs at 200 ms; and (iii) once PVC-CM has developed, PESP after all three post-ectopic beats (PVC-200, PVC-350, and PAC) had a negative correlation with LVEF (R = −0.9, −0.88, and −0.8, respectively, P < 0.01), in other words, the higher the PESP in the setting of PVC-CM, the lower the LVEF when ectopy is not present.
Post-extrasystolic potentiation in the normal heart
Our model seems to suggest that a structurally normal heart should demonstrate a hyperdynamic LV function (LVEF > 70%) when exposed to early-coupled PVCs and that a preserved LV function (LVEF 50–60%) may represent a mild or early-stage of PVC-CM, analogous to early stages of CM-induced by mitral regurgitation. Furthermore, our findings suggest that those with a higher degree of PESP (presumably attaining higher intracellular Ca2+ concentration) tend to preserve their LVEF better when exposed to frequent PVCs than those that produce a lesser degree of PESP. These findings were more apparent in the sinus beat post-PVC with coupling intervals of 200 ms as opposed to 350 ms and PACs. This suggests that not all animals have similar Ca2+ overload and PESP in response to similar PVC burden despite having the same origin and coupling interval, likely representing a phenotypical feature of calcium handling properties that predispose or minimize the risk of developing PVC-CM.10
Post-extrasystolic potentiation in the cardiomyopathic heart
In contrast to baseline PESP (prior to development of PVC-CM), PESP after 12 weeks of chronic bigeminal PVCs demonstrated a negative correlation with LVEF at 12 weeks in all three post-ectopic beats (R = −0.9, −0.88, and −0.8, respectively, P < 0.01), meaning that the higher the PESP, the more likely that a lower LVEF is present upon cessation of PVCs. Assuming that all animals normalize their LV function after cessation of PVCs noted on prior publication,13 we could speculate that the higher the PESP in the setting of CM and frequent PVCs, the more likely that the CM will recover. This is consistent with recent findings by Krishnan et al.11 who described that PESP (assessed by invasive haemodynamic systolic BP accentuation) might be a marker for subsequent recovery of LVEF after catheter ablation in patients with LV dysfunction and frequent PVCs. Putting these findings together, we hypothesize that the degree of PESP may predict reversibility in the already cardiomyopathic ventricle.
Potential implications of Post-extrasystolic potentiation
Interestingly, PESP (on post-PVC and post-PAC beats) after the development of PVC-CM was significantly higher than at baseline (Tables 2 and 3). This is consistent with a recent publication by Billet et al.12 showing that patients with PVC-CM had a significantly higher PESP (measured invasively as systolic BP augmentation) as compared to controls.
We speculate that a higher degree of PESP in normal hearts portends a better outcome than those with less PESP even if exposed to identical PVC burden, origin, and prematurity. In a diseased heart, PESP suggests some degree of reversibility based on findings of Krishnan et al.11 We speculate that the PVC cardiomyopathic heart sustains some degree of adaptation or remodelling which allows for a higher degree PESP post-ectopy as compared to hearts with relatively preserved systolic function. As a clinical correlate, this cohort with a vigorous PESP should be aggressively treated for PVC-CM as the PESP may not be perennially sustainable and could lead out myocyte burnout.
To prove these hypotheses, we would require performing cellular studies (calcium handling and contractility) in isolated myocardial cells at baseline and after the development of PVC-CM, which is not feasible since it requires euthanasia to harvest the heart. Thus, we can only speculate baseline calcium overload (prior to PVC exposure) based on PESP using non-invasive and non-terminal experiments. Cellular and molecular studies at the time of terminal surgery are the obvious next step, although it will only allow us to assess calcium handling and PESP at different PVC coupling intervals after PVC-CM has developed, which could only help us understand differences in PESP based on different degrees of PVC-CM severity.
While these findings suggest that higher PESP is a favourable prognostic sign in healthy hearts or PVC-CM, we cannot transfer these findings to other cardiomyopathies. In our study, those animals with a lesser drop in LVEF at 12 weeks had a lower PESP at 12 weeks. Whether this is a function of their relatively preserved LVEF or whether it suggests irreversibility of PVC-CM on longer follow-up is unknown.
If these results are clinically corroborated, PESP assessed by echocardiography would allow us to (i) recognize patients with normal hearts at risk to develop PVC-CM based on their degree of PESP, and (ii) identify patients with PVC-CM and predict recovery of LV function after PVC suppression.
Limitations
In our post-PAC cohort, attempts were made to standardize the coupling interval with PACs at 280 ms; however, due to varying heart rates (and consequently PR intervals) between animals, and within the same animals across studies, the R-R interval was variable.
Baseline heart rate while performing echocardiograms with and without PVCs was not controlled. Thus, we cannot exclude that the variability of the heart rate may have influenced PESP. However, its clinical significance may be limited due to known short fluctuations in sinus rate after PVCs known as heart rate turbulence that may vary based on PVC coupling interval.
True recovery of CM was not confirmed since bigeminal PVCs were not disabled after the development of PVC-CM. Post-extrasystolic potentiation correlation with LVEF recovery after 12 weeks of bigeminal PVCs assumes that LVEF fully recovered since (i) these are healthy animals where CM was triggered solely by frequent PVCs, and (ii) a normal LVEF during sinus beat only after PVC is noted in a cardiomyopathic state (LV dysfunction only noted when PVCs are not present).
This study lacks evaluation of RV function. Based on our experience, echocardiography is not a reliable tool to evaluate detailed RV function in canines. Thus, we solely evaluated LV function as demonstrated in the clinical setting and other animal models.
Our study lacks cellular or molecular studies to address the mechanism responsible for this observation. Future studies to identify the differences in baseline cellular and molecular associated with PESP are important as they may identify alternative treatments to prevent or minimize the development of PVC-CM.
These findings are on a structurally normal heart, and it is unclear the respond of PESP in other disease states such as ischaemic and valvular heart disease.
Conclusions
In healthy canine hearts, bigeminal early-coupled PVCs demonstrate a hyperdynamic LV function (LVEF > 70%) during the sinus beat post-PVC, while a preserved LV function (LVEF 50–60%) may suggest the presence of an early-stage PVC-CM. Furthermore, a lower degree of PESP at baseline appears to identify animals at risk to develop a more severe PVC-CM at 12 weeks. In contrast, once PVC-CM has developed, PVCs and PACs produce a higher degree of PESP at 12 weeks which could either be due to a lower initial LVEF or could suggest a favourable chance of reversibility of PVC-CM. For decades, analysis of ectopic and post-ectopy sinus beats on echocardiographic studies has been avoided. Our data advocate for echocardiographic analysis of post-PVC/PAC sinus beat and PESP as it could assist us in identifying patients with a diagnosis of PVC-CM and targeting PVC suppression accordingly. Finally, PESP in patients with a normal systolic function and rare or occasional PVCs can be a marker of risk for PVC-CM if ventricular ectopy were to increase to a significant burden. Further clinical studies are necessary to validate our findings.
Acknowledgements
The authors want to thank Jose M. Eltit, PhD and Montserrat Samso, PhD for their contribution to discussion results of this data.
Funding
The work was supported by National Institute of Health (National, Heart, Lung and Blood Institute) [grant number 1R01HL139874-01, 1R56HL133182-01 (PI: J.F.H.)]. Research grant from Abbott (PI: J.F.H.).
Conflict of interest: K.K. received research support from Boston Scientific Corp (BS) and St. Jude Medical (SJM). J.N.K. received research support from BS, Biosense Webster (BW), and Medtronic Inc. (MDT); consultant for MDT; and Honoraria from MDT and BS. K.A.E. received research support from BS, BW, MDT, SJM, and NIH; consultant for BS, SJM, Atricure, and MDT; and Honoraria from MDT, BS, Biotronik (BTK), BW, and Atricure. A.Y.T. received research support from BS, MDT, and BTK. J.F.H. received research support from SJM. The other authors have no conflict of interest to declare.
