


Abstract
The limitation of QRS duration as a surrogate measure for left ventricular (LV) mechanical dyssynchrony (LVMD) in cardiac resynchronization therapy (CRT) patient selection encourages seeking alternatives to QRS duration. Exploring the potential of an analysis program of electrocardiographically gated myocardial perfusion single photon emission computed tomography (SPECT) (GMPS) for the estimation of LVMD to predict CRT response.
Twenty-four patients undergoing CRT for advanced heart failure caused by non-ischaemic cardiomyopathy were studied. Gated myocardial perfusion single photon emission computed tomographies were performed in the setting of temporary CRT suspension after 1 week of CRT adoption. The GMPS data were computed with a novel program capable of segmental LV time–volume analysis. When a brain natriuretic peptide (BNP) value decreased >50% at 6-month follow-up, the patient was defined as a CRT responder. Receiver operating characteristic (ROC) curves for identification of responders were analysed for standard deviation of time to end systole (TES-SD) among 17 LV segments. Linear regression analyses demonstrated that an increase in percentage reduction in BNP level at 6-month follow-up was predicted by an increase in TES-SD (R2 = 0.21, P = 0.023). The TES-SD in responders (n= 15, 62.5%) was higher than that in non-responders (100 ± 51 vs. 41 ± 17 ms, P= 0.0008). A cutoff value of TES-SD >49 ms predicted responders with 100% sensitivity and 78.8% specificity and the area under the ROC curve was 0.881 for TES-SD (P= 0.002).
The estimation of LVMD using this novel GMPS program could be an alternative or a complementary approach to QRS duration in CRT patient selection. This finding warrants further assessment of our approach in larger studies.
Although cardiac resynchronization therapy (CRT) has been established as an effective therapeutic option for patients with advanced heart failure, approximately one-third of patients undergoing CRT fail to show favourable responses to CRT (i.e. non-responder).1 The principal therapeutic target for CRT is left ventricular (LV) mechanical dyssynchrony (LVMD), which is wrought by ventricular conduction delay.2 Therefore, the current recommendation for CRT in patients with heart failure includes electrocardiogram evidence of prolonged QRS duration (>120 ms).3 However, large numbers of observations have raised concerns over the reference value of the QRS duration in predicting LVMD, and the insufficient correlation between presence of LVMD and QRS duration is considered to be one of the potential causes for the lack of a response to CRT.4
A variety of echocardiographic measures have been developed as an alternative or a complementary approach to prolonged QRS for the estimation of LVMD in CRT patient selection.5 Nonetheless, no single echocardiographic measure of LVMD is yet recommended to improve patient selection among CRT candidates.6 On the other hand, an approach using a free operating computer program capable of segmental LV time–volume analysis in application on electrocardiographically gated myocardial perfusion single photon emission computed tomography (SPECT) (GMPS) has recently been proposed as a means for the quantitative assessment of LVMD.7–9 The potential of this approach to improve CRT patient selection was also implied in a couple of case reports.10,11
The present study involved a series of cases undergoing CRT and aimed to explore the clinical utility of the proposed GMPS analysis program for the estimation of LVMD in CRT patient selection.
Methods
Patients and cardiac resynchronization therapy system implantation
We studied 24 consecutive patients who were treated with CRT for symptomatic heart failure caused by non-ischaemic cardiomyopathy and underwent GMPS for the evaluation of LVMD 1 week after CRT adoption. All patients had depressed LV ejection fraction <35% and were in New York Heart Association (NYHA) functional Class III or IV despite optimal medical therapy, which included beta-blockers, angiotensin-converting enzyme inhibitors, or angiotensin receptor blockers, if tolerated. The QRS duration at baseline was <120 ms in eight patients who were preselected by echocardiographic criteria of LVMD.12,13 A total of 19 patients were in sinus rhythm, and the remaining 5 patients were in permanent atrial fibrillation (AF). One patient with permanent AF underwent atrioventricular junction ablation immediately after CRT adoption.
After giving written informed consent, all study patients underwent CRT and GMPS. This study was approved by the institutional review board of Edogawa Hospital.
Commercially available dedicated CRT systems were implanted with the use of standard right ventricular leads in all patients. Right atrial leads were implanted only in patients in sinus rhythm. Transvenous LV leads were implanted and positioned in the mid-portion of the lateral or posterolateral branch of the coronary vein in 23 patients. In the remaining one patient, an epicardial pacing lead was implanted surgically on the posterolateral LV lead instead of the transvenous LV lead because of the inability to obtain stable stimulations from the branch of the coronary vein. The atrioventricular delay was optimized using Doppler echocardiography in all patients in sinus rhythm. The interventriclar delay was optimized using Doppler echocardiography in 20 patients who had CRT device capable of interventriclar delay optimization. All patients, including patients with permanent AF, had achieved >95% of biventricular pacing throughout the study with the programming in biventricular DDD or VVI/R mode with the lower rate of 60–70 bpm and negative chronotropic agents (i.e. beta-blockers).
Gated myocardial perfusion single photon emission computed tomography study
All patients underwent GMPS study after 1 week of CRT adoption. For the GMPS data acquisition, a single dose of 99mTC agents (370–740 MBq) was administered intravenously at rest and GMPS was initiated 30–60 min later. The data acquisition was performed twice in a row for each patient, in the settings of temporary CRT suspension (CRT-off) and subsequent CRT resumption (CRT-on), respectively, using a parallel dual-head gamma camera. A total of 64 projections (step and shoot mode, 40–50 beats/projection) were obtained over a 360° circular orbit. Each of the acquisitions was gated for 16 frames/cardiac cycle.
Left ventricular mechanical dyssynchrony evaluation
The acquired imaging data were processed by a free operating program (cardioGRAF®, FUJIFILM RI Pharma, Tokyo, Japan) to compute and visualize the regional contraction timing in LV as time–volume curves. The LV was divided into 17 volume segments, of which the regional wall motion and change in myocardial wall thickening were estimated. The variation of volume in time was measured for each segment, where the onset of a cardiac rhythm was triggered on the peak of the R-wave, and the instant of end systole was detected using the zero-crossing detection on the third derivative of the time–volume curve. Among the zero-crossing 100 points on the contraction velocity, the instant coinciding with the minimal volume on the time–volume curve was estimated as the time of end systole (Figure 1). More Figures have been placed as close as possible to their first citation. Please check that they have no missing sections and that the correct figure legend is present. detailed explanations of this process by cardioGRAF® have been described in earlier reports.7–9 For quantitative assessment of LVMD, we calculated the standard deviation of time to end systole (TES-SD) (i.e. time from the onset of the R-wave to end systole) of all 17 LV segments. TES-SD was calculated for each of the GMPS data derived at CRT-off and CRT-on.
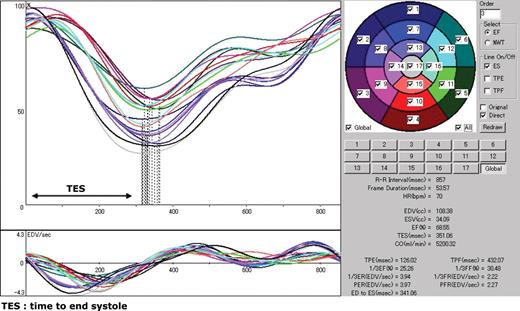
The main window of cardioGRAF® processing the electrocardiogram-gated myocardial perfusion single photon emission computed tomography (SPECT) in a healthy subject. The division of the left ventricular myocardium into 17 volume segments and numbering are illustrated on the upper right panel. The upper left panel displays the time–volume curves of the segments. The time 0 on the abscissa is triggered on the peak of the R-wave that is not shown here. The lower left panel shows the derivative of the time–volume curves that corresponds to the contraction velocity of the respective volume segment. The vertical dotted lines on the time–volume curves are the instant of end systole of each regional myocardial volume estimated by zero-crossing of contraction velocity and minimal volume.
Definition of responders to cardiac resynchronization therapy
When a plasma brain natriuretic peptide (BNP) level decreased >50% at 6 months after CRT adoption, the patient was defined as a CRT responder. Before and 6 months after CRT adoption, venous blood samples were slowly obtained in tubes containing ethylenediaminetetraacetic acid–sodium at rest ∼30 min. Plasma BNP was measured by a chemiluminescence immunoassay (CLIA) Kit (ARCHITECT BNP-JP; normal reference values <18.4 pg/mL) in an automated analyser (ARCHITECT, Abott Japan).
Statistical analysis
Data are expressed as number, mean ± standard deviation (SD), or percentage where appropriate. Continuous variables were compared with Wilcoxon signed-rank test and Mann–Whitney U test for paired and unpaired data, respectively, whereas comparisons for categorical variables were performed with Fisher's exact test. Linear regression analyses were performed to assess the relationships between percentage reduction in plasma BNP level at 6-month follow-up and each TES-SD at CRT-off and QRS duration at baseline. Receiver operating characteristic (ROC) curves for identification of responders were analysed for TES-SD at CRT-off. The optimal cutoff value, defined as that providing the maximal accuracy to distinguish between responders and non-responders for TES-SD at CRT-off, was determined by the ROC curve analysis. A probability value of P<0.05 was considered statistically significant. Analyses were performed with SPSS statistical software, SPSS 11.0.1J.
Results
Characteristics of non-responders and responders
The patients were divided into 9 non-responders (37.5%) and 15 responders (62.5%), based on a decrease in plasma BNP level >50% at 6 months after CRT adoption. The QRS duration at baseline in 5 out of the 15 responders was <120 ms. At baseline, no significant differences were observed between non-responders and responders with respect to the characteristics (Table 1). Similarly, there were no significant differences between non-responders and responders with respect to the LV lead locations (Table 1). At 6-month follow-up, the mean NYHA functional class improved in responders, whereas it remained unchanged in non-responders. Similarly, the mean LV ejection fraction, LV end diastolic dimension, and LV end systolic dimension measured by echocardiography, and the mean plasma BNP level improved only in responders (Table 2).
Baseline characteristics and left ventricular lead location
| Parameters | Non-responders (n = 9) | Responders (n = 15) | P value |
|---|---|---|---|
| Age (years) | 63.4 ± 13.2 | 62.8 ± 12.2 | 0.72 |
| Male sex (n) | 8 (88.9%) | 9 (60.0%) | 0.19 |
| NHYA Class III (n) | 7 (77.8%) | 11 (73.3%) | 1 |
| AF (N) | 2 (22.2%) | 3 (20.0%) | 0.56 |
| QRS duration (ms) | 129 ± 34.3 | 161.7 ± 55.8 | 0.20 |
| QRS<120 ms (n) | 3 | 5 | 1 |
| LVDd (mm) | 67.2 ± 11.2 | 66.0 ± 7.6 | 0.63 |
| LVEF (%) | 27.7 ± 7.3 | 29.1 ± 4.3 | 0.88 |
| BNP (pg/mL) | 480.0 ± 549.5 | 667.0 ± 514.8 | 0.35 |
| Lead location (lateral/PL wall) | 7/2 | 11/4 | 0.81 |
NYHA, New York Health Association; AF, atrial fibrillation; LVDd, left ventricular diastolic dimension; LVEF, left ventricular ejection fraction; BNP, brain natriuretic peptide.
New York Health Association functional class, echocardiographic and brain natriuretic peptide level variables at baseline and follow-up for non-responders vs. responders
| Parameters | Non-responders (n = 9) | Responders (n = 15) | P value |
|---|---|---|---|
| NYHA functional class | |||
| Baseline | 3.2 ± 0.4 | 3.3 ± 0.5 | 1 |
| Follow-up | 3.0 ± 0.7 | 1.5 ± 0.7* | 0.005 |
| LVDd (mm) | |||
| Baseline | 67.2 ± 11.2 | 66.0 ± 7.6 | 0.63 |
| Follow-up | 64.6 ± 15.3 | 58.3 ± 8.7* | 0.13 |
| LVDs (mm) | |||
| Baseline | 58.7 ± 9.3 | 56.3 ± 7.9 | 0.37 |
| Follow-up | 57.0 ± 16.0 | 46.2 ± 9.8* | 0.023 |
| LVEF (%) | |||
| Baseline | 27.7 ± 7.3 | 29.1 ± 4.3 | 0.88 |
| Follow-up | 29.4 ± 10.2 | 40.7 ± 13.8* | 0.01 |
| BNP (pg/mL) | |||
| Baseline | 480.0 ± 549.5 | 667.0 ± 514.8 | 0.35 |
| Follow-up | 525.0 ± 561.3 | 165.1 ± 224.4* | 0.029 |
*P<0.05 follow-up vs. baseline value.
Abbreviations as in Table 1.
Left ventricular mechanical dyssynchrony
The mean TES-SD at CRT-off in responders was significantly larger than that in non-responders (100 ± 51 vs. 41 ± 17 ms, P= 0.0008). The mean TES-SD at CRT-off in responders decreased by the subsequent CRT resumption, while the mean TES-SDs at CRT-off and CRT-on in non-responders were similar (Figures 2A, B and 3A, B).
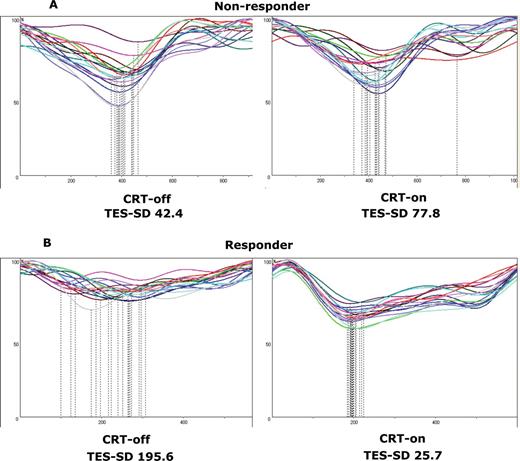
Changes in the time–volume curves derived by cardioGRAF® analyses between temporary cardiac resynchronization therapy suspension (CRT-off) and subsequent cardiac resynchronization therapy resumption (CRT-on) in a non-responder (A) or a responder (B) patient. Standard deviations of time to end systole of all 17 left ventricular segments (standard deviations of time to end systole) for non-responders at CRT-off and CRT-on were 42.4 and 77.8, respectively. Standard deviations of time to end systole for responders at CRT-off and CRT-on were 195.6 and 25.7, respectively.
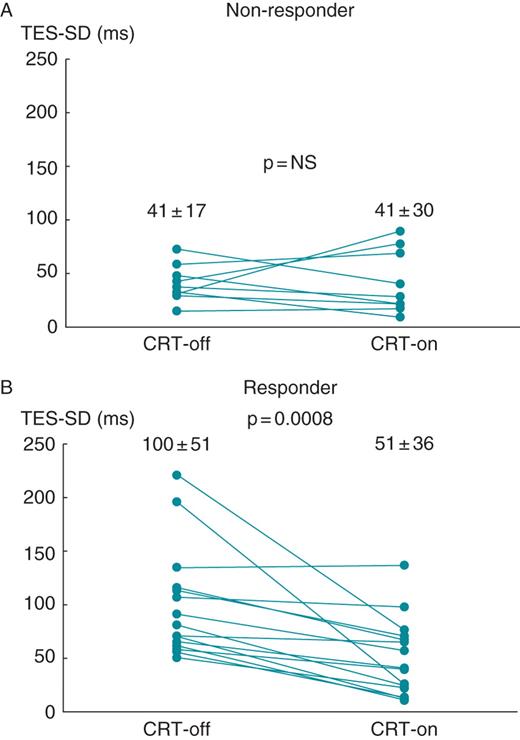
Changes in the mean standard deviations of time to end systole of all 17 left ventricular segments (standard deviation of time to end systole) between temporary cardiac resynchronization therapy suspension (CRT-off) and subsequent cardiac resynchronization therapy resumption (CRT-on) in non-responder (A) or responder (B) patients. The mean standard deviations of time to end systole for non-responder patients at CRT-off and CRT-on were 41 ± 17 and 41 ± 30 ms, respectively (P= NS). The mean standard deviation of time to end systole for responder patients at CRT-off and CRT-on were 100 ± 51 and 51 ± 36 ms, respectively (P= 0.0008).
Prediction of response to cardiac resynchronization therapy
Linear regression analyses demonstrated that an increase in percentage reduction in plasma BNP level at 6-month follow-up was predicted by an increase in TES-SD at CRT-off (Figure 4), but that was not predicted by an increase in QRS duration at baseline. The ROC curve analysis for identification of responders with TES-SD at CRT-off showed that the area under the curve for TES-SD at CRT-off was 0.881 and the optimal cutoff value of 49.2 ms yielded 100% sensitivity and 78.8% specificity.
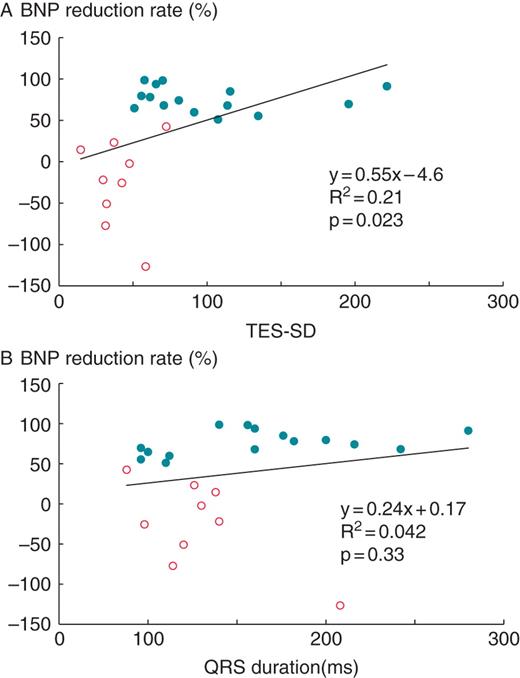
Relationship between percentage reduction in plasma brain natriuretic peptide level at 6-month follow-up and standard deviation of time to end systole of all 17 left ventricular segments (standard deviation of time to end systole) at temporary cardiac resynchronization therapy suspension (CRT-off) for (non-responder is represented by open circles and responder is by filled circles? patients. Linear regression analysis demonstrated an increase in percentage reduction in plasma BNP level at 6-month follow-up which was predicted by an increase in TES-SD at CRT-off.
Discussion
Despite the fact that the power of QRS duration as a surrogate measure for LVMD and estimation of responses to CRT is limited, no reliable approach as an alternative to QRS duration has yet been established. A recent prospective multicentre study, the Predictors of Response to CRT (PROSPECT), tested the performance of multiple echocardiographic parameters to predict CRT response.6 This multicentre study proved that all the parameters tested were not sufficient to predict CRT responses and acknowledged the reproducibility of measurements as one of the key challenges in developing a reliable approach for estimating LVMD. In these circumstances, interest in phase analysis using GMPS as a potential approach for the estimation of LVMD is now increasing.14 A phase analysis tool is largely automatic, and therefore the measurements might not require considerable expertise to obtain reproducible results unlike those obtained by echocardiography.14 In fact, the program we used in the present study (i.e. cardioGRAF®), a phase analysis tool for GMPS, yields favourable reproducibility. Takahashi et al.9 evaluated the program and demonstrated that the inter- and intra-observer reproducibilities (i.e. coefficient of variation error) were 4.8 and 3.2%, respectively, for the time to end systole (i.e. time from the onset of the R-wave to end systole). Given this observation, our approach seems to be more reliable for the estimation of LVMD in comparison with the echocardiographic approach.
Major findings
The major findings of the present study can be summarized as follows: (i) The extent of TES-SD could be used to quantify the LVMD, a principal therapeutic target for CRT; (ii) TES-SD might be a superior measure to QRS duration in predicting a response to CRT (i.e. percentage reduction of plasma BNP level); and (iii) the ROC curve analysis for identification of responders with TES-SD at CRT-off indicated that the area under the curve was 0.881, and the optimal cutoff value of 49.2 ms yielded 100% sensitivity and 78.8% specificity.
TES-SD at CRT-off in responders was larger and decreased immediately after CRT-on, while that in non-responders was smaller and was not changed by CRT-on. This finding suggests that TES-SD could be a quantitative marker of LVMD that is the therapeutic target for CRT. The QRS duration in responders was longer than that in non-responders, with a statistically non-significant difference (Table 1). Nonetheless, linear regression analyses demonstrated that an increase in TES-SD at CRT-off predicted a percentage reduction of plasma BNP level, whereas an increase in QRS duration at baseline did not predict it. This seems to support the fact that TES-SD might be a potentially alternative or complementary approach to QRS duration in CRT patient selection. The present study did not conduct a head to head performance comparison between cardioGRAF® and any other phase analysis tools of GMPS. Considering all of the major findings together, an approach using cardioGRAF® is likely to be promising beyond QRS duration and comparable to those using other phase analysis tools of GMPS with respect to predicting responses to CRT.15,16 Furthermore, it is noteworthy that one-third of the patients involved in the present study (n= 8) exhibited normal QRS duration (<120 ms) at baseline. The TES-SD at CRT-off of 49.2 ms was able to divide determinately these patients into responders and non-responders, with one exception. In other words, TES-SD at CRT-off in all five responders who exhibited normal QRS duration at baseline was above 49.2 ms and that in two out of three non-responders who exhibited normal QRS duration at baseline was below 49.2 ms. Although these patients were preselected by echocardiographic criteria of LVMD, this finding implies the potential utility of cardioGRAF® in selecting CRT candidates from patients with heart failure with normal QRS duration.
Plasma brain natriuretic peptide level as a marker of cardiac resynchronization therapy response
There is currently no unifying definition of responders, and published data were often based on LV reverse remodelling exhibited by echocardiography at mid-term follow-up. In particular, significant LV reverse remodelling defined as >10–15% reduction in LV end systolic volume, which may be a strong predictor of long-term favourable prognosis in patients undergoing CRT, has been frequently used to define a mid-term CRT responder.17,18 The measurements of LV end systolic volume using echocardiography, however, require a certain expertise to obtain accurate results and thus may not always be suitable for use in daily clinical practice in every medical facility. On the other hand, widely known observations suggest that a decrease in plasma BNP level associated with drug treatment in patients with heart failure correlates with improvement in haemodynamic parameters, clinical status, and prognosis, including number of hospitalizations for deterioration of heart failure condition.19,20 Moreover, recently, Kubánek et al.21 reported that a decrease in plasma BNP level early after initiation of CRT (i.e. from baseline to 3-month follow-up) predicted clinical improvement at 12 months better than clinical, echocardiographic, and exercise parameters at 3-month follow-up. As a matter of course, plasma BNP levels can be determined without much difficulty regardless of the expertise. The criterion we used to define a responder—a plasma BNP level decreased >50% at 6 months after CRT adoption —may be arbitrary. In the light of the above observations and situations, however, the criterion should have a measure of legitimacy as a predictor of long-term favourable prognosis associated with CRT.
Limitations
The present study has several limitations. First, we tested the performance of TES-SD measured at CRT-off after 1 week of CRT adoption as a substitute for TES-SD measured before CRT adoption to predict CRT response. We cannot exclude the possibility that 1 week of CRT adoption modified the true value of TES-SD measured before CRT adoption in predicting response to CRT. Second, the present study included some patients with permanent AF. AF produces changes in cardiac cycle length, which means that image acquisition is actually a sum of cycles of different duration. This might have affected detection of both the instant of end systole in each LV segment identified by cardioGRAF® and the extent of LVMD measured by TES-SD. A previous study has addressed the reproducibility of quantified cardiac function parameters computed by GMPS in patients with AF and demonstrated relatively reliable reproducibility.22 Therefore, we believe that the deviation of the results by the presence of AF patients was minimal. Third, the present study did not include patients with ischaemic cardiomyopathy because of the potential inferiority with respect to depicting the accurate endocardial line of the left ventricle by GMPS. Finally, the limited number of study patients prevents us from concluding definitely the true value of LVMD estimation using cardioGRAF® in predicting response to CRT.
Conclusion
The estimation of LVMD using a novel GMPS program (i.e. cardioGRAF®) seems to be a potentially alternative or complementary approach to QRS duration in CRT patient selection. This finding warrants further assessment of our approach to predict long-term CRT response in larger studies.
Conflict of interest: M.T. is an employee of Medtronic Japan. K.N., A.M., M.S., I.C., S.I., S.H., T.K., and H.M. have no potential conflicts of interest.
