


Abstract
To assess the impact of pacing from different right ventricular (RV) pacing sites on left ventricular (LV) function. Chronic apical RV pacing may induce heart failure. To reduce this RV, mid-septum and outflow tract are suggested as alternative pacing sites. We therefore assessed cardiac performance during temporary RV pacing from apical vs. mid-septum or outflow tract sites, using echocardiography and electrocardiography.
Patients scheduled for a permanent pacemaker underwent temporary pacing in dual-chamber mode (DDD) and with atrio-ventricular delay optimized. The ventricular lead was moved to either the RV apex, mid-septum or outflow tract. Comprehensive echocardiography was performed in each position. Twenty-two patients completed the study. The baseline data was collected at atrial pacing mode (AAI). QRS duration lengthened with RV apical pacing (97 ± 22 ms AAI vs. 154 ± 18 ms RV apical, P< 0.001) and shortened with mid-septum or outflow tract pacing (147 ± 14 ms RV mid-septum and 136 ± 16 ms RV outflow tract, P= 0.001 and P< 0.001, respectively, vs. RV apical). Right ventricular apical pacing was associated with reductions in stroke volume and LV ejection fraction (54 ± 6% AAI vs. 48 ± 5% RV apical, P= 0.001). Right ventricular mid-septum (52 ± 5%) and outflow tract (54 ± 6%) pacing improved LV ejection fraction in comparison with apical pacing (P< 0.01 for both). Pacing at all sites induced dyssynchrony. In comparison with RV apical pacing dyssynchrony was reduced by mid-septum or outflow tract pacing.
Right ventricular pacing at the mid-septum or outflow tract results in narrower QRS complexes, less dyssynchrony, and better LV systolic function than RV apical pacing.
Introduction
The apex of the right ventricle (RV) remains the established site for permanent pacemaker lead placement. Apical positioning of the RV lead, however, results in abnormal depolarization of the left ventricle (LV).1 The detrimental haemodynamic effects of non-physiological LV activation are established and the adverse consequences of prolonged RV apical pacing are increasingly recognized.2–5 In particular, stimulation of the RV apex frequently reduces the synchrony and efficiency of LV contraction.6–9 This may ultimately result in pacing-induced heart failure, which occurs in ∼3% of patients per year.1,9–11 One strategy to prevent this complication has been to pace the heart from alternative RV positions.6,12–15
Lead positioning during pacemaker implantation can be inexact when fluoroscopic guidance alone is used.1 Characteristic electrocardiography (ECG) appearances could, however, assist more physiological lead positioning.1,16,17 Recording a surface 12-lead ECG at the time of pacemaker insertion might, therefore, increase the accuracy of fluoroscopic lead placement. Characteristic ECG appearances of paced beats initiated from different RV sites might be associated with changes in cardiac function and could, therefore, be useful not only in confirming lead position but in predicting cardiac performance.
Different techniques have been used to assess the effect of pacing on cardiac performance.12,18 Parameters of cardiac function that have prognostic utility in heart failure include ejection fraction, diastolic function, myocardial performance (Tei) index, and cardiac dyssynchrony.19–21 Although some of these markers have been used in isolation12,18 to assess the effects of pacing on cardiac function, no study has combined them.
In this study, we have investigated the acute effects of alternative site RV pacing on a range of well-validated echocardiographic indices of cardiac performance. We have examined the changes in ECG appearance that occur when pacing is performed at different RV sites and determined whether a correlation exists between ECG appearance and cardiac performance. The study aims to provide a comprehensive evaluation of the electrical and mechanical responses from pacing at alternative RV sites to assist clinicians as they seek to choose the optimum RV lead position for their patients.
Methods
Patients referred for implantation of a dual-chamber pacemaker (DDD) were recruited into the study. Patients with a current atrial tachyarrhythmia were excluded. The study was approved by the Grampian Research Ethics Committee and informed consent was obtained.
Pacing
Temporary pacing was performed in a sterile manner without sedation via the right femoral vein using two intra-cardiac electrical catheters (TORQR™, Medtronic, Watford, UK). Under fluoroscopic guidance, one catheter was placed in the high right atrium and the second catheter was then placed in the RV. Initially, temporary atrial pacing (AAI) was established at 10 beats per minute (bpm) above the sinus rate13 and a baseline ECG and echocardiographic study were performed. Subsequently, temporary DDD pacing was commenced using the established atrial rate, which was kept constant throughout the study at all RV sites. Atrio-ventricular delay was optimized according to the trans-mitral pulsed-wave Doppler echocardiographic method.22 The ventricular pacing catheter was placed in a random order at three RV pacing sites: apex, mid-inter-ventricular septum (approximately at the level of the superior aspect of the tricuspid valve), and outflow tract (just below the pulmonary valve). Ventricular pacing lead positions were confirmed by both fluoroscopy in both left anterior oblique and right anterior oblique views (to ensure the septum, not the free wall was being paced) and ECG characteristics (Figure 1).23,24 Pacing was carried out at twice diastolic threshold. Direct His bundle capture was avoided.
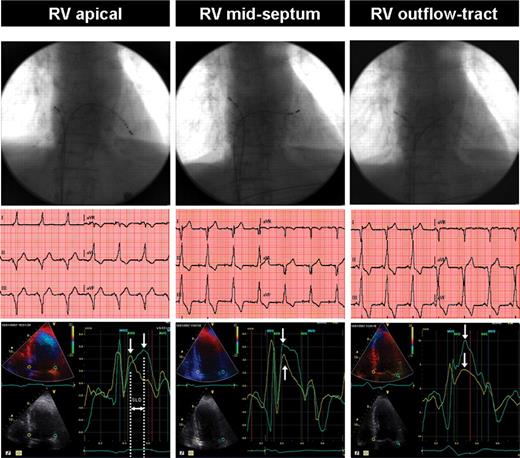
A comparison of RV apical, mid-septum, and outflow tract pacing lead sites using fluoroscopy, ECG, and dyssynchrony echocardiography: typical example. Top panel: fluoroscopic projections of the pacing leads. Middle panel: corresponding ECG traces. Apical pacing is associated with a leftward axis. In contrast, basal alternate site pacing positions were associated with more rightward axes. Bottom panel: corresponding colour tissue Doppler images (white arrows indicate peak systolic velocity in ejection phase). Systolic dyssynchrony at right ventricular apical pacing is demonstrated by the basal septal to lateral delay (SLD) of the peak systolic velocities, whereas with mid-septum and outflow tract pacing septal to lateral delay remains within normal limits. AVO and AVC: aortic valve opening and closure, respectively; MVO and MVC: mitral valve opening and closure, respectively.
Electrocardiography
A 12-lead surface ECG was performed prior to the study, during AAI pacing and for each RV pacing site studied. The QRS axis was measured and the QRS duration was calculated using the first to the last sharp vector crossing the iso-electric line in all leads. The mean of these values was derived and used for statistical analysis.
Echocardiography
A detailed trans-thoracic echocardiogram was carried out during AAI pacing, and during DDD pacing at each RV pacing site. Subjects were paced for 10 min at each pacing site prior to echocardiographic assessment. Images were obtained using a 3.5 MHz phased-array transducer and a Vivid 7 echocardiography machine (General Electric Healthcare, Chalfont St Giles, UK). For all echocardiography data, at least three consecutive paced cardiac cycles were stored in cine-loop format for off-line analysis (Echopac, General Electric Healthcare, Chalfont St Giles, UK). All echocardiographic variables were measured in triplicate from three different paced heart beats and the average value was calculated and used for statistical analysis. Inter-observer variability was derived from blinded independent assessment of 10 echocardiograms. Intra-observer variation was derived from blinded, repeated assessment of all echocardiograms. Variability was assessed using Bland–Altman analysis.25
Left ventricular ejection fraction was measured using the Simpson's bi-plane method and LV stroke volume calculated. Mitral inflow was assessed in the apical four-chamber view using pulsed-wave Doppler.26 Systolic and diastolic functions were also evaluated using colour tissue Doppler imaging (TDI), with measurement of mitral annular and myocardial velocities.27 Overall cardiac function was assessed using the myocardial cardiac performance index.18
Inter-ventricular dyssynchrony
The time from the Q-wave on the ECG to semi-lunar valve opening was evaluated using pulsed-wave Doppler of the LV outflow tract in the apical five-chamber view and the RV outflow tract in the short-axis parasternal view. An inter-ventricular mechanical delay (IVMD) ≥40 ms was considered indicative of inter-ventricular dyssynchrony.22,28
Intra-ventricular dyssynchrony (left ventricular dyssynchrony)
M-mode was used to assess septal-to-posterior wall motion delay (SPWMD) in the parasternal long-axis view at the papillary muscle level. The interval between the maximal posterior displacement of the septum and the maximal anterior displacement of the LV posterior wall was calculated. Septal-to-posterior wall motion delay ≥130 ms was taken as the cut-off value for LV dyssynchrony.22,28 Tissue Doppler imaging was used to assess longitudinal LV dyssynchrony. Myocardial velocity curves were constructed from the three standard TDI apical views and the peak sustained myocardial systolic velocity (during the ejection phase; Sm) for each of the 12-LV segments was identified. The time to peak Sm (Ts) was measured with reference to the onset of QRS complex.22,28 From these measurements a variety of previously described measures were derived (Table 4). These included the difference in Ts between the basal septum and lateral wall (septal-to-lateral delay), where a difference of ≥65 ms is a widely used indicator of LV dyssynchrony, and the standard deviation for Ts among all 12 basal- and mid-LV segments (the ‘dyssynchrony index’), where a cut-off value of ≥32.6 ms is suggested.28,29
Statistical analysis
Continuous data are expressed as mean with standard deviation where normally distributed and median with interquartile range where skewed. All statistical calculations are undertaken using SPSS version 17. Non-parametric related data are compared using Wicoxon signed ranks test. Categorical data are presented as an absolute value (%) and compared using McNemar's test. The correlation coefficient between ECG and TDI data at each RV pacing site was calculated using Spearman's rho linear correlation. Significance was established at a P value <0.05.
Results
A total of 25 patients were recruited into the study. The protocol was terminated in two patients due to atrial tachyarrhythmia and a further patient experienced phrenic nerve stimulation. Patients’ characteristics are shown in Table 1. At baseline four (18%) patients had QRS duration >120 ms. The pacing rate ranged from 60 to 100 bpm. This was achieved in 13 patients during AAI pacing (where atrial pacing resulted in 1:1 atrio-ventricular conduction), but during DDD pacing it was achieved in all patients at all ventricular pacing sites. The optimal programmed atrio-ventricular delay was 80–160 ms.
Patient demographics
| Characteristics | Patients (n= 22) |
|---|---|
| Age (years), median (interquartile range) | 75 (68–80) |
| Male | 16 (73%) |
| Known coronary heart disease, n (%) | 8 (36%) |
| Previous paroxysmal atrial fibrillation, n (%) | 3 (14%) |
| Heart rate limiting therapy, n (%) | 6 (27%) |
| Hypertension, n (%) | 11 (50%) |
| Diabetes mellitus, n (%) | 3 (14%) |
| Peripheral vascular disease, n (%) | 2 (9%) |
| Renal failure, n (%) | 3 (14%) |
| Hypothyroidism, n (%) | 2 (9%) |
| Chronic obstructive lung disease, n (%) | 2 (9%) |
| Heart rate (from pre-pacing ECG) (bpm) | 62 ± 16 |
| <60 bpm, n (%) | 7 (32%) |
| Systolic blood pressure (pre-pacing, mmHg), mean±SD | 135 ± 24 |
| Diastolic blood pressure (pre-pacing, mmHg), mean±SD | 65 ± 13 |
| Pulse pressure (mmHg) | 70 ± 24 |
| QRS duration (ms) | 97 ± 22 |
| >120 ms: (3 LBBB and 1 RBBB), n (%) | 4 (18%) |
| Indications for permanent pacemaker | |
| Atrio-ventricular node (AVN) block, n (%) | 10 (45%) |
| Sino-atrial node (SAN) block, n (%) | 7 (32%) |
| Combined AVN and SAN block, n (%) | 2 (9%) |
| Tri-fascicular block and syncope, n (%) | 1 (4.5%) |
| Neuro-cardiogenic syncope, n (%) | 2 (9%) |
ECG changes with pacing position
During AAI pacing the axis ranged between −52° and +128°, with a median value of 0°. Pacing at the RV apex produced negative QRS complexes in the inferior leads with a frontal plane axis range of between −100° and +130° (median −64°): 19 (86%) patients had left-axis deviation. The frontal plane axis shifted progressively rightward as the pacing site moved to the RV mid-septum and superiorly to the RV outflow tract (Table 2).
QRS axis and duration changes between different pacing sites
| Pacing site | P values | |||||||
|---|---|---|---|---|---|---|---|---|
| AAI | RVA | RVmIVS | RVOT | RVA vs. AAI | RVmIVS vs. RVA | RVOT vs. RVA | RVOT vs. RVmIVS | |
| Axis | ||||||||
| Median values (IQR) | 0° (−14 to 45) | −64° (−81 to −52) | 41° (−5 to 81) | 85° (68 to 103) | 0.003 | <0.001 | <0.001 | 0.01 |
| Normal axis, n (%) | 17 (77%) | 0 (0%) | 14 (64%) | 12 (54%) | n/m | 0.27 | n/m | 0.69 |
| LAD, n (%) | 4 (18%) | 19 (86%) | 2 (9%) | 0 (0%) | <0.001 | n/m | n/m | n/m |
| RAD, n (%) | 1 (4.5%) | 2 (9%) | 4 (18%) | 10 (46%) | 1.0 | 0.004 | 0.02 | 0.03 |
| QRS duration (ms) | ||||||||
| Mean± SD | 97 ± 22 | 154 ± 18 | 147 ± 14 | 136 ± 16 | <0.001 | <0.001 | <0.001 | <0.001 |
| Maximum | 149 | 190 | 178 | 162 | n/m | n/m | n/m | n/m |
| QRS >120 ms, n (%) | 4 (18%) | 22 (100%) | 21 (95%) | 21 (95%) | n/m | <0.001 | n/m | 1.0 |
AAI, baseline atrial pacing; IQR, interquartile range; LAD, left axis deviation; n/m, not measurable; RVA, right ventricular apex; RVmIVS, RV mid-inter-ventricular septum; RVOT, RV outflow tract; RAD, right axis deviation.
Both mean and maximum QRS duration increased with RV apical pacing in comparison with AAI pacing (Table 2). In comparison with RV apical pacing, the mean and maximum duration of paced QRS complexes shortened as the pacing position became more basal. The QRS duration of paced beats at the RV outflow tract was shorter than the QRS duration of paced beats originating from the RV mid-septum (Table 2).
Standard echocardiographic assessment
Left ventricular systolic function
At baseline, LV ejection fraction could be assessed using the Simpson's biplane method in 21 (of 22, 95%) cases. Using this technique, the LV ejection fraction was ≥50% in 17 patients and ≥46% in the remaining 4 patients. Left ventricular ejection fraction decreased with RV apical pacing in comparison with baseline. In contrast, pacing from the RV mid-septum or outflow tract increased LV ejection fraction when compared with RV apical pacing, such that it was similar to that observed in the AAI mode. The effects on LV volumes are shown in Table 3.
The Influence of pacing site on standard echocardiographic parameters
| Pacing site | P values | |||||||
|---|---|---|---|---|---|---|---|---|
| AAI | RVA | RV mIVS | RVOT | RVA vs. AAI | RVmIVS vs. RVA | RVOT vs. RVA | RVOT vs. RVmIVS | |
| LV systolic function | ||||||||
| LVEF (%), mean ±SD | 54 ± 6 | 48 ± 5 | 52 ± 5 | 54 ± 6 | 0.001 | 0.006 | 0.005 | 0.24 |
| LVESV (ml), mean± SD | 56 ± 20 | 56 ± 23 | 49 ± 23 | 49 ± 20 | 0.69 | 0.01 | 0.02 | 0.56 |
| LVEDV (ml), mean± SD | 122 ± 36 | 107 ± 35 | 101 ± 41 | 108 ± 42 | 0.01 | 0.20 | 0.72 | 0.10 |
| SV (mL), mean± SD | 68 ± 23 | 50 ± 11 | 54 ± 13 | 55 ± 12 | 0.004 | 0.02 | 0.01 | 0.39 |
| LV diastolic function | ||||||||
| DT (ms), mean± SD | n/a | 221 ± 95 | 209 ± 65 | 214 ± 74 | n/a | 0.94 | 0.94 | 0.65 |
| Ea (cm/s), mean ± SD | n/a | 3.98 ± 1.91 | 4.03 ± 1.56 | 4.57 ± 1.86 | n/a | 0.81 | 0.02 | 0.07 |
| Em (cm/s), mean ± SD | n/a | 3.54 ± 1.61 | 3.59 ± 1.36 | 4.17 ± 1.55 | n/a | 0.66 | 0.01 | 0.01 |
| E/A ratio, mean ± SD | n/a | 0.79 ± 0.25 | 0.85 ± 0.42 | 0.84 ± 0.37 | n/a | 0.61 | 0.86 | 0.94 |
| Myocardial performance index | ||||||||
| Tei index, mean ±SD | n/a | 0.63 ± 0.28 | 0.48 ± 0.16 | 0.46 ± 0.18 | n/a | 0.02 | 0.04 | 0.96 |
AAI, baseline atrial pacing; DT, E-wave deceleration time; E, trans-mitral early diastolic velocity; Ea, average early diastolic velocity for septal and lateral mitral annulus; Em, average early diastolic velocity for six basal LV segments; IQR: interquartile range; n/a, not assessable; LV, left ventricle; LVEF, LV ejection fraction; LVESV, LV end systolic volume; LVEDV, LV end diastolic volume; RVA, right ventricular apex; RV mIVS, RV mid-inter-ventricular septum; RVOT, RV outflow tract; SD, standard deviation; SV, stroke volume.
Left ventricular diastolic function
Diastolic function was assessed at all RV pacing sites (Table 3). Apart from increased early diastolic mitral annular and myocardial velocities during RV outflow tract pacing there were no significant differences in diastolic parameters (Table 3).
The myocardial performance index
Mid-septum and outflow tract pacing were associated with improved myocardial performance index in comparison with that observed with apical pacing (Table 3).
Dyssynchrony echocardiography
Inter-ventricular dyssynchrony
At baseline, IVMD ≥40 ms was present in one patient. Right ventricular apical pacing resulted in an increased IVMD in comparison with baseline (Table 4) and in five patients was ≥40 ms. When the RV was paced from the mid-septum or outflow tract, IVMD was reduced in comparison with that seen with apical RV pacing (Table 4). No patients paced at alternative RV sites developed IVMD ≥40 ms (Table 4).
Inter- and intra-ventricular dyssynchrony
| Pacing site | P values | ||||||||
|---|---|---|---|---|---|---|---|---|---|
| Cut-off values | AAI | RVA | RV mIVS | RVOT | RVA vs. AAI | RVmIVS vs. RVA | RVOT vs. RVA | RVOT vs. RVmIVS | |
| M mode echocardiography | |||||||||
| SPWMD (ms), mean ± SD | 84 ± 41 | 106 ± 55 | 100 ± 46 | 99 ± 44 | 0.04 | 0.21 | 0.50 | 0.84 | |
| PW Doppler | |||||||||
| IVMD (ms), mean ± SD | 3 ± 25 | 24 ± 25 | 9 ± 13 | 13 ± 10 | 0.005 | 0.03 | 0.04 | 0.47 | |
| Tissue Doppler imaging (TDI) | |||||||||
| Ts-S-L (ms), median (IQR) | 10 (6–26) | 16 (8–77) | 15 (9–51) | 13 (3– 35) | 0.003 | 0.47 | 0.01 | 0.19 | |
| Ts-12 (ms), median (IQR) | 60 (30–104) | 108 (55–142) | 54 (27–108) | 44 (29–95) | 0.009 | 0.005 | 0.001 | 0.65 | |
| Ts-SD (ms), median (IQR) | 18 (9–29) | 39 (16–54) | 15 (9–40) | 15 (9–36) | 0.001 | 0.01 | 0.002 | 0.32 | |
| Number of patients with dyssynchrony by published criteria according to pacing lead position | |||||||||
| M mode echocardiography | |||||||||
| SPWMD, n (%) | ≥130 ms28 | 3 (17%) | 6 (35%) | 4 (23%) | 4 (23%) | 0.37 | 0.69 | 0.69 | 1.0 |
| PW Doppler | |||||||||
| IVMD, n (%) | ≥40 ms22 | 1 (4%)0 | 5 (19%) | 0 (0%) | 0 (0%) | 0.22 | n/m | n/m | n/m |
| Tissue Doppler imaging | |||||||||
| Ts-S-L, n (%) | ≥60 ms28 | 2 (9%) | 8 (36%) | 5 (23%) | 2 (9%) | 0.03 | 0.45 | 0.03 | 0.37 |
| Ts-12, n (%) | ≥100 ms22 | 5 (23%) | 11 (50%) | 7 (32%) | 5 (23%) | 0.07 | 0.22 | 0.03 | 0.62 |
| Ts-SD, n (%) | 32.6 ms28 | 4 (18%) | 12 (54%) | 8 (36%) | 6 (27%) | 0.008 | 0.22 | 0.03 | 0.50 |
AAI, baseline atrial pacing; IQR, interquartile range; IVMD, inter-ventricular mechanical delay; n/m, not measurable; RVA, right ventricular apex; RV mIVS, RV mid-inter-ventricular septum; RVOT, RV outflow tract; SD, standard deviation; SPWMD, septal to posterior wall motion delay; Ts, time-to-peak systolic velocity; Ts-S-L, difference in Ts between basal septal and basal lateral LV segments; Ts-12, maximum difference in Ts amongst 12 LV segments (6 basal and 6 mid), Ts-SD: dyssynchrony index (SD for Ts in 12 LV segments).
Intra-ventricular dyssynchrony
M-mode analysis of SPWMD was not possible in six patients at baseline. Of the remaining patients, three exhibited SPWMD≥130 ms at baseline. Right ventricular apical pacing increased SPWMD (Table 4) and the number of patients with intra-ventricular dyssynchrony using this method increased to six. There was no difference in SPWMD between apical and other RV pacing sites.
Using TDI indices, intra-ventricular dyssynchrony was induced by RV apical pacing. In comparison with this site by pacing at either the mid-septum or RV outflow tract reduced pacing-induced dyssynchrony (Table 4). Of the two alternative RV pacing sites, outflow tract pacing more consistently reduced dyssynchrony when all the TDI parameters were reviewed (Table 4). The changes in dyssynchrony index (Ts-SD) for each patient for AAI to RV apical pacing and for RV apical to RV outflow tract pacing are illustrated in Figure 2.
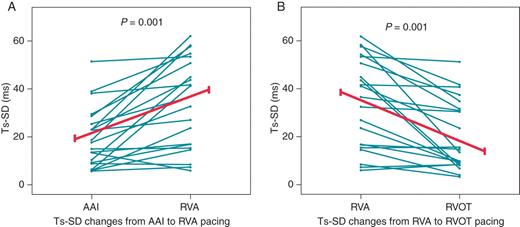
Trends in dyssynchrony index with pacing position. (A) Baseline AAI pacing vs. Right ventricular apical pacing. (B) Right ventricular apical pacing vs. Right ventricular outflow tract pacing. AAI: baseline atrial pacing, RVA: right ventricular apex, RVOT: RV outflow tract, Ts-SD dyssynchrony index: standard deviation for Ts in 12 LV segments.
Correlations between the ECG and echocardiographic findings
Figure 3 shows the relationships between ECG (QRS duration and axis) and echocardiography (LV ejection fraction, Ts-SD, and IVMD) parameters as calculated using univariate regression analysis. There was a positive correlation between QRS duration and dyssynchrony indices (IVMD and Ts-SD); these dyssynchrony indices also increased with increasingly negative QRS axis. Concomitant changes were seen in LV ejection fraction, which fell as QRS duration became wider and also as the QRS axis became more negative.
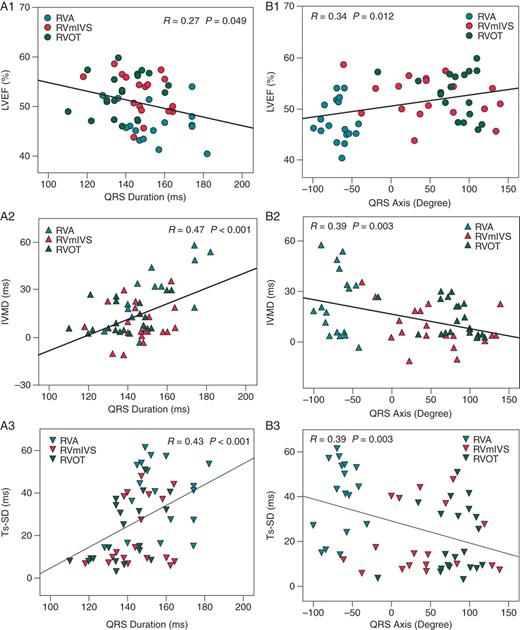
Scatter plots with linear regression analysis between ECG parameters and echocardiography indices. QRS duration vs. LVEF (left ventricular ejection fraction), IVMD (inter-ventricular mechanical delay), and Ts-SD (dyssynchrony index) are shown in A1, A2, and A3, respectively. QRS axis vs. LVEF, IVMD, and Ts-SD are shown in B1, B2, and B3, respectively. RVA, right ventricular apex; RV mIVS, RV mid-inter-ventricular septum; RVOT, RV outflow tract.
Inter- and intra-observer variability
In keeping with prior data,15 Bland–Altman analysis demonstrated a 1.8 ms bias between observers 1 and 2 for Ts-SD and 95% confidence intervals of ±16 ms. Bland–Altman analysis for intra-observer variation revealed a 0.9 ms bias for Ts-SD and 95% confidence intervals of ±11 ms.
Discussion
This paper consolidates and extends our understanding of how different RV pacing sites influence cardiac performance. It suggests that RV apical pacing has a deleterious effect on both traditional and novel echocardiographic indices of cardiac function. The results demonstrate that, in comparison with RV apical pacing, RV mid-septal or outflow tract pacing helps to preserve LV function and induces less mechanical dyssynchrony.
Right ventricular apical pacing
For many years it has been suspected that RV apical pacing reduces cardiac performance1 and although there is agreement that RV apical pacing is sub-optimal2,3,5 there is little consensus concerning the severity of cardiac impairment that is induced. In the current cohort, apical pacing significantly reduced mean LV ejection fraction. Our results are comparable with other studies that have found a reduction in LV systolic function with RV apical pacing.7 The reduction in LV ejection fraction was associated with evidence of increased intra- and inter-ventricular dyssynchrony by all measures used. The induction of LV dyssynchrony was associated with a broad left bundle branch block QRS pattern on the ECG, typical of RV apical pacing.
Pacing at other positions in the right ventricular
The alternative RV sites examined in this study were the mid-septum and out-flow tract. Pacing from these positions was associated with an increase in stroke volume and ejection fraction when compared with RV apical pacing. Similarly, in comparison with apical pacing, RV mid-septum and outflow tract pacing induced less dyssynchrony and was associated with a narrower QRS complex.
When comparing the mid-septum vs. outflow tract pacing, no differences were detected in cardiac function using traditional markers of cardiac performance (Table 3). The mean QRS duration during outflow tract vs. mid-septal pacing was narrower however and dyssynchrony indices were more consistently improved by outflow tract pacing. The clinical significance of these changes is unclear. It is, however, conceivable that these subtle mechanical and electrical differences could become important if maintained over the long term.
Improvements in cardiac performance from alternative site pacing are thought to occur as a result of Purkinje fibre recruitment. Impulse conduction using Purkinje fibres would promote depolarization in a more physiological fashion through the rapid conduction and diffuse arborization of these specialized muscle fibres.1 Furthermore, it is proposed that alternative site pacing may assist inter- and intra-ventricular conduction by recruitment of circumferentially orientated myocardial fibers.1 In support of these hypotheses this study found that during pacing from the RV mid-septum or outflow tract the QRS complexes became narrower, reflecting a reduction in electrical delay.
Fluoroscopic and ECG guided right ventricular lead positioning
In contrast to prior studies,17,30 we randomized the sequence of lead placement. This avoids any possible systematic bias due to the potential adverse effects of even very short-term pacing. Likewise, again in contrast to most prior work,31 we did not rely on any one single measure, but instead measured a range of important components of LV performance.
The other main feature that differentiates this from previous studies17,32 is the use of both fluoroscopic guidance and the surface ECG to ensure consistent lead positioning. A combined technique was used since the placement of pacing leads under fluoroscopic guidance alone has previously proven to be imprecise.1 Variations in lead positioning may, at least partly, explain inconsistencies in alternative pacing-site outcome data.24
Others have also noted a concordance between QRS width and basal RV pacing positions24,33—yet surface 12-lead ECGs are not routinely used in clinical practice to help position RV leads. Our data suggest that attention to the QRS duration and the cardiac axis at the time of implant may help to optimize lead placement if an alternative, non-apical, RV pacing site is being sought.
Limitations
This study examined the acute effects of pacing on cardiac performance and did not consider the long-term effects of pacing from alternative sites. We are unable to comment therefore on whether the changes observed would be maintained or become progressive. Although previous studies have indicated that the impact of acute pacing on cardiac function can predict the chronic effects of pacing,18 the lack of consistency in other long-term outcome data3,33–35 makes it difficult to extrapolate our findings. Large-scale randomized trials are currently in progress to address the clinical benefits of alternative pacing sites.
Clinical implications and conclusions
The current study supports the widely held belief that RV apical pacing, while simple and effective, is associated with detrimental effects on LV systolic function and synchrony. It suggests that any deleterious impact of pacing on cardiac function and synchrony can be minimized by selecting a pacing site in the RV mid-septum or outflow tract. This may be particularly important in patients at high risk of pacing-induced heart failure. In these circumstances, implanting clinicians can use simple fluoroscopic and ECG markers to optimize lead placement.
Conflict of interest: Medtronic UK supplied the temporary pacing catheters free of charge. The authors have no other sources of conflict with these data.
Funding
This work is supported by Chest Heart and Stroke Scotland, Edinburgh, Scotland, UK (grant: Res06.A96).
