


Abstract
The beneficial effects of exercise on reducing the risk of cardiovascular disease are established. However, the potential interaction between genetic risk for type 2 diabetes and physical activity on cardiovascular outcomes remains elusive. We aimed to investigate the effect of type 2 diabetes genetic risk–physical activity interaction on cardiovascular outcomes in individuals with diabetes.
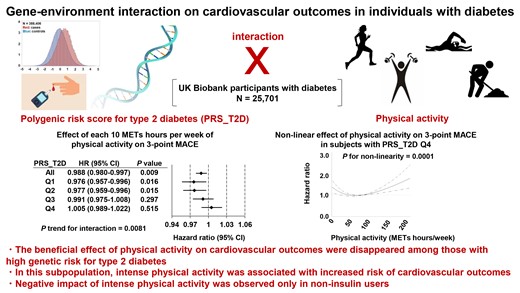
Using the UK Biobank cohort, we investigated the effect of type 2 diabetes genetic risk–physical activity interaction on three-point and four-point major adverse cardiovascular events (MACE), in 25 701 diabetic participants. We used a polygenic risk score for type 2 diabetes (PRS_T2D) as a measure of genetic risk for type 2 diabetes. We observed a significant interaction between PRS_T2D and physical activity on cardiovascular outcomes (three-point MACE: P trend for interaction = 0.0081; four-point MACE: P trend for interaction = 0.0037). Among participants whose PRS_T2D was in the first or second quartile, but not in the third or fourth quartile, each 10 metabolic equivalents (METs) hours per week of physical activity decreased the risk of three-point or four-point MACE. Furthermore, restricted cubic spline analysis indicated that intense physical activity (>80 METs hours per week, which was self-reported by 12.7% of participants) increased the risk of cardiovascular outcomes among participants whose PRS_T2D was in the fourth quartile. Sub-group analysis suggested that negative impact of intense physical activity was observed only in non-insulin users.
The beneficial effect of physical activity on cardiovascular outcomes disappeared among those with high genetic risk for type 2 diabetes.
Lay Summary
The beneficial effects of exercise on reducing the risk of cardiovascular disease are established. However, whether genetic risk for type 2 diabetes influences the effect of physical activity on cardiovascular outcomes in individuals with diabetes remains elusive. We aimed to investigate interaction between genetic risk for type 2 diabetes and physical activity on major adverse cardiovascular events (MACE) in individuals with diabetes.
The beneficial effect of physical activity on cardiovascular outcomes disappeared among diabetic individuals with high genetic risk for type 2 diabetes, due to significant gene–environment interaction; in this subpopulation, intense physical activity was associated with increased risk of cardiovascular outcomes.
Personalized exercise recommendations tailored to avoid excessively intense exercise, in combination with genetic screening of high-risk individuals, would be required.
See the editorial comment for this article ‘Variable effect of exercise training programme on cardiovascular outcomes in high-geneticrisk individuals with diabetes’, by A.E. Berezin, https://doi.org/10.1093/eurjpc/zwae106.
Introduction
Diabetes affects more than 500 million people globally and predisposes individuals to cardiovascular disease, a leading cause of mortality.1–4 Although much progress has been made in the management of diabetes over the last decade, patients with type 2 diabetes still have a significantly increased risk of cardiovascular mortality compared with non-diabetic individuals.5,6 Obesity, which often precedes type 2 diabetes, is also endemic globally.7 Lifestyle-related diseases, including type 2 diabetes and obesity, develop as a result of genetic susceptibility, environmental factors like exercise and diet, and their interaction. The beneficial effects of exercise on reducing the risk of developing obesity,8 type 2 diabetes,9 and cardiovascular disease10 are established. Moreover, physical activity attenuates the body mass index (BMI)-increasing effect of the fat mass and obesity-associated (FTO) obesity variant11 on cross-sectional BMI12 as well as changes in BMI over time.13 Furthermore, physical activity has been shown to weaken the association between BMI and a genetic risk score for obesity.14 The effects of the interaction between genetic risk for type 2 diabetes and lifestyle factors on the incidence of diabetes have also been investigated.15,16
However, less is known about either the effect of type 2 diabetes genetic risk on cardiovascular disease or the potential interaction between such genetic risk and lifestyle factors. Recently, an association between increased genetic risk for type 2 diabetes and increased risk of cardiovascular complications has been reported.17 Favourable lifestyle factors (composite of smoking status, BMI, physical activity, and eating habits) were found to reduce the risk of cardiovascular complications regardless of genetic risk for type 2 diabetes, without evidence of significant gene–environment interaction effect. However, most of the study participants (96.5% of 345 217 total participants) consisted of individuals without diabetes. Thus, the potential effect of type 2 diabetes genetic risk–physical activity interaction on cardiovascular outcomes in individuals with diabetes remains elusive. Here, we investigated the effect of interaction between genetic risk for type 2 diabetes and physical activity on cardiovascular outcomes in participants with diabetes, by using the UK Biobank cohort.
Methods
The UK biobank
This study has been approved by the UK Biobank (approved research ID 78912), and the National Health Service (NHS) North West Multi-centre Research Ethics Committee approved the UK biobank. The UK Biobank is a prospective cohort from the general population in the United Kingdom who were between the ages of 40 and 69 years old at recruitment, from 2006 to 2010.18 At recruitment, all participants provided written informed consent. Participants provided lifestyle and health-related information via baseline questionnaires, interviews, and physical measurements. Genotypes and biomarkers were also obtained, and health-related outcomes were obtained via linkage to the NHS.
Polygenic risk score
A polygenic risk score (PRS) for type 2 diabetes (PRS_T2D) available from the UK Biobank19 (Data-Field 26285) was used as a measure of genetic risk for type 2 diabetes. To construct PRS_T2D, a modified version of the LDpred algorithm20 was applied to meta-analysed summary statistics from genome-wide association studies performed outside the UK Biobank.
Physical activity
Previously reported summed metabolic equivalents (MET) minutes per week for all activity.21 Data-Field 22040 was converted to MET hours per week for use in this study.
Ascertainment of disease prevalence and incidence
The primary outcomes for this work were the incidence of a three-point major adverse cardiovascular event (MACE) (composite of cardiovascular death, non-fatal myocardial infarction, and non-fatal stroke) or four-point MACE (composite of cardiovascular death, non-fatal myocardial infarction, non-fatal stroke, and heart failure requiring hospitalization) after enrolment. We used algorithmically defined outcomes, which were constructed via combinations of information derived from data collected at baseline assessment (self-reported medical conditions) as well as data from hospital admissions (diagnoses and procedures) and death registries. Data-Field 42000 and 42006 were used to define non-fatal myocardial infarction and non-fatal stroke, respectively. Resource 138483 (Hospital Episode Statistics) was analysed to ascertain data pertaining to heart failure requiring hospitalization, using ICD10 code I50.9 to define heart failure. Data-Field 40001 (Underlying cause of death: ICD10) was analysed to obtain mortality data.
Statistical analysis
Continuous and categorical variables were presented as mean ± SD and exact number followed by percentage, respectively. Differences in clinical variables across participants in different PRS_T2D quartiles were assessed by the chi-square test for categorical variables and by analysis of variance (ANOVA) for continuous variables.
To assess the effects of PRS_T2D on the prevalence of diabetes, the Kaplan–Meier method was used to compare time to diagnosis of diabetes across different PRS-T2D quartiles. To assess the effects of PRS_T2D on the incidence of diabetes, a logistic regression analysis was conducted for non-diabetic participants to compare the risk of new-onset diabetes during the follow-up period across PRS-T2D quartiles. Of note, we did not use Cox regression analysis because the exact time of incidence was unavailable. Instead, we used logistic regression analysis while adjusting for duration from baseline to follow-up. To evaluate the effect of PRS_T2D and physical activity on three-point or four-point MACE, a Cox proportional hazards model were used. Interaction between PRS_T2D and physical activity was also tested. To explore possible non-linear effects of physical activity on three-point or four-point MACE, restricted cubic splines with Cox proportional hazards model was used. When indicated, analyses were adjusted for age, sex, BMI, haemoglobin A1c (HbA1c), duration from baseline to follow-up, duration of diabetes, and medication use. Medication codes (derived from Data-Field 2000322) are shown in Supplementary material online, Table S1. All analyses were conducted using SAS statistical software, version 9.4. P < 0.05 was considered statistically significant.
Results
Characteristics of the participants
Of 502 412 participants included in the UK Biobank cohort, 114 006 individuals were excluded because of missing data on glycemic traits, physical activity, or PRS_T2D.19 The remaining 388 406 individuals were classified as non-diabetic (n = 361 696) or diabetic (n = 26 710) on the basis of glycemic traits at baseline and/or a previous diagnosis of diabetes. For 14 180 of the non-diabetic participants, data on glycemic traits at the follow-up visit were also available. Of the 26 710 diabetic participants, 1009 were excluded due to diagnosis at less than 18 years of age or missing data on age at diagnosis, leaving 25 701 diabetic participants for inclusion in the main analysis (see Supplementary material online, Figure S1). Baseline characteristics of these participants are shown in Table 1.
Baseline characteristics of diabetic participants at baseline, aged ≥18 years at diagnosis (N = 25 701)
| Overall | PRS_T2D Q1 | PRS_T2D Q2 | PRS_T2D Q3 | PRS_T2D Q4 | P value | |
|---|---|---|---|---|---|---|
| Total, no. | 25 701 | 6425 | 6425 | 6425 | 6426 | |
| Age, mean ± SD, y | 59.81 ± 7.23 | 60.10 ± 7.21 | 60.03 ± 7.15 | 59.82 ± 7.18 | 59.29 ± 7.35 | <0.0001 |
| Male, no. (%) | 15 549 (60.50) | 3764 (58.58) | 3947 (61.43) | 3950 (61.48) | 3888 (60.50) | |
| BMI, mean ± SD | 30.83 ± 5.79 | 30.25 ± 6.02 | 31.02 ± 5.84 | 31.13 ± 5.77 | 30.93 ± 5.48 | <0.0001 |
| Systolic blood pressure, mean ± SD, mmHg | 143.95 ± 19.04 | 143.69 ± 19.67 | 143.92 ± 18.9 | 143.93 ± 18.74 | 144.25 ± 18.85 | 0.4424 |
| Diastolic blood pressure, mean ± SD, mmHg | 82.30 ± 10.65 | 81.97 ± 10.84 | 82.37 ± 10.57 | 82.50 ± 10.61 | 82.34 ± 10.57 | 0.0412 |
| Total cholesterol, mean ± SD, mg/dL | 186.91 ± 47.07 | 190.96 ± 48.20 | 187.85 ± 47.17 | 185.54 ± 46.63 | 183.27 ± 45.90 | <0.0001 |
| HDL cholesterol, mean ± SD, mg/dL | 47.76 ± 13.42 | 50.26 ± 14.99 | 47.83 ± 13.53 | 46.80 ± 12.7 | 46.09 ± 11.83 | <0.0001 |
| LDL cholesterol, mean ± SD, mg/dL | 113.80 ± 34.8 | 115.94 ± 35.59 | 114.41 ± 34.66 | 113.12 ± 34.62 | 111.71 ± 34.19 | <0.0001 |
| Triglycerides, mean ± SD, mg/dL | 193.53 ± 114.09 | 182.71 ± 113.71 | 195.6 ± 113.68 | 198.00 ± 115.10 | 197.89 ± 113.19 | <0.0001 |
| Glucose, mean ± SD, mg/dL | 137.35 ± 56.69 | 135.13 ± 54.44 | 136.00 ± 55.00 | 138.15 ± 57.39 | 140.19 ± 59.74 | <0.0001 |
| HbA1C, mean ± SD, % | 6.80 ± 1.3 | 6.59 ± 1.27 | 6.75 ± 1.28 | 6.86 ± 1.31 | 7.00 ± 1.30 | <0.0001 |
| duration since diabetes diagnosis, mean ± SD, y | 5.38 ± 7.18 | 4.98 ± 7.69 | 5.11 ± 7.00 | 5.34 ± 6.90 | 6.09 ± 7.03 | <0.0001 |
| METs hours/week, mean ± SD | 37.8 ± 42.9 | 37.2 ± 42.0 | 37.4 ± 42.8 | 38.2 ± 43.7 | 38.7 ± 42.9 | 0.1611 |
| Subjects with >80 METs hours/week (%) | 2033 (14.34) | 519 (14.64) | 527 (14.87) | 485 (13.68) | 502 (14.16) | 0.4929 |
| Metformin use, no. (%) | 10 443 (40.63) | 1973 (30.71) | 2506 (39.00) | 2818 (43.86) | 3146 (48.96) | <0.0001 |
| Sulfonylurea use, no. (%) | 4085 (15.89) | 729 (11.35) | 962 (14.97) | 1079 (16.79) | 1315 (20.46) | <0.0001 |
| TZD use, no. (%) | 1694 (6.59) | 268 (4.17) | 385 (5.99) | 457 (7.11) | 584 (9.09) | <0.0001 |
| Insulin use, no. (%) | 3414 (13.28) | 877 (13.65) | 766 (11.92) | 819 (12.75) | 952 (14.81) | <0.0001 |
| Statin use, no. (%) | 15 081 (58.68) | 3398 (52.89) | 3742 (58.24) | 3873 (60.28) | 4068 (63.31) | <0.0001 |
| History of non-fatal myocardial infarction, no. (%) | 1951 (7.59) | 441 (6.86) | 502 (7.81) | 502 (7.81) | 506 (7.87) | 0.0903 |
| History of non-fatal stroke, no. (%) | 900 (3.50) | 240 (3.74) | 229 (3.56) | 214 (3.33) | 217 (3.38) | 0.5798 |
| Cardiovascular death after enrolment, no. (%) | 1094 (4.26) | 262 (4.08) | 285 (4.44) | 287 (4.47) | 260 (4.05) | 0.4924 |
| Non-fatal myocardial infarction after enrolment, no. (%) | 1722 (6.70) | 415 (6.46) | 426 (6.63) | 433 (6.74) | 448 (6.97) | 0.7007 |
| Non-fatal stroke after enrolment, no. (%) | 1059 (4.12) | 252 (3.92) | 260 (4.05) | 266 (4.14) | 281 (4.37) | 0.6214 |
| Heart failure hospitalization after enrolment, no. (%) | 971 (3.78) | 238 (3.70) | 247 (3.84) | 243 (3.78) | 243 (3.78) | 0.9816 |
TZD, thiazolidine.
Effect of genetic risk for type 2 diabetes on the prevalence and incidence of diabetes
We first examined whether PRS_T2D was associated with the prevalence and incidence of diabetes. As expected, the distribution of PRS_T2D was right-shifted among diabetic participants compared to non-diabetic participants (n = 388,406, Figure 1A). Consistently, the top 3% of participants with the highest PRS_T2D showed a higher prevalence of type 2 diabetes across all ages compared with those with intermediate genetic risk (40–60% on the distribution of PRS_T2D), and the bottom 3% of participants with the lowest PRS_T2D showed the opposite pattern (Figure 1B, P < 0.0001 by log-rank test). We next evaluated the effect of PRS_T2D on the incidence of diabetes during the follow-up period among those without diabetes at baseline (n = 14,180, Supplementary material online, Table S2). During a mean follow-up of 4.28 years [95% confidence interval (CI), 3.41–5.15], 300 participants (2.12%) developed diabetes. After adjusting for age, sex, and duration from baseline to follow-up, significantly increased risk of developing diabetes was observed among participants in higher quartile of PRS_T2D (Figure 1C). Compared with participants with PRS_T2D in the first quartile, those with PRS_T2D in the second quartile had a 2.37-fold higher risk of developing type 2 diabetes during the follow-up period [hazard ratio (HR), 2.37; 95% CI, 1.53–3.67; P = 1.2 × 10⁻⁴]. Similarly, participants with PRS_T2D in the third or fourth quartiles had a 3.05-fold and 4.38-fold higher risk of developing type 2 diabetes, respectively (quartile 3: HR, 3.05; 95% CI, 2.00–4.67; P = 2.6 × 10⁻⁷; quartile 4: HR, 4.38; 95% CI, 2.91–6.59; P = 1.5 × 10⁻¹²). These results indicate that the PRS_T2D successfully predicted the prevalence and incidence of diabetes in the UK Biobank cohort, providing a rationale for using the PRS_T2D as a measure of genetic risk for type 2 diabetes in subsequent analyses.
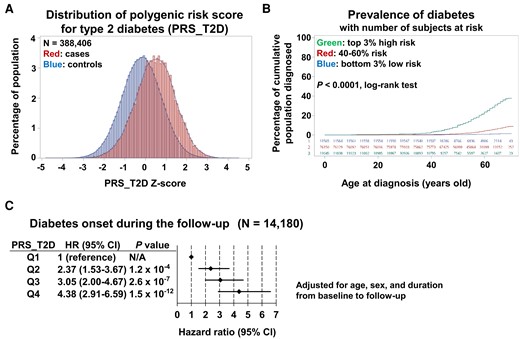
Effect of polygenic risk for type 2 diabetes on the prevalence and incidence of diabetes. (A) Distribution of polygenic risk score for type 2 diabetes for participants with diabetes (cases) and those without diabetes (controls). (B) Relationship between age and prevalence of diabetes among participants with the top 3% highest polygenic risk score for type 2 diabetes (top), those with intermediate polygenic risk score for type 2 diabetes (40–60%, middle), and those with the bottom 3% lowest polygenic risk score for type 2 diabetes (bottom). (C) Effect of polygenic risk score for type 2 diabetes on the hazard ratio for onset of diabetes during the follow-up period for participants without diabetes at baseline. Adjusted for age, sex, and duration from baseline to follow-up.
Effect of genetic risk for type 2 diabetes on cardiovascular outcomes
We next evaluated the effect of PRS_T2D on cardiovascular events among participants with and without diabetes. Among 361 696 participants who were non-diabetic at baseline, 7040 (1.95%) had a history of non-fatal myocardial infarction, and 4560 (1.26%) had a history of non-fatal stroke (see Supplementary material online, Table S3). Among 25 701 diabetic participants at baseline aged ≥18 years at diagnosis, 1951 (7.59%) had a history of non-fatal myocardial infarction and 900 (3.5%) had a non-fatal stroke (Table 1). The analyses were adjusted for age, sex, BMI, and duration of diabetes (for participants with diabetes).
Analysis of the effect of PRS_T2D on three-point MACE among participants without diabetes at baseline demonstrated a clear trend towards higher quartiles of PRS_T2D being associated with higher incidences of cardiovascular outcomes (see Supplementary material online, Figure S2A). Participants with PRS_T2D in the fourth quartile had a 11% higher incidence of three-point MACE compared with those with PRS_T2D in the first quartile (HR, 1.11; 95% CI, 1.06–1.15; P = 1.6 × 10⁻⁶). Similarly, participants with PRS_T2D in the fourth quartile had an 9% higher incidence of four-point MACE compared with those with PRS_T2D in the first quartile (HR, 1.09; 95% CI, 1.05–1.14; P = 8.7 × 10⁻⁶) (see Supplementary material online, Figure S2B). Intriguingly, we observed a different pattern of association between PRS_T2D and cardiovascular outcomes among participants with diabetes. In this latter group, having a higher PRS_T2D was not associated with a high incidence of three-point MACE or four-point MACE (see Supplementary material online, Figure S2C and D). This finding was not affected by adjusting for medication use (see Supplementary material online, Figure S2E and F). These results suggest that the effect of genetic risk for type 2 diabetes on cardiovascular outcomes is affected by glycemic control status.
Type 2 diabetes polygenic risk–physical activity interaction on cardiovascular outcomes in participants with diabetes
To address whether PRS_T2D influences the effect of physical activity on cardiovascular outcomes in individuals with diabetes, we next looked at the possible PRS_T2D–physical activity interaction. The analyses were adjusted for age, sex, BMI, HbA1c, duration of diabetes, and use of insulin, sulfonylurea, metformin, thiazolidine, or statin. Overall, each 10 METs hours per week of physical activity significantly decreased the HR for three-point MACE by 1.2% (Figure 2A; HR, 0.988; 95%CI, 0.980–0.997, P = 0.009). Among participants whose PRS_T2D was in the first or second quartile, each 10 METs hours per week of physical activity decreased the risk of three-point MACE by 2.4% or 2.3%, respectively (quartile 1: HR, 0.976; 95%CI, 0.957–0.996, P = 0.016; quartile 2: HR, 0.977; 95%CI, 0.959–0.996, P = 0.015). However, the beneficial effect of physical activity on three-point MACE disappeared among those with PRS_T2D in the third quartile (HR, 0.991; 95%CI, 0.975–1.008, P = 0.297). Among participants with PRS_T2D in the fourth quartile, each 10 METs hours per week of physical activity nominally increased the HR for three-point MACE (HR, 1.005; 95%CI, 0.989–1.022, P = 0.515). Collectively, there was significant interaction between PRS_T2D and physical activity on three-point MACE (Figure 2A; P for interaction = 0.0503; P trend for interaction = 0.0081). We observed similar pattern for four-point MACE. Overall, each 10 METs hours per week of physical activity significantly decreased the risk of four-point MACE by 1.2% (HR, 0.988; 95%CI, 0.980–0.996; P = 0.003). Among participants whose PRS_T2D was in the first or second quartile, each 10 METs hours per week of physical activity significantly decreased the risk of four-point MACE by 2.7% or 2.1%, respectively. However, the beneficial effect of physical activity disappeared among participants with PRS_T2D in the third or fourth quartile. Again, we found significant PRS_T2D-physical activity interaction on four-point MACE (Figure 2B; P for interaction = 0.0314; P trend for interaction = 0.0037). The interaction was observed even in the absence of adjustment for medication use for both three-point MACE and four-point MACE, suggesting the robustness of this finding (see Supplementary material online, Figure S3). Also, the interaction was not affected by adjusting for previous history of cardiovascular event, possibly suggesting that the interaction matters both for primary and secondary prevention (see Supplementary material online, Figure S4). When we performed sub-group analysis separately looking at non-insulin users and insulin users (see Supplementary material online, Figure S5), interaction effect seemed to be weaker in insulin users. Also, the beneficial effect of physical activity on MACE was stronger in insulin users and each 10 METs hours per week of physical activity remained nominally protective even among participants with PRS_T2D in the fourth quartile. Intriguingly, we found that each 10 METs hours per week of physical activity decreased overall mortality regardless of PRS_T2D; an interaction effect was not observed (see Supplementary material online, Figure S6A; P for interaction = 0.57; P trend for interaction = 0.91), suggesting that the observed interaction effect was specific for cardiovascular complications. This finding also was not affected by adjusting for medication use (see Supplementary material online, Figure S6B).
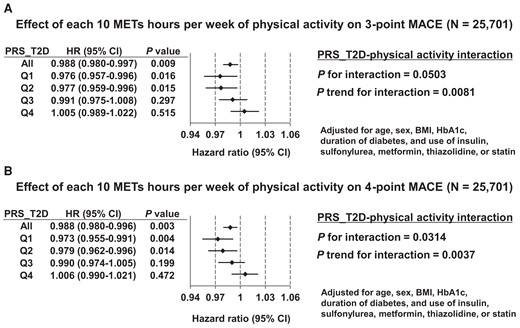
Effect of type 2 diabetes polygenic risk–physical activity interaction on cardiovascular outcomes in participants with diabetes. (A) Effect of each 10 metabolic equivalents hours per week of physical activity on the hazard ratio for three-point major adverse cardiovascular events among participants with diabetes, by quartile of polygenic risk score for type 2 diabetes. Adjusted for age, sex, body mass index, haemoglobin A1c, duration of diabetes, and use of insulin, sulfonylurea, metformin, thiazolidine, or statin. (B) Effect of each 10 metabolic equivalents hours per week of physical activity on the hazard ratio for four-point major adverse cardiovascular events among participants with diabetes, by quartile of polygenic risk score for type 2 diabetes. Adjusted for age, sex, body mass index, haemoglobin A1c, duration of diabetes, and use of insulin, sulfonylurea, metformin, thiazolidine, or statin.
Dose-dependent effect of physical activity on cardiovascular outcomes among participants with diabetes, stratified by genetic risk for type 2 diabetes
To gain further insight into the effect of the observed PRS_T2D-physical activity interaction, we performed a restricted cubic spline analysis of physical activity intensity and cardiovascular outcomes among participants with diabetes (n = 25 701), to reveal any possible dose-dependent effect of physical activity. Indeed, we observed a non-linear relationship between intensity of physical activity and HRs for either three-point MACE or four-point MACE (P for non-linearity < 0.001, Figure 3A and B). For both of these outcomes, up to ∼80 METs hours per week of physical activity significantly reduced the risk of cardiovascular outcomes. However, intense physical activity (>80 METs hours per week) tended to increase the risk of three-point or four-point MACE, although the effect was not statistically significant. Furthermore, a sub-group analysis stratified by quartile of PRS_T2D demonstrated a complex pattern of interaction between PRS_T2D and physical activity. Among participants whose PRS_T2D was in the first or second quartile, up to 80 METs hours per week of physical activity had significant beneficial effect on three-point MACE, whereas intense physical activity had neither beneficial or harmful effect. Among participants with PRS_T2D in the third quartile, neither beneficial nor harmful effect of physical activity was observed, regardless of its intensity. Strikingly, among those with PRS_T2D in the fourth quartile, while up to 80 METs hours per week of physical activity had a beneficial effect on three-point MACE, intense physical activity significantly increased the risk of three-point MACE (Figure 3C). A very similar pattern of relationship was observed also for four-point MACE. Among those with PRS_T2D in the fourth quartile, but not among those with PRS in quartiles 1–3, intense physical activity significantly increased the risk of four-point MACE (Figure 3D). Notably, intense physical activity more than 80 METs hours per week was reported in only 12.7% of participants (n = 3,259, Supplementary material online, Figure S7), suggesting that physical activity may have a harmful effect on cardiovascular outcomes only in a limited population. The proportion of participants who reported more than 80 METs hours per week of physical activity did not differ across quartiles of PRS_T2D (Table 1). Similar to the PRS_T2D-physical activity interaction analysis, the dose-dependent effect of physical activity on cardiovascular outcomes was not affected by adjusting for previous history of cardiovascular event (see Supplementary material online, Figure S8). We also separately looked at the dose-dependent effect of physical activity on cardiovascular outcomes among non-insulin users (see Supplementary material online, Figure S9) and insulin users (see Supplementary material online, Figure S10). Intriguingly, the negative impact of intense physical activity among participants with PRS_T2D Q4 was observed in non-insulin users, but not in insulin users. Altogether, these results indicate the complex dose-dependent effect of physical activity on cardiovascular outcomes, with intense physical activity increasing the risk of cardiovascular outcomes among those with high genetic risk for type 2 diabetes.
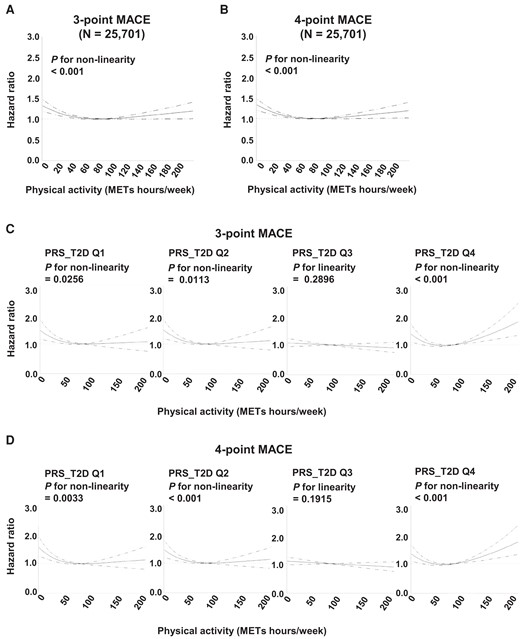
Dose-dependent effect of physical activity on cardiovascular outcomes among participants, stratified by genetic risk for type 2 diabetes. (A and B) Restricted cubic spline analysis of physical activity (metabolic equivalents hours per week) and the hazard ratio for three-point major adverse cardiovascular events (A) or four-point major adverse cardiovascular events (B) among participants with diabetes. Dashed lines indicate 95% confidence interval. (C and D) Restricted cubic spline analysis of physical activity (metabolic equivalents hours per week) and the hazard ratio for three-point major adverse cardiovascular events (C) or four-point major adverse cardiovascular events (D) by quartile of polygenic risk score for type 2 diabetes. Dashed lines indicate 95% confidence interval.
Discussion
In this study, we investigated the effects of genetic risk for type 2 diabetes, physical activity, and their interaction on cardiovascular outcomes in individuals with diabetes using the UK Biobank cohort. We observed a significant interaction between type 2 diabetes genetic risk and physical activity in the effect on cardiovascular outcomes.
The effect of genetic risk for type 2 diabetes on cardiovascular outcomes was influenced by glycemic control. Having a higher genetic risk for type 2 diabetes increased the risk of three-point or four-point MACE among participants without diabetes, which is consistent with a previous report.17 On the other hand, having a higher genetic risk for type 2 diabetes was not associated with an increased risk of three-point or four-point MACE among participants with diabetes. A possible explanation for this finding might involve survival bias; it may be possible that a substantial proportion of individuals with higher PRS_T2D had already developed diabetes and died from cardiovascular complications before enrolment. Although our analysis adjusted for medication use, it is still possible that participants with diabetes and high genetic risk for type 2 diabetes gained benefit from diabetes therapeutics, such as metformin or thiazolidine, which possess protective effect against cardiovascular disease.23,24 It is unlikely that they gained benefit from sodium-glucose cotransporter-2 (SGLT2) inhibitors or glucagon-like peptide-1 (GLP-1) receptor agonist, since these therapeutics were not available in most, if not all, of the follow-up period.
To our knowledge, this study is the first to investigate the dose-dependent effect of physical activity, in interaction with genetic risk for type 2 diabetes, on cardiovascular outcomes. We observed that intense physical activity (>80 METs hours per week) increased the risk of cardiovascular outcomes among individuals with high genetic risk for type 2 diabetes. However, this level of intense physical activity was reported in only 12.7% of participants, and median amount of physical activity was around 20 METs hours per week. Therefore, guideline-recommended 7.5 METs hours per week of exercise (which corresponds to 150 min per week moderate-intensity exercise) for the prevention of cardiovascular disease25,26 is reasonable for many cases. Notably, amount of physical activity analysed here includes all activity such as labour, and not limited to exercise. Intriguingly, it has been reported that intense exercise can lead to sympathetic overactivity,27,28 which is associated with increased risk of cardiovascular disease.29 Among participants with diabetes and having PRS_T2D in the fourth quartile, more than 80 METs hours per week of physical activity increased the risk of three-point and four-point MACE, possibly via sympathetic overactivity. Also, intense physical activity might increase glycemic variability, and increase the risk of complications independent of mean blood glucose control. Metabolic memory phenomenon and concomitant age-related diseases and complications, including but not limited to metabolic dysfunction-associated steatotic liver disease (MASLD) and diabetic kidney disease, might also be involved. However, mechanism(s) that these and other factors contributed to negative impact of intense physical activity on MACE only among those with high genetic risk for type 2 diabetes remains elusive. Sub-group analysis suggested that negative impact of intense physical activity was observed only in non-insulin users but not in insulin users, potentially highlighting unappreciated beneficial effect of insulin treatment. A replication study using an independent cohort will be required for further validation of our finding. In this study, physical activity was quantified based on self-reported questionaries and thus potentially affected by recall bias; a study using objective measurements of physical activity via accelerometer could overcome this limitation.30 We propose that future studies should also assess the type of exercise (endurance vs. resistance). Additionally, using leave-one-out sensitivity analyses to explore the causal variant(s) underlying the observed interaction between genetic risk for type 2 diabetes and physical activity would be an attractive direction for future study.
In conclusion, here we observed that the beneficial effect of physical activity on cardiovascular outcomes disappeared for participants with diabetes and high genetic risk for type 2 diabetes; in this subpopulation, intense physical activity was associated with increased risk of cardiovascular outcomes. Promoting physical activity and reducing sedentary behaviour should be encouraged in many cases. However, personalized exercise recommendations tailored to avoid excessively intense exercise, in combination with genetic screening of high-risk individuals, will compose a precision-medicine approach to the management of type 2 diabetes and cardiovascular complications.
Supplementary material
Supplementary material is available at European Journal of Preventive Cardiology.
Acknowledgements
The authors would like to thank the participants of the UK Biobank for their dedication and contribution.
Author contribution
Y.H., T.Y., and C.L.L. designed the study. C.L.L. and W.J.L. performed formal statistical analysis. Y.H., C.L.L., T.Y., W.J.L., K.H., and S.Y. contributed to interpretation of the results. Y.H. wrote the manuscript with inputs from all authors. All authors reviewed and approved the final version of the manuscript.
Funding
This work is funded by a research grant from the University of Tokyo Excellent Young Researcher Program to Y.H.; by Japan Society for the Promotion of Science (JSPS) KAKENHI Grant-in-Aid for Early-Career Scientists, grant numbers 19K17976 and 23K15387 to Y.H.; by a grant for Front Runner of Future Diabetes Research from the Japan Foundation for Applied Enzymology, grant number 17F005 to Y.H.; by a Life Science Research grant from Takeda Science Foundation to Y.H.; by a grant from SENSHIN Medical Research Foundation to Y.H.; by a grant from Public Health Research Foundation to Y.H.; by a grant from Mishima Kaiun Memorial Foundation to Y.H.; by a grant from Japan Health Foundation to Y.H.; by a grant from Kao Research Council for the Study of Healthcare Science to Y.H.; by a grant from Health Care Science Institute to Y.H.; by a grant from TANITA Healthy Weight Community Trust to Y.H.; by a grant from MSD Life Science Foundation to Y.H.; by a Kishimoto Foundation Research grant from Senri Life Science Foundation to Y.H.; by a JSPS KAKENHI Grant-in-Aid for Early-Career Scientists, grant number 19K19432 to T.Y.; by a JSPS KAKENHI Fund for the Promotion of Joint International Research (A), grant number 21KK0293 to T.Y.; by a Danone Research Grant from the Danone Institute of Japan Foundation to T.Y.; by a grant from Taichung Veterans General Hospital, grant numbers TCVGH-1127313C, TCVGH-1127305D, TCVGH-1117308C, and TCVGH-1117305D to CL.L.
Data availability
The UK Biobank resource, which we used for this work, is available to bona fide researchers for health-related research in the public interest.
References
Author notes
Chia-Lin Lee and Tomohide Yamada contributed equally to the work.
Conflict of interest: We declare that none of the authors have a financial interest related to this work.

Comments