


Abstract
The real effects of the chronic consumption of anabolic-androgenic steroids (AASs) on cardiovascular structures are subjects of intense debate. The aim of the study was to detect by speckle tracking echocardiography (STE) right ventricular (RV) and left ventricular (LV) dysfunction at rest and during exercise stress echocardiography (ESE) in athletes abusing AAS.
One hundred and fifteen top-level competitive bodybuilders were selected (70 males), including 65 athletes misusing AAS for at least 5 years (users), 50 anabolic-free bodybuilders (non-users), compared to 50 age- and sex-matched healthy sedentary controls. Standard Doppler echocardiography, STE analysis, and lung ultrasound at rest and at peak supine-bicycle ESE were performed. Athletes showed increased LV mass index, wall thickness, and RV diameters compared with controls, whereas LV ejection fraction was comparable within the groups. left atrial volume index, LV and RV strain, and LV E/Em were significantly higher in AAS users. Users showed more B-lines during stress (median 4.4 vs. 1.25 in controls and 1.3 in non-users, P < 0.01 vs. users). By multivariable analyses, LV E/Ea (beta coefficient = 0.35, P < 0.01), pulmonary artery systolic pressure (beta = 0.43, P < 0.001) at peak effort and number of weeks of AAS use per year (beta = 0.45, P < 0.001) emerged as the only independent determinants of resting RV lateral wall peak systolic two-dimensional strain. In addition, a close association between resting RV myocardial function and VO2 peak during ESE was evidenced (P < 0.001), with a powerful incremental value with respect to clinical and standard echocardiographic data.
In athletes abusing steroids, STE analysis showed an impaired RV systolic deformation, closely associated with reduced functional capacity during physical effort, and—during exercise—more pulmonary congestion.
Introduction
Anabolic–androgenic steroids (AASs) are synthetic derivatives of testosterone. Since AAS stimulate cellular protein synthesis through androgenic receptors and promote the growth of all organs that have receptors similar to those of androgens,1 these drugs are sometimes used by power athletes to improve performance by increasing muscle mass and strength. However, the real effects of the chronic assumption of AAS on human performance and on cardiovascular adaptations are the subjects of intense debate. Indeed, in healthy athletes abusing AAS, elevated systolic and diastolic arterial blood pressure values and marked left ventricular hypertrophy (LVH) have been described, and these effects may persist even after AAS cessation.2 Of note, previous studies with human biopsy demonstrated that AAS induces a focal increase in myocardial collagen content as a repair mechanism against myocardial damage.3
Even if standard Doppler echocardiography is widely used to distinguish athlete’s heart from pathological LVH, few echocardiographic reports focused on changes in cardiac chambers morphology and function determined by chronic misuse of AAS.4,5 In endurance athletes a right ventricular (RV) dilation has been demonstrated as a consequence of chronic volume overload, but if right heart is damaged from the AAS abuse is not clearly known.6
Speckle tracking echocardiography (STE) is useful technique providing non-Doppler, relatively angle independent measurement of myocardial deformation and cardiac chambers systolic and diastolic dynamics,7 and it is particularly suited for detection of subclinical dysfunctions which are not detectable by standard echocardiography.8 Most of previous reports9,10 identified the possible effects of AAS misuse mainly on left ventricular (LV) regional myocardial function in power athletes. To date, no previous report analysed RV myocardial function in athletes abusing AAS. In addition to advanced deformation imaging, the current echocardiographic examination can be more comprehensive with a simultaneous assessment of pulmonary congestion with lung ultrasound and evaluation of B-lines. Conventional and advanced, cardiac and lung, imaging can be repeated during exercise, useful to unmask subtle changes which can be inapparent at rest.
On these grounds, the aims of the present study were to detect by STE underlying RV and LV dysfunction, and pulmonary congestion by lung ultrasound, in athletes abusing AAS, and to assess possible correlation between rest and stress parameters and exercise capacity during exercise stress echocardiography (ESE).
Methods
Study population
After receiving the endorsement of the institutional ethics committee, we selected a final population of 115 top-level competitive bodybuilders (70 males), including 65 athletes misusing AAS for at least 5 years (users), 50 anabolic-free bodybuilders (non-users), compared to 50 age- and sex-matched healthy sedentary controls. Exclusion criteria were valvular and congenital heart disease, cardiomyopathies, coronary artery disease, congestive heart failure, diabetes mellitus, and echocardiograms of inadequate quality.
Training protocols
All the athletes had trained intensively for 15–20 h/week for more than 5 years. They underwent anaerobic isometric static exercise at incremental workloads of 40–60% of maximal heart rate and their training protocol included 3 h/day of weightlifting at high workload. Maximum self-reported one-repetition squat results were 169 (36) kg in non-users, and 203 (26) kg in users, (P < 0.01). Further to the strength training, non-users and users performed about 2 h of low-intensity endurance training (‘fat burning’).
AAS misuse
The AAS reported to be administered by intramuscular injections were metenolone, nandrolone, and esters of testosterone. The steroids taken orally included fluoxymesterone, mesterolone, metenolone, metandienone, oxandrolone, and oxymetholone.
All except two participants used combinations of both oral and injectable substances. Three athletes who had sporadic experiences (<1 year; 2–16 IU daily) with growth hormone were excluded from the protocol. Two users who had taken cocaine once in the past were excluded. The classification into users and anabolic-free athletes was confirmed by additional measurements of luteinizing and follicle-stimulating hormones, showing clearly depressed blood concentrations in all users, whereas all non-users had normal values. The mean (standard deviation, SD) number of weeks of AAS use per year was 33.3 (6.4) in users and the mean (SD) weekly dosage of AAS was 528.4 (90.7) mg.
Sedentary healthy controls
We also studied 50 age- and sex-matched sedentary controls without detectable cardiovascular risk factors. All volunteer controls were recruited in Naples (Italy), selected from participants investigated for work eligibility at two cardiology department and examined in two centres (Monaldi Hospital, Naples, Italy—Umberto I° Hospital Nocera Inferiore).
Control individuals were consecutively identified and enrolled if they were normotensive, had a normal 12-lead electrocardiogram, normal LV ejection fraction (>55%) and wall motion score index. Subjects were excluded if they had: (i) arterial systemic hypertension (blood pressure ≥135/85 mmHg as average of different three visits) and/or were on active anti-hypertensive treatment; (ii) overt coronary artery disease; (iii) primary cardiomyopathy and/or genetic cardiovascular disease; (iv) congenital heart disease; (v) mitral or aortic valvular insufficiency of higher degree than trivial, valvular stenosis of any degree; (vi) any previous cardiac or vascular surgery or interventional procedure (including ablation of accessory pathways); (vii) any kind of cardiac therapy; and (viii) previous cardioembolic stroke, including transient ischaemic attacks.
Frequency matching was used to ensure comparability of the groups (athletes and controls). Baseline characteristics such as familiar history of atherosclerotic disease, eating habits, smoking behaviour, and work activities were examined, and no significant differences were observed for these parameters between the groups of patients.
Echocardiographic procedures
Standard Doppler echocardiography, tissue Doppler imaging (TDI) and STE were performed by digital ultrasound machine (Vivid E9, GE Medical Systems, Milwaukee, WI, USA), equipped with DMI and STE capabilities. A variable frequency phased-array transducer (2.5–3.5–4 MHz) was used. Two experienced readers analysed all the measurements, using the average of 3–5 cardiac cycles.
Standard echo-Doppler and TDI measurements
The following RV morphologic parameters were measured: basal RV diameter (RVD1), mid-cavity RV diameter (RVD2), and longitudinal diameter (RVD3) in the apical four-chamber view at the end-diastole; RV outflow tract at sub-pulmonary region from parasternal short-axis view. As traditional indexes of RV longitudinal systolic function, both tricuspid annular plane systolic excursion (TAPSE) by M-Mode, and RV peak systolic velocity (Sm wave) by TDI were determined in a standard apical four-chamber view.11
In the parasternal short-axis or in the apical four-chamber view, the peak tricuspid regurgitant velocity (TRV) was measured. On the basis of the TRV, pulmonary artery systolic pressure (PASP) was calculated as Bernoulli’s principle: (4 × TRV2) + RAP, where RAP is the right atrial pressure.
Diastolic RV function was evaluated by peak velocity of the inflow (E wave, A wave) through the tricuspid valve by pulsed Doppler and the velocity of the lateral tricuspid annular plane by DTI (RV Em wave), in according to the ASE Guidelines. The parameters considered were: E wave, E/A ratio, and E/Em ratio.
LV M-mode measurements were obtained in a parasternal long-axis view, according to the criteria of the American Society of Echocardiography. LV mass was calculated by the Penn convention and indexed for height (Cornell adjustment).12 LV ejection fraction was measured using a commercially available software program that applied Simpson’s rule on the four-chamber and two-chamber views. LV outflow Doppler imaging was used to calculate stroke volume as the product between outflow tract area and LV output velocity integral.13
As for LV diastolic measurements by pulsed Doppler were measured: E and A peak velocities (m/s) and their ratio.14 By pulsed-wave TDI, LV myocardial early diastolic (Em) and atrial diastolic (Am) peak velocities (m/s), Em/Am ratio were determined as LV regional diastolic measurements at septal and lateral wall level.
B-lines were evaluated by lung ultrasound with the four-site simplified scan, from mid-axillary to mid-clavicular lines on the third intercostal space, each site scored from 0 = A-lines to 10 = white lung.15
Two-dimensional strain echocardiography
We used two-dimensional (2D) STE, a technique based on pure two-dimensional grey-scale ultrasound acquisition, to analyse myocardial deformation of both left ventricle and right ventricle. In our study, digital loops with three successive cardiac cycles were acquired from apical four-chamber view, with an optimized frame rate (50–90 frames/s). The software automatically detected the endocardium at end-systole, tracked myocardial motion during the entire cardiac cycle, and created U-shaped regions of interest that encompassed basal, middle, and apical segments of different walls. Longitudinal strain for each segment was measured and the software calculated LV global longitudinal strain (GLS) by averaging local strains along the endocardium.
It has been demonstrated that the RV free wall longitudinal strain is less dependent from the LV function. When RV GLS is calculated considering also the interventricular septum, it could be conditioned by the LV function because of the ventricular interdependence due to the presence of a common wall. As a consequence, the RV free wall longitudinal strain is considered an independent measure of the RV myocardial function (Figures 1 and 2).16
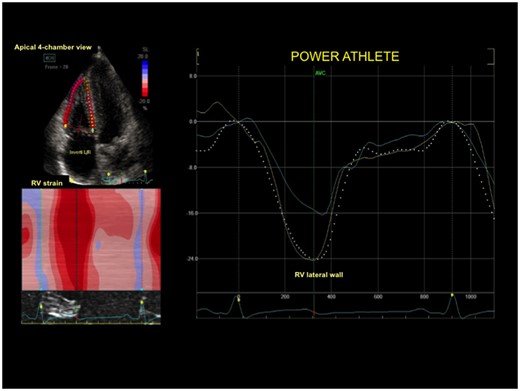
Right ventricular strain curve in a control subject with normal right ventricular deformation of lateral wall.
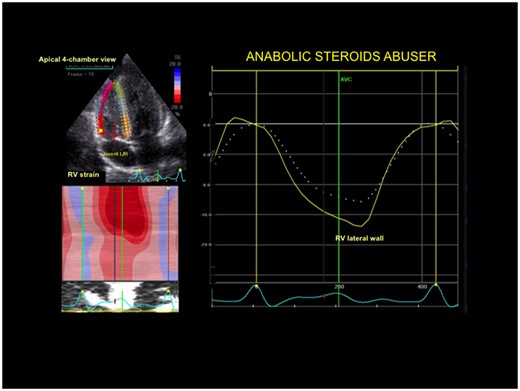
Right ventricular strain curve in a power athlete abusing anabolic-androgenic steroids. Right ventricular deformation of lateral wall was significantly impaired.
Exercise stress echocardiography
After the resting echocardiography, all the patients enrolled underwent a semi-supine bicycle ESE using a standard protocol of incremental 25 W steps each 2 min. The pedalling rate was of 60 rpm.
The same ultrasound system of the standard rest echocardiography was used. Images from parasternal long-axis and short axis, and from apical four-, two-, and three-chamber views were continuously recorded during the different steps of the exam. Causes of interruption of the study included new wall motion abnormalities, significant ST-segment changes (i.e. ST-segment depression or elevation ≥1 mm or more in two contiguous leads), and onset of symptoms or arrhythmias. Functional parameters collected at rest and at peak effort included heart rate, systolic blood pressure, workload achieved in Watts, and rate-pressure product. Peak oxygen consumption (VO2 peak) was also assessed by cardiopulmonary test performed during the ESE study. The ventilatory efficiency of each subject was calculated from the slope of the relationship between VCO2 and VE during each test.
At peak effort, functional parameters such as maximal heart rate, maximal systolic blood pressure, and maximal workload (number of watts achieved by supine bicycle test) were evaluated.17
Echocardiographic parameters measured at baseline and at peak effort included RV traditional systolic parameters (TAPSE and TDI Sm wave), PASP, LV diastolic parameters, LV EF, 2DSTE LV, and RV analysis.
Lung ultrasound analysis was also performed to assess pulmonary B-lines during effort. The positivity criterion for B-lines was a stress score higher than rest for ≥2 points.15
Statistical methods
All analyses were performed using IBM SPSS Statistics for Windows, version 22.0 (IBM Corp. released 2013, Armonk, NY, USA). Normality was assessed with D’Agostino–Pearson test.
Continuous variables were reported as medians with interquartile range or means with standard deviations. Categorical variables were reported as frequencies with percentages. Analyses of variance by Newman–Keuls post hoc test for multiple comparisons, and t-test for unpaired data were performed to estimate differences between groups.
Linear regression analysis and Pearson’s partial correlation test were used to explore univariate relations between echocardiographic and clinical data. Multivariate analysis was performed to assess the independent predictors of RV myocardial deformation and of exercise capacity, including only significant parameters by univariate analysis. In the multivariable analysis, an interactive stepwise procedure was adopted, where variables were included into the model in the same order as in the clinical practice. Therefore, first clinical data were analysed, and the global R-square was calculated. Then, a second step was created after the addition of standard echocardiographic data. Finally, strain measurement was included, and the incremental predictive value of the added variables was assessed by comparison of the global chi-square of the model at each step.
Reproducibility of measuring 2D strain and lung ultrasound parameters was determined in 50 subjects, according to previously reported methods. Intra-observer variability and inter-observer variability were expressed with coefficient of variation (COV) and by Bland–Altman analysis.
Receiver operating characteristic (ROC) curve analysis for censored data was implemented to test the ability of strain data to detect myocardial dysfunction (optimal cut-off point highest and to the left on the ROC curve). Differences were significant at P < 0.05.
Results
Clinical characteristics of the study population
Table 1 shows the clinical characteristics of the study population. The three groups were matched for age and sex. In accordance with the effects of the training, in athletes, systolic blood pressure and body surface area were higher, and heart rate was lower than in controls.
Clinical characteristics of the study population (mean and SD)
| Variable | Controls (n = 50) | Users (n = 65) | Non-users (n = 50) |
|---|---|---|---|
| Age (years) | 33.4 ± 2.8 | 33.6 ± 2.5 | 32.8 ± 4.4 |
| Male sex (n) | 34 | 37 | 33 |
| BSA (m2) | 1.87 ± 0.4* | 2.2 ± 0.6 | 2.01 ± 0.5 |
| HR (beats/min) | 77.3 ± 5.4* | 68.4 ± 8.8 | 67.4 ± 7.7 |
| Systolic BP (mmHg) | 124.8 ± 5.5 | 139.8 ± 8.5** | 128.4 ± 7.3 |
| Diastolic BP (mmHg) | 84.5 ± 7.2 | 85.3 ± 5.5 | 81.3 ± 4.7 |
BP, blood pressure; BSA, body surface area; HR, heart rate.
P < 0.01: controls vs. users and non-users.
P < 0.01: users vs. non-users and controls.
Resting standard Doppler echocardiographic analysis
Tables 2 and 3 show the details of the standard Doppler and STE echocardiographic analysis. LV mass index did not significantly differ between the two groups of athletes. In particular, both users and non-users showed increased wall thickness and stroke volume compared with controls, whereas LV ejection fraction, LV end-diastolic diameter, transmitral Doppler indexes, and lung ultrasound B-lines were comparable between the three groups. Conversely, left atrial (LA) volume index, LV strain, and LV E/Ea were significantly increased in AAS users (Table 2).
Left heart echocardiographic quantitative analysis at rest in the overall population (mean and SD)
| Variable | Controls (n = 50) | Users (n = 65) | Non-users (n = 50) |
|---|---|---|---|
| M-mode and B-mode echocardiography | |||
| Septal wall thickness (mm) | 8.8 ± 1.7 | 13.4 ± 2.7* | 12.1 ± 2.2** |
| Posterior wall thickness (mm) | 7.8 ± 1.2 | 12.4 ± 2.6* | 11.2 ± 2.2** |
| LV end-diastolic diameter (mm) | 45.3 ± 4.1 | 48.4 ± 4.6 | 46.7 ± 3.9 |
| LV end-systolic diameter (mm) | 26.2 ± 3.4 | 28.9 ± 4.2 | 28.9 ± 3.4 |
| Relative diastolic wall thickness | 0.43 ± 0.4 | 0.46 ± 0.6 | 0.46 ± 0.4 |
| LV mass index (g/m2.7) | 48.4 ± 5.4 | 69.9 ± 8.4* | 62.4 ± 8.9** |
| LV ejection fraction (%) | 60.8 ± 4.1 | 57.8 ± 5.4 | 61.6 ± 5.1 |
| LA volume index (mL/m2) | 25.6 ± 1.8 | 31.9 ± 5.3* | 27.3 ± 2.1 |
| Doppler, TDI and strain analysis | |||
| LV stroke volume index (mL/m2) | 35.2 ± 1.7 | 41.5 ± 2.2 | 41.5 ± 2.7 |
| Mitral peak E velocity (m/s) | 0.75 ± 0.4 | 0.70 ± 0.4 | 0.73 ± 0.8 |
| Mitral peak A velocity (m/s) | 0.53 ± 0.2 | 0.59 ± 0.6 | 0.54 ± 3.4 |
| Mitral peak E/A ratio | 1.5 ± 0.4 | 1.2 ± 0.7§ | 1.6 ± 0.5 |
| LV lateral Em (m/s) | 0.16 ± 0.03 | 0.09 ± 0.04§ | 0.14 ± 0.04 |
| LV E/Em | 4.5 ± 1.4 | 7.2 ± 2.7§ | 4.7 ± 2.5 |
| LV GLS (%) | −22.9 ± 3.5 | −17.4 ± 2.6§ | −21.4 ± 3.7 |
LV, left ventricular; LV GLS, left ventricular global longitudinal strain.
P < 0.001: users vs. controls.
P < 0.01: non-users vs. controls.
P < 0.01: users vs. controls and non-users.
P < 0.01: controls vs. users and non-users.
Right heart echocardiographic quantitative analysis at rest in the overall population (mean and SD)
| Variable | Controls (n = 50) | Users (n = 65) | Non-users (n = 60) |
|---|---|---|---|
| RV wall thickness (mm) | 3.4 ± 1.1 | 3.7 ± 1.2 | 3.5 ± 1.2 |
| RVD1 (mm) | 31.4 ± 3.4 | 34.9 ± 3.5* | 32.7 ± 3.4 |
| RVD2 (mm) | 27.3 ± 1.8 | 30.9 ± 5.3* | 28.2 ± 2.1 |
| RVD3 (mm) | 76.2 ± 4.2 | 77.9 ± 5.2 | 76.3 ± 4.7 |
| RVOT diameter (mm) | 27.3 ± 5.8 | 28.9 ± 6.4 | 28.2 ± 5.9 |
| PASP (mmHg) | 21.6 ± 3.1 | 35.5 ± 6.8** | 28.5 ± 5.8 |
| TAPSE (mm) | 23.6 ± 3.4 | 21.4 ± 3.4 | 22.4 ± 3.4 |
| TDI RV peak systolic velocity Sm (m/s) | 15.6 ± 4.2 | 13.9 ± 3.3 | 14.8 ± 3.3 |
| Tricuspid peak E velocity (m/s) | 0.69 ± 0.4 | 0.72 ± 0.4 | 0.73 ± 0.8 |
| Tricuspid peak E/A ratio | 1.5 ± 0.5 | 1.2 ± 0.7 | 1.6 ± 0.5 |
| Tricuspid Em (m/s) | 0.17 ± 0.03 | 0.14 ± 0.04 | 0.16 ± 0.04 |
| Tricuspid E/Em | 4.5 ± 1.4 | 5.2 ± 2.7 | 4.7 ± 2.5 |
| B-lines (median and IQR) | 0.60 (0–14) | 0.70 (0–16) | 0.66 (0–14) |
| RV lateral wall longitudinal strain (%) | −22.2 ± 3.5 | −15.4 ± 2.6** | −20.8 ± 3.7 |
D, diameter; PASP, pulmonary artery systolic pressure; RV, right ventricle; RVOT, right ventricular outflow tract; TAPSE, tricuspid annular plane systolic excursion; TDI, tissue Doppler Imaging.
P < 0.01: users vs. controls and non-users.
P < 0.001: users vs. controls and non-users.
As for RV parameters, RV diameters were mildly increased in athletes, while traditional RV systolic function indexes like TAPSE and TDI Sm wave were similar among athletes and control group (Table 3).
RV speckle tracking was obtainable at rest in 95% of the total analysed segments. The remaining 5% segments were not considered due to a suboptimal tracking score >2.5. Overall, the tracking score was <2.0 for 83% of the analysed segments. In users, RV lateral wall longitudinal strain was significantly reduced (Table 3) (Figures 1 and 2).
Exercise stress echocardiography
During effort, AAS users showed reduced VO2 peak and higher systolic blood pressure, as showed in Table 4. Mild but non-significant increase was detected in AAS users for the VE/VCO2.
Functional parameters of athletes and controls during physical effort (mean and SD)
| Variable | Controls (n = 50) | Users (n = 65) | Non-users (n = 50) |
|---|---|---|---|
| Functional indexes | |||
| Maximal HR (beats/min) | 178.5 ± 10.4 | 172.9 ± 8.4 | 173.4 ± 9.8 |
| Maximal SBP (mm Hg) | 165.8 ± 15.4 | 185.4 ± 14.8§ | 166.8 ± 10.8 |
| Rate–pressure product (beats/min × mmHg × 10−3) | 0.29 ± 0.2 | 0.32 ± 0.6§ | 0.28 ± 3.4 |
| Maximal workload achieved (W) | 150.5 ± 32.4 | 160.2 ± 24.7 | 200.7 ± 33.5* |
| Peak VO2 (mL/kg/min) | 42.9 ± 6.4 | 45.3 ± 8.7 | 55.9 ± 7.4* |
| VE/VCO2slope | 27.9 ± 4.4 | 29.8 ± 8.7 | 28.6 ± 3.4 |
| Echocardiographic measurements | |||
| LV EF (%) | 66.5 ± 4.5 | 63.8 ± 4.4 | 67.6 ± 6.1 |
| LV GLS (%) | −26.4 ± 2.2 | −22.4 ± 1.8§ | −27.3 ± 3.5 |
| Mitral E/Em ratio | 5.5 ± 2.4 | 9.8 ± 2.7§ | 5.7 ± 2.3 |
| TAPSE (mm) | 27.6 ± 3.1 | 25.4 ± 2.4 | 28.4 ± 3.3 |
| PASP (mmHg) | 25.6 ± 3.3 | 40.5 ± 5.8** | 31.5 ± 4.8 |
| TDI RV peak systolic velocity Sm (m/s) | 24.7 ± 2.2 | 22.4 ± 3.1 | 25.8 ± 3.3 |
| B-lines (median and IQR) | 1.25 (0–24) | 4.4 (5–38)** | 1.3 (0–27) |
| RV lateral strain (%) | −25.2 ± 4.5 | −17.2 ± 2.6 ** | −24.8 ± 3.1 |
HR, heart rate; SBP, systolic blood pressure; TAPSE, tricuspid annular plane systolic excursion; TDI, tissue Doppler imaging.
P < 0.01: users vs. controls and non-users.
P < 0.001: non-users vs. controls and users.
P < 0.001: users vs. controls and non-users.
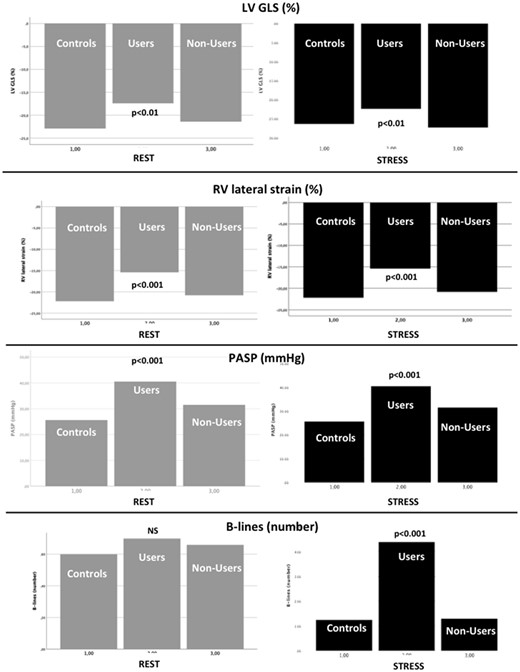
Increase in LV ejection fraction and RV traditional systolic indexes were similar between the three groups. Conversely, increase in LV GLS and RV lateral strain was significantly lower in users patients when compared with healthy controls and non-users. In addition, users showed at peak effort increased LV E/Em ratio, PASP and B-lines by lung ultrasound. The differences between the three study groups at rest and peak stress are shown in Figure 3.
Rest (left) and stress (right) values of left ventricular global longitudinal strain (upper row), right ventricular lateral strain, (second row), pulmonary artery systolic pressure (third row), and B-lines (bottom row).
Determinants of RV strain and association with physical effort performance
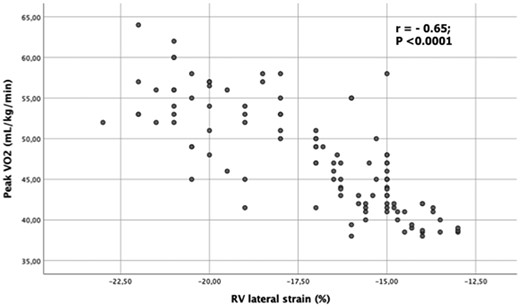
By univariate analysis, in AAS users RV lateral strain was associated with age (r = 0.35; P < 0.01), more years of training (r = −0.37; P < 0.01), number of weeks of AAS abuse (r = 0.53; P < 0.001), increased LV E/Ea (r = 0.48; P < 0.001), and PASP (r = 0.51; P < 0.001) during effort. In addition, RV strain was closely associated with peak VO2 during ESE (r = −0.65; P < 0.0001) (Figure 4).
Scatter plot between right ventricular lateral strain of lateral wall and peak oxygen consumption during exercise stress echocardiography in the overall population of power athletes.
Separate multiple linear regression analyses were carried out after adjusting for potential confounders such as body surface area, heart rate, systolic blood pressure, Doppler indexes and LV mass index. By stepwise forward multivariate analyses, LV E/Ea (beta coefficient = 0.35, P < 0.01), PASP (beta = 0.43, P < 0.001) at peak effort and number of weeks of AAS use per year (beta = 0.45, P < 0.001) emerged as the only independent determinants of resting RV lateral wall peak systolic two-dimensional strain.
In addition, the close association between resting RV myocardial function and peak VO2 during ESE was confirmed, showing a powerful incremental value with respect to clinical and standard echocardiographic data (Table 5). We found that a RV lateral strain <15% could identify AAS users with a sensitivity and specificity of 83.3 and 92.1%, respectively [area under the curve: 0.84, 95% confidence interval (CI) 0.66–0.84, P < 0.0001].
Incremental value of clinical and echocardiographic data in predicting maximal oxygen uptake (peak VO2) during physical effort in power athletes
| Type of variables | Model R-square | P-value | Variables selected (beta coefficient; 95% CI; P-value) |
|---|---|---|---|
| Clinical | 5.5 | <0.01 |
|
| Clinical + standard echo | 16.9 | <0.001 |
|
| Clinical + standard echo + strain | 26.7 | <0.0001 |
|
| Type of variables | Model R-square | P-value | Variables selected (beta coefficient; 95% CI; P-value) |
|---|---|---|---|
| Clinical | 5.5 | <0.01 |
|
| Clinical + standard echo | 16.9 | <0.001 |
|
| Clinical + standard echo + strain | 26.7 | <0.0001 |
|
Variability of RV lateral wall strain
Intra-observer
COV: 5.37 (ICC 0.73).
Bland–Altman analysis: lateral wall (95% CI ± 1.6; percent error 3.3%).
Inter-observer
COV: LV MWE: 7.22 (ICC 0.77).
Bland–Altman analysis: lateral wall (95% CI ± 1.9; percent error 3.4%).
Variability of lung ultrasound
Intra-observer
COV: 4.87 (ICC 0.71).
Bland–Altman analysis: (95% CI ± 0.7; percent error 2.2%).
Inter-observer
COV: 5.27 (ICC 0.74).
Bland–Altman analysis: (95% CI ± 1.1; percent error 2.8%).
Discussion
The results of the present study demonstrate the incremental value of 2DSE to analyse RV and LV myocardial function in power athletes abusing AAS, with higher sensitivity than TDI and conventional ultrasound techniques. During stress, athletes on AAS also showed reduced values of RV and LV function, higher SPAP and greater pulmonary congestion mirrored by increased B-lines.
Previous experimental studies on AAS
Some experimental in vitro studies may indicate the adverse effect of AAS on the cardiovascular system.2 The myocardial cellular destruction of primary myocardial cells in culture, treated by AAS, was associated with depressed contractile activity, increased lysosomal fragility, and depressed mitochondria activity.1,18,19 In vivo studies on animals were also performed, demonstrating the negative effects of AAS on cardiovascular system, such as increased collagen synthesis, aberrant myocardial myofibrils, and reduced compliance.20,21
As a result, some hypothetical models of AAS-induced adverse cardiovascular effects were proposed according to basic research: the atherogenic, the thrombotic model, the coronary vasospastic, and the direct injury models. On the basis of experimental studies, there is evidence that an advanced degree of wall hypertrophy in users is accompanied by a disproportionate increase in the connective tissue content as a reparative process of the myocardial cellular injury caused by AAS.22,23
Previous reports in athletes abusing AAS
Few high-quality studies examined the real prevalence of AAS abuse in competitive body-builders, ranging from 37.5% to 66.7% of top-level athletes.24–26
Myocardial function studies in AAS abusers, using STE analyses, documented marked cardiac deficits in AAS misuse. However, previous papers were mainly focused on LV and LA function.9,23
Concerning RV function, in AAS-non-user athletes recent papers identified comparable 2D and 3D RV systolic indexes between endurance athletes and controls; in this setting, a mild reduction in global RV function could be considered a physiological consequence of RV dilation, while a severe reduction in RV global systolic function should be always considered an abnormal finding.27,28
Previous researches in AAS abusers29 stated that AAS use is associated with RV dysfunction detected by cardiac magnetic resonance (CMR) in strength-trained athletes. In particular, Angell et al.30 identified in a CMR study amongst recreational bodybuilders a reduced RV ejection fraction in anabolic users (users 51 ± 4% vs. non-users 59 ± 5%; P < 0.05). As for RV longitudinal systolic function, Alizade et al.31 analysed 33 competitive male bodybuilders (15 AAS users, 18 AAS non-users). Despite normal standard systolic echo parameters, RV free wall longitudinal strain and strain rate were decreased in AAS users in comparison with non-users.
Uniqueness of the present study
The main findings of the present study were that: (i) despite the absence of manifest RV global systolic dysfunction, RV regional strain measurements were impaired in users compared with non-users and healthy sedentary controls; (ii) even after correction for potential confounders, RV myocardial longitudinal deformation was directly related to LV filling pressures and PASP in users; (iii) in such population of doped athletes, RV strain was a powerful independent predictor of functional capacity during ESE; and (iv) differences in LV and RV function and PASP were maintained during exercise, which unmasked a vulnerability to pulmonary congestion in users, not apparent in resting evaluation.
In our body-builders, despite normal TAPSE, TDI systolic peak velocities and LV ejection fraction, a significant reduction of strain at the level of both RV and LV chambers was detected. These findings confirm an early impairment of biventricular contractile function in AAS users, at a time when other global and regional systolic parameters remain normal. Multivariate analysis provided further information about this association by adjusting for several confounders, chosen according to the heart physiology. By this analysis, SPAP and LV E/Em were independent determinants of RV strain, explaining >70% of its variability. Another result of our study was the close correlation between RV function and functional capacity during ESE in AAS. These independent associations confirm the reciprocal close interaction between right ventricle, pulmonary circulation and LV diastolic function in athletes.17,32 A RV strain decrease might be partially the final result of an augmented right ventricle and right atrial pressure in AAS users, probably caused by the increased RV afterload (i.e. higher PASP), secondary to LV diastolic dysfunction (i.e. higher LV E/Em) due to marked LVH. This increase in RV chambers afterload, evident in our study both at rest and during effort, might determine a progressive reduction of RV myocardial deformation, a decrease in RV stroke volume, with a consequent LV preload reduction, which may further explain the reduction of LV stroke volume and the consequent impaired cardiac performance during physical effort in power athletes abusing AAS.
Finally, the concomitant impairment of LV myocardial systolic deformation indexes (LV GLS) both at rest and during stress in our athletes may suggest also a direct involvement of both LV and right ventricle by the disproportionate increase in the connective tissue content as a reparative process of the myocardial cellular injury caused by AAS.22,23
Therefore, a complete biventricular strain study at rest and during ESE could have an incremental role to support clinicians for the therapeutic management and decision-making in athletes abusing steroids.
Study limitations
Our study has several methodological limitations. Firstly, it was based on cross-sectional rather than longitudinal data. It does not seem reasonable to suppose that power athletes choosing to take anabolic drugs have initial cardiac measurement results different from AAS-free athletes. A longitudinal study using humans would also give rise to ethical problems.
Secondly, no histological determination of cardiac structure was available, but the use of this invasive technique was not ethically acceptable. No urine or serum measurements of drugs were available, but all athletes were in a wash-out period, to avoid the acute pharmacological effects induced by AAS on the cardiocirculatory function.
Thirdly, information about the intake of steroids was self-reported, but it is difficult to assess this in an objective manner.24–26 It seems unlikely that the small differences in AAS intake could explain our results.
Then, training-related influences are also improbable as an explanation for the differences between the AAS users and non-users in our study, as the training protocol was the same for all the athletes. Strain is influenced by loading conditions; thus, the comparisons of RV deformation properties between athletes may have been influenced by preload and by different RV wall stress. However, even if our study protocol did not include any invasive hemodynamic measurement, our athletes presented similar mean heart rates and LV chamber dimensions. As a result, this confounding factor should not detract from the value of atrial strain analysis.33
Next, we used for two-dimensional strain analysis EchoPAC PC program from GE Healthcare. Since definite 2DSE software for RV two-dimensional strain has not yet been provided, we applied a program of 2DSE for LV to analyse also RV strain. In future studies changes of the software may be needed in order to improve the tracking ability of the speckle tracking system for RV functional study.
Finally, another technical limitation is that speckle-tracking echocardiography is dependent on frame rate as well as image resolution. Low frame rate results in the speckle pattern changing too much from frame to frame, which prevents the precise characterization of regional myocardial motion and impacts the overall temporal resolution of the regional strain map. In contrast, increasing the frame rate reduces scan line density, which reduces image resolution. Frame rate in our setting ranged from 50 to 90 frame/s; this value is lower than frame rate available with Doppler strain, however indexes of RV function used in this study did not rely on difference in the timing of contraction.33
Conclusions
In athletes abusing AAS, RV deformation at baseline is more impaired in users compared with non-users athletes and is closely associated with functional capacity during effort. Athletes abusing AAS also show an impaired RV and LV contractile reserve, more pronounced increase in PASP and greater signs of pulmonary congestion during exercise, suggesting a multifactorial component of the impaired exercise capacity which can be best captured with comprehensive echocardiographic imaging supplemented by deformation imaging and lung ultrasound. Since RV enlargement and impairment has been proposed as a predictor of common cardiovascular outcomes in other clinical contests,31 future longitudinal studies are warranted to further our understanding of the natural history of RV myocardial function, the extent of reversibility of RV dysfunction after AAS cessation, and the possible long-term impact of such changes on outcomes in athletes abusing of AAS.
Conflict of interest: none declared.

Comments