


Abstract
Hyperammonemia during rest periods is a dysfunction in heart failure (HF). The low formation of ammonia during exercise reflects an inefficiency of purine metabolism. Hyperkalemia in response to physical exercise is common in HF and may contribute to a contractile inefficiency in type II fibers, leading to early fatigue. We tested the hypothesis that during resistance exercise of high intensity and low volume, this disorder of ammonia metabolism would be more intense, due to the hyperkalemia present in HF.
Alternating resistance exercise (RE) of low intensity and high volume, and high intensity and low volume, were applied to 18 patients with an interval of 7 days between them (functional class II-III New York Heart Association, FE = 33.5 ± 4%) and compared with 22 healthy controls matched for age and gender. Ammonia, potassium and lactate levels were assessed before and immediately after the RE.
Significant differences: Deltas (control vs. HF) in 40% RE: lactate (mg/dl) 26.3 ± 10 vs. 37.7 ± 7; p < 0,001, ammonia (ug/dl) 92.5 ± 18 vs. 48.9 ± 9; p < 0.001. Deltas (control vs. HF) in 80%RE: lactate(mg/dl) 45.0 ± 12 vs. 54.1 ± 11; p < 0.05, ammonia(ug/dl) 133.5 ± 22 vs. 32.2 ± 7; p < 0.001, potassium (mEq/L) 1.6 ± 0.4 vs. 2.0 ± 0.8; p < 0.05. A negative correlation was found between the deltas of ammonia and potassium (r = −0.74, p < 0.001) in the HF group.
We conclude that in HF, there is an inefficiency of purine metabolism that increases with increasing exercise intensity, but not with an increase of total volume. These findings suggest that hyperkalemia may play an important role in the disorders of purine metabolism.
Introduction
Intensive physical exercise causes rapid adenosine tri-phosphate (ATP) consumption, with a buildup of adenosine di-phosphate (ADP) and adenosine mono-phosphate (AMP). In this degradation cascade called the purine nucleotide cycle, AMP is deaminated into inosine mono-phosphate by the action of the AMP deaminase enzyme, with the parallel formation of ammonia (NH3). Different studies report the impact of hyperammonemia on physical performance during long sessions of physical effort, where it hinders ventilation, central nervous system activity and neuromuscular activity, as well as causing muscle fatigue.1–4 During physical exercise, an increase in ammonia is correlated with the percentage of type II muscle fibers and an increase in lactate, strongly influenced by the efficiency of oxidative metabolism.5–7 All these factors are altered in patients with heart failure (HF).
The significant reduction in physical capacity among patients with HF is partially explained by important changes in the skeletal musculature. The low blood flow, reduced oxidative enzyme activity, changes in the percentage of type I skeletal muscle fibers and a reduction in creatine phosphate (CP) associated with disuse of muscle contribute toward an intensification of the anaerobic glycolytic pathway aimed at compensating for the depletion of ATP during physical exercise.8 In HF patients, there are high concentrations of ammonia at rest, which positively correlate with the severity of HF, according to the functional classification of the New York Heart Association (NYHA), and it characterizes purine metabolism disorder.9 Other studies demonstrate that the formation of ammonia in heart failure is reduced as exercise increases, suggesting there is a failure in the metabolism of purines.10
Differences in the formation of ammonia are partially related to the intensity of the effort in exercises with increasing loads; however, the intensity obtained by the load percentage and the total volume obtained from the product between the load percentage, number of sets and number of repetitions in resistance exercise (RE)11 can lead to different responses. This issue has been underexplored. When loads less than 40% of 1 Repetition Maximum (1RM) are used, RE is considered to be of low intensity (40% 1RM) and a high volume (4 sets × 20 repetitions) with anaerobic glycolysis is the predominant metabolic pathway.12,13 When a load greater than 80% of 1RM is used, RE is considered to be of high intensity (80% 1RM) and low volume (4 sets × 8 repetitions), so the ATP-CP system is the predominant metabolic pathway.14 At this intensity, any exercise is performed with the intensive participation of type II muscle fibers.
An increase in plasma potassium in response to physical exercise becomes accentuated in patients with HF.15 This hyperkalemia hinders the contractile efficiency of type II muscle fibers,16 thereby affecting purine metabolism and consequently the formation of ammonia, especially during high-intensity exercise. It is therefore plausible to suppose that RE parameters such as intensity and volume, together with diverse alterations found in HF, would promote different responses in the formation of ammonia.
The present study tested the hypothesis that the ammonia metabolism disorder during high-intensity exercise would be more intense, despite the low work volume. This hypothesis is founded on the hyperkalemia found in patients with HF.
Methods
A randomized, controlled, crossover study was carried out following approval from the Human Research Ethics Committees of the Federal University of São Paulo and Santo Amaro University in Brazil.
Patients
In the present study, we matched 18 male patients with HF of an ischemic origin (NYHA functional classes II and III) with 22 sedentary healthy individuals for age and gender (control group). The baseline characteristics of these groups are displayed in Table 1. The inclusion criteria for the group with HF were: clinical stability within the previous 3 months, no changes in medication nor diet, and no participation in physical exercise programs. Individuals with pulmonary, hematological, neuromotor, kidney or liver diseases were excluded from the study. Those who became symptomatic during the exercise protocol were also excluded.
Resting and exercise data from healthy subjects and optimally-treated patients with Chronic Heart Failure
| Controls, n = 22 | HF, n = 18 | |
|---|---|---|
| Anthropometrics/demographics | ||
| Age (yr) | 50.3 ± 7.5 | 53.2 ± 6.5 |
| BMI (kg/m2) | 25.3 ± 2.8 | 20.9 ± 1.6 |
| Echocardiography | ||
| Left ventricle ejection fraction (%) | 59.0 ± 7.4 | 33.5 ± 4.9b |
| Lipid profile | ||
| Total Cholesterol (mg/dl) | 167.8 ± 25.1 | 184.3 ± 9.b |
| VLDL-C (mg/dl) | 30.9 ± 5.2 | 31.7 ± 6.8 |
| LDL-C (mg/dl) | 94.1 ± 24.8 | 108.8 ± 39.8b |
| HDL-C (mg/dl) | 42.7 ± 7.0 | 43.7 ± 5.4 |
| Triglycerides (mg/dl) | 157.7 ± 32.1 | 175.2 ± 34.3 |
| Drugs | ||
| Βeta-blocker | 100% | |
| ACE inhibitor | 100% | |
| Antiplatelet | 88.8% | |
| Diuretic | 83.3% | |
| Calcium channel blocker | 11.1% | |
| Resistance exercise | ||
| 40% of 1RM (kg) | 14.1 ± 4.7 | 9.7 ± 3.3b |
| 80% of 1RM (kg) | 28.6 ± 6.2 | 17.4 ± 5.1b |
| Total volume of 40% | 1149.1 ± 354.0 | 762.2 ± 169.4b |
| Total volume of 80% | 917.8 ± 284.7 | 581.3 ± 131.4b |
| Cardiovascular parameters | ||
| HRrest (bpm) | 75.9 ± 9.8 | 81.8 ± 8.1a |
| MAPrest (mmHg) | 103.0 ± 6.5 | 94.1 ± 8.8b |
| Incremental exercise test | ||
| VO2peak (ml/kg/min) | 41.5 ± 1.6 | 22.2 ± 2.4b |
| FAI | −18.2 ± 10.7 | 34.4 ± 8.9b |
| HRmax (bpm) | 163.6 ± 9.7 | 147.0 ± 10.1b |
| HR (% predicted) | 96.5 ± 5.7 | 88.2 ± 5.4b |
| HRR1 min (bpm) | 21.4 ± 8.16 | 7.6 ± 1.2b |
| MAPpeak (mmHg) | 132.9 ± 9.6 | 125.1 ± 11.6a |
Values are means, plus or minus SD
Total volume is expressed as Kg × sets × repetition
BMI: body mass index; C: cholesterol; HF: heart failure; VLDL: very low density lipoprotein; LDL: low density lipoprotein; HDL: high density lipoprotein; ACE: angiotensin-converting enzyme; HR: heart rate; MAP: medium arterial pressure; VO2max: maximal oxygen uptake; FAI: functional aerobic impairment; HRR: heart rate recovery; RM: repetition maximum
p < 0.05
p < 0.001 (non-paired t-test).


Behavior of the plasmatic metabolic pre- and post-resistance exercise
| RE 40% of 1RM | RE 80% of 1RM | ANOVA | |||
|---|---|---|---|---|---|
| Control | HF | Control | HF | ANOVA | |
| Ammonia pre | 34.4 ± 7.5 | 68.1 ± 24.6b | 31.7 ± 6.3 | 70.3 ± 18.5b | <0.001 |
| Ammonia post | 126.9 ± 16.3 | 117.0 ± 33.6 | 165.1 ± 22.2 | 102.5 ± 20.0b | <0.001 |
| Lactate pre | 10.9 ± 2.9 | 14.8 ± 3.1b | 11.9 ± 3.2 | 13.8 ± 2.8a | <0.001 |
| Lactate post | 37.3 ± 9.6 | 52.5 ± 7.8b | 56.8 ± 13.1 | 67.9 ± 11.0a | <0.001 |
| Potassium pre | 4.5 ± 0.4 | 4.6 ± 0.6 | 4.4 ± 0.4 | 4.6 ± 0.9 | 0.542 |
| Potassium post | 5.4 ± 0.8 | 5.5 ± 0.7 | 6.0 ± 0.5 | 6.7 ± 1.2a | <0.001 |
Values are means plus or minus SD
ANOVA: analysis of variance; HF: heart failure; post: after resistance exercise; pre: before resistance exercise; RE: resistance exercise; 1RM: one repetition maximum
p < 0.05
p < 0.001. Nonpaired t-test and two-tailed ANOVA.
Protocol
After familiarization with the knee extension exercise, the participants were positioned on the extension chair with the knee at 90° flexion. Protocol A was performed at 40% of 1RM. After 15 minutes of rest (the pre-exercise period), the cardiovascular evaluation was performed and blood was collected for the evaluation of metabolites. Immediately after these procedures, the participants performed knee extension resistance exercises at 40% of 1RM, consisting of 4 sets of 20 knee extension movements, with a 1-minute interval between sets.
Protocol B was performed at 80% of 1RM. For this, the knee extension exercise consisted of 4 sets of 8 movements, with a 1-minute interval between sets. At the end of these exercises, a new blood sample was taken along with blood pressure (BP) and heart rate (HR) measurements (post-exercise period). Protocols A and B were performed with a 7-day interval between crossover sessions (Figure 1). All participants were instructed not to make use of alcoholic beverages, caffeine nor exercise training.
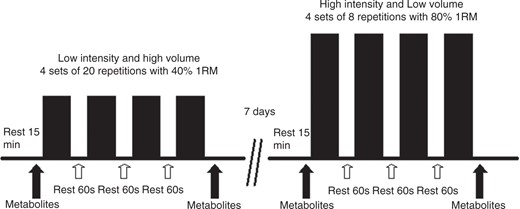
Schematic illustration of the protocol used.
Blood tests
Blood was collected from the cubital vein without the use of a tourniquet. A spectrophotometer (Cobas Mira Plus, Roche®) and a colorimetric enzyme method were used for the analysis of plasma lactate and ammonia, respectively. A 3-mL sample in a fluoridated tube (Katal Biotecnologia® kit) was used for the analysis of lactate (intra-assay coefficient of variation: 0.92%). Another 3-mL sample in a heparinized tube (Sigma Aldrich Chemicals® kit) was used for the analysis of ammonia (intra-assay coefficient of variation: <5%). In addition, plasma potassium was analyzed by flame photometry (Celm® kit) (intra-assay coefficient of variation: <2%). All samples were submitted to immediate centrifugation and refrigeration.
Statistical analysis
The variables were expressed as a mean followed by standard deviation values. The Kolmogorov-Smirnov test was used to determine the normality of the data. Differences between groups in the pre-exercise versus post-exercise periods were evaluated using two-tailed analysis of variance (ANOVA), followed by comparisons using Scheffe’s post hoc test. The paired Student’s t-test was used for comparison of intra-groups, between the pre-exercise and post-exercise periods. The two-tailed non-paired Student’s t-test was used for comparisons between groups. Correlations were determined by calculating Pearson’s correlation coefficients. Results with a value p < 0.05 were considered significant in all the tests.
Results
Characterization of the sample
In the group of patients with HF, their etiology was ischemic, with an ejection fraction between 20% and 40%. The patients had lower body mass index (BMI) values and higher total cholesterol and low-density lipoprotein (LDL) values than the control group. The patients also had lower load values during the knee extension exercise (Table 1). Fifteen patients made use of antiplatelet medication, while three used diuretics. All patients were taking ACE inhibitors and beta blockers.
Physical capacity
The group of HF patients exhibited low tolerance toward effort, with a mean estimated VO2max below the normal values for their age. This group also had reduced hemodynamic and chronotropic responses, and low heart rate recovery (Table 1). This profile was expected in patients with NYHA class II and III heart failure.
Differences between groups
Table 2 displays the levels of ammonia, lactate and potassium at rest, and immediately following the resistance exercises. Significant differences in plasma ammonia were found between groups. Although an increase in ammonia was found in both groups, the resting values were higher in the patient group and the delta values were substantially reduced in that patient group, during both protocols. It should be stressed that the level of ammonia post 40% RE was similar between groups. Moreover, the delta value (Figure 2 (a)) was significantly lower in the patient group when they were submitted to 80% RE, in comparison to 40% RE (32.2 ± 7.3 versus 48.9 ± 9.9; p < 0.001).
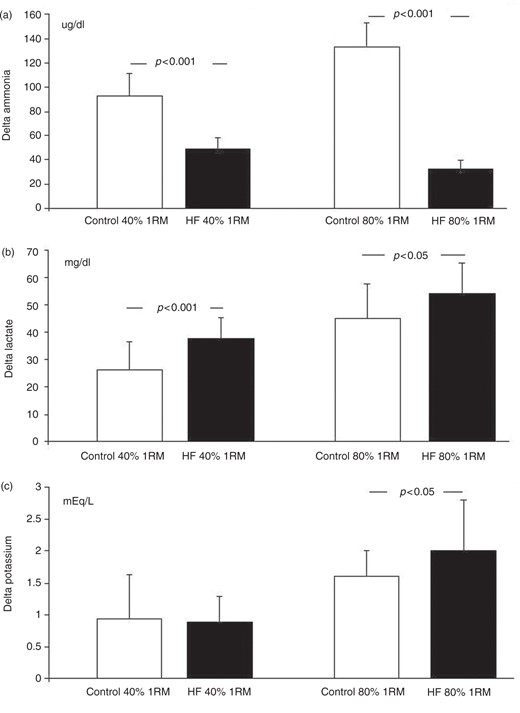
Values means ± SD of the Δ, delta (post – pre) resistance exercise. Note the low values of the ammonia in the group HF, as well as hyperkalemia in the group HF, most of all in the 80% 1RM. Non-paired Student’s t-test. HF: heart failure; 1RM: one repetition maximum.
A significant increase in lactate was found in both groups with both protocols. The delta values (Figure 2(b)) were significantly higher in the patient group, in comparison to the control group, at 40% RE (37.7 ± 7.6 versus 26.3 ± 10.2.; p < 0.001) as well as at 80% RE (54.1 ± 11.2 versus 45.0 ± 12.7; p < 0.05), characterized by greater acidosis in the former group. In comparing between the 80% RE and 40% RE for the patient group, a greater level of acidosis was found when the exercise was of greater intensity and lesser volume (54.1 ± 11.2 versus 37.7 ± 7.6; p < 0.001).
Also, the plasma levels of potassium increased due to the exercise protocols, with no differences observed between groups at 40% RE. However, at 80% RE, the patient group had higher post-exercise values (6.0 ± 0.5 versus 6.7 ± 1.2; p < 0.01) and delta values as well (1.6 ± 0.4 versus 2.0 ± 0.8; p < 0.05). The delta value (Figure 2(c)) in the HF patient group was significantly higher at 80% RE, in comparison to 40% RE (2.0 ± 0.8 versus 0.88 ± 0.4; p < 0.001).
Important correlations were found in the present study (Figure 3). At 40% RE, both the control group and patient group displayed a correlation between delta ammonia and delta lactate (r = 0.67; p < 0.001 and r = 0.77; p < 0.001, respectively). This correlation was maintained in the control group at 80% RE (r = 0.52; p < 0.05).Interestingly, the correlation was not maintained in the patient group (r = 0.28; p = 0.249). No correlations were found between delta ammonia and delta potassium at 40% RE in either group; however, at 80% RE, a strong negative correlation was found between these variables in the patient group (r = − 0.76; p < 0.001).
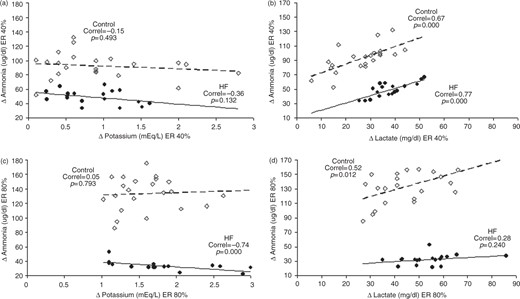
Correlation between Δ Ammonia with the Δ Potassium and Δ Lactate in the resistance exercise, with 40% 1RM (a), (b); and 80% 1RM (c), (d). Controls are represented by (○) and heart failure by (•). Correl is Pearson’s correlation coefficient. Note the strong, negative correlation between Δ Ammonia and Δ Potassium only in the RE 80% 1RM. This data was associated with a loss of correlation between Δ Ammonia with the Δ Lactate, suggesting a failure of purine metabolism due to hyperkalemia. Greek letter delta: symbol for variation; 1RM: one repetition maximum.
The adjustment capacity of the groups and tested variables to the different protocols was assessed through the differences between delta values (for example, Δ ammonia at 80% RE – Δ ammonia 40% RE). No difference was found with regard to lactate, but significant differences between groups were found with regard to both ammonia and potassium (Figure 4). The control group exhibited a mean increase in ammonia formation of 41.0 ± 25.6 ug/dl. Interestingly, the HF patient group exhibited a reduction of −16.7 ± 10.3 ug/dl (p < 0.001) ammonia. Both groups exhibited positive adjustments regarding potassium, but the response found in the HF patient group was greater (0.66 ± 0.6 versus 1.15 ± 0.7; p < 0.05).
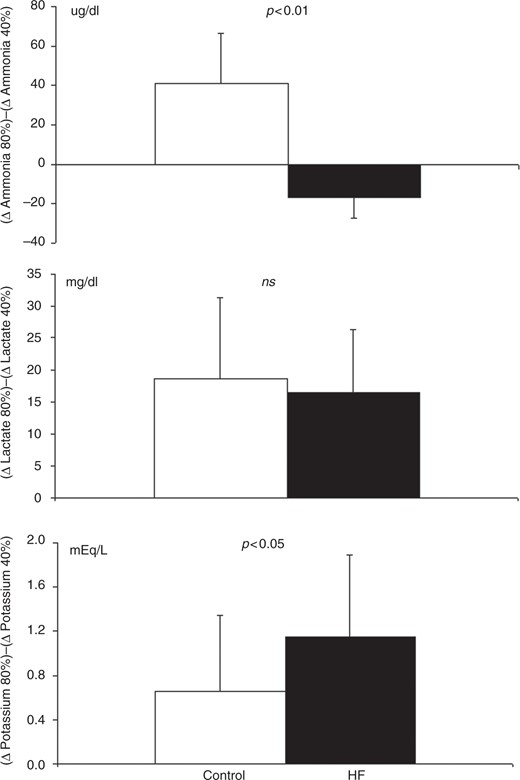
Value means ± SD of the metabolic adjustments due to changing load and volume of the RE (Δ 80% 1RM) – (Δ 40% 1RM) for ammonia, lactate and potassium. Note the failure in the formation of ammonia in the group with HF. Non-paired Student’s t-test. HF: heart failure; RE: resistance exercise.
Other important correlations were found. VO2max was positively correlated with delta ammonia at 80% RE in the patient group alone (r = 0.53; p < 0.05). Also, Δ ammonia 80% – Δ ammonia 40% was positively correlated with VO2max and BMI in the patient group alone (r = 0.79; p < 0.001 and r = 0.67; p < 0.01, respectively).
Discussion
In this study, the main findings were that there was less formation of ammonia in the HF group when submitted to exercise of greater intensity, and that there may be a possible association between hyperkalemia and a low formation of ammonia.
This study confirms previous findings that metabolic abnormalities in HF go beyond the visible response to physical exercise, as in these patients, plasma ammonia levels became increased even when such individuals were at rest.9 The mechanisms involved in hyperammonemia at rest are not clear; however, in HF, respiratory disorder through the ergoreflex could partially be explained by this hyperammonemia at rest. When Vanuxen et al. analyzed ammonia levels and ventilation in healthy individuals, triathletes and in patients with lactate production deficiency (McArdle’s disease) who were submitted to physical exercise; strong, significant correlations were found between the variables, suggesting that ammonia plays an important role in the regulation of ventilation, especially in situations of glycolytic metabolic deficiency.17
The different increases in plasma ammonia at different intensities of RE are known to exist in healthy individuals, but were reported with different exercise protocols than those employed in the present study. One study compares the plasma lactate and ammonia responses between RE of leg-presses with 3 sets of 5 repetitions, and the same exercise with 15 repetitions, finding a significant increase in the latter protocol, thus demonstrating the impact of the number of repetitions done.18 The present study differed from this finding. However, both the protocols in the study cited involve high intensity (a maximal load) and the work volume is not taken into account. Another important variable is likely the rest interval between sets. It is known that the recovery of CP stocks following exercise exhibits a biphasic behavior with a fast component (≅45 s), possibly controlled by the amount of ADP, plus in the slow component (≅340 s) the normalization of intracellular pH seems to be the main determinant.19 In the present study, the same recovery time between exercise sets (60 s) was used with both protocols.
The control group exhibited a greater delta increase in plasma ammonia with the high-intensity RE, in comparison to low-intensity RE. During high-intensity RE, there is an important participation of the type II muscle fibers, which would explain this behavior, as greater ammonia formation is reported in fast-twitch fibers, due to a low aerobic capacity and high degree of AMP deaminase activity.5,7,20
The considerable participation of anaerobic metabolism during muscle work in patients with HF is duly documented. In healthy individuals, there is a correlation between the levels of lactate and ammonia, as both represent anaerobic metabolism. In the present study, this same correlation was found in the control group with both RE protocols, but it was only found with the low-intensity, high-volume protocol in the HF patient group. The loss of correlation during high-intensity RE, which was accompanied by lowered ammonia formation, suggested there was a purine metabolism failure in HF patients.
During exercise, the load percentage determines muscle contraction intensity and consequently, intramuscular pressure. An increase in intramuscular pressure is a common phenomenon in isometric and isotonic resistance exercise with loads greater than 80%: values as high as 570 mmHg have been reported for athletes, during maximal contraction.21 This increase results in a significant occlusion of the blood vessels, reducing or even obstructing blood flow in the contracted muscle, resulting in considerable anaerobic activity. In this situation of low blood flow and the important participation of type II muscle fibers, a significant increase in plasma ammonia is a common finding and is mainly explained by the low aerobic capacity and high degree of AMP deaminase activity in those active type II fibers.5,7,20 However, in our study, greater ammonia formation during high-intensity exercise was not found in the HF group. Studies suggest that an increase in 5’-nucleotidase activity and consequent increase in plasma adenosine in HF patients causes a deviation of the purine metabolism in favor of both greater adenosine formation and lesser ammonia formation.22,23 As hyperammonemia at rest is correlated with HF severity, the same may occur with plasma adenosine, following physical exercise.9,22
Some alterations found in HF should be discarded and others should be discussed as possibly responsible for the reduced formation of ammonia during high-intensity RE. A low perfusion and reduced vasodilatation response to physical exercise, together with the high percentage of type II muscle fibers in HF, do not explain less ammonia formation, as these alterations would separately contribute toward an increased response; however, an increase in 5’-nucleotidase activity, reduced CP reserve and hyperkalemia might explain the chemical exercise response behavior that we observed.
With low-intensity, high-volume RE, ATP levels are maintained by the oxidative pathway and, especially, anaerobic glycolysis, with CP reserves having little importance; however, with the exercise intensity increasing to greater than 75% of 1RM, CP becomes fundamental to the re-synthesis of ATP,24 which consequently allosterically blocks AMP deaminase, thereby avoiding the formation of ammonia.25 Thus, the low reserve and rapid depletion in CP that is found in HF8 could explain the lowered ammonia formation during high-intensity exercise. It should be stressed that a significant, positive correlation was found in the present study between BMI and the capacity to form ammonia, with the increase in RE intensity among the patients with HF, suggesting that an individual’s physical status, likely reduced muscle mass, may exert an influence over the metabolism of purines.26
Previously, hyperkalemia was reported in patients with HF during increasing exercise, and this is often related to fatigue, reaching the same plasma levels at a work intensity that is 40% lower than that of healthy individuals.16 The increase in extravascular potassium, stemming from muscle contraction, plays an important role in exercise-induced vasodilatation; but hyperkalemia triggers a contrary response, with significant vasoconstriction.27 It has been shown that muscle alterations caused by the increase in potassium are dependent on concentration and exposure time.28 An interesting characteristic of fatigue induced by hyperkalemia is the more intensive reduction in the excitability and contractility of the type II muscle fibers;29,30 thus, the negative correlation that we found only in the group with HF during high-intensity RE, may be explained by a lesser activation of the type II fibers in HF than in controls, resulting in less ammonia formation. Such a hypothesis would discard an alteration in the purine metabolism, as the lowered formation of ammonia could be explained by less participation of type II fibers alone. It should be borne in mind that the venous concentration of potassium does not directly reflect the interstitial concentration, but there is some parallelism in the behavior of the two, with interstitial K+ exceeding plasma levels by 4 to 8 fold.31,32
It was recently demonstrated that patients with HF who submitted to optimized medication therapy exhibited dysfunctions in the supply and use of O2 during high-intensity exercise (70–80% maximal work).33 This correlation may be explained by the important role of the O2 supply in skeletal muscle recovery, as observed in knee extension RE, as the recovery of deoxygenated hemoglobin is slower than the re-synthesis of CP.34 Studies report that there is a correlation between aerobic capacity and the re-synthesis of CP in high-intensity exercise.35 This correlation could suggest that the formation of ammonia is lower in individuals with greater aerobic capacity, due to their satisfactory re-synthesis of ATP, through the adequate re-synthesis of CP. In our present study, however, we found a positive correlation between VO2max and ammonia formation in the group of HF patients, during high-intensity RE. This unexpected correlation may be explained by the characteristics of purine metabolism disorder in HF. In the purine cycle, there is a deviation of the reaction in favor of greater adenosine formation, due to the increased action of 5’-nucleotidase. Concomitantly, there is a reduction in AMP deaminase activity, which consequently leads to decreased ammonia formation.10,23 This behavior becomes increased with the greater severity of the functional class. Thus, the greater formation of ammonia in patients with higher VO2max values would reflect a degree of relative integrity of their purine metabolism.
Limitations
During the application of the protocols, three patients had to repeat the procedure twice and one repeated the procedure three times, due to technical difficulty during the collection of their blood samples. We chose to repeat the protocol on another occasion, with a minimal 1-week interval.
Hepatic metabolism and renal clearance are determinants of plasma ammonia and lactate and these were not assessed in detail in our study; however, the group did not exhibit impaired liver or kidney function in the commonly-used laboratory tests.
Conclusions
Our study results confirm the hypothesis that purine metabolism disorder in patients with HF is also present during resistance exercise. This disorder is accentuated with an increase in exercise intensity, but not the volume of work. These findings suggested that hyperkalemia plays an important role in purine metabolism disorder in patients with HF. Further studies are needed in order to gain a better understanding of these alterations, as well as the impact of different physical exercise modalities and their repercussions on the performance of the activities of daily living.
Acknowledgements
The authors would like to thank the participants in the present study and all members of the Physiotherapy Department of the Hospital Geral do Grajau who either directly or indirectly assisted in the present study.
Funding
This work was supported by the Brazilian national research financing agency, Conselho Nacional de Desenvolvimento Científico e Tecnológico (CNPq grant number 14314420065).
Conflict of interest
None declared.

Comments