


Abstract
The aim of this study was to evaluate the efficacy of a long-term secondary prevention programme following inpatient cardiovascular rehabilitation on cardiovascular risk and health-related quality of life in a cohort of middle-aged (≤58 years) coronary artery disease (CAD) patients of low educational level compared to usual care.
The study included 600 patients with CAD, with 271 in the intervention group (IG) and 329 in the control group (CG). The average age was nearly 50 years in both groups, nearly 90% were male, and 77% had less than 10 years of school education. No significant differences existed between the groups at baseline. Both groups had a 3-week comprehensive cardiovascular inpatient rehabilitation programme at the beginning, the intervention consisted of one further rehabilitation session in hospital after 6 months and regular telephone reminders over a period of 36 months. Analyses were conducted on an intention-to-treat basis. To evaluate the individual risk level, we used the PROCAM score and intima-media thickness (IMT) was measured at the common carotid artery on both sides following international standards. Health-related quality of life was assessed with the EUROQOL and HADS.
Patients in the IG showed better 3-year risk profile outcomes. The PROCAM score increased by 3.0 (IG) and by 3.7 (CG) from the beginning to after 3 years (p > 0.05 intention-to-treat). The average IMT increased by 0.04 mm in the CG and was reduced by 0.03 mm in the IG (p = 0.014 for the difference). The IG had a significant improvement in health-related quality of life. Mortality, myocardial infarction, and stroke were not different although ‘other cardiac events’ (cardiac surgery or intervention) were significantly lower in the IG than the CG patients (p < 0.05).
This long-term secondary prevention programme with inpatient rehabilitation at the beginning and telephone reminder for a 3-year period was successful. There were significant differences in health-related quality of life between the IG and CG, despite the relatively positive outcomes in the CG. In this low-education (predominantly male), middle-aged cohort, the positive impact on cardiovascular risk was pronounced in the high-risk subgroup (PROCAM 10-year risk 10–40%).
Introduction
There is considerable unmet potential to improve secondary prevention of coronary artery disease (CAD).1–5 Despite falling mortality in CAD patients over the last 20 years, the success of preventive strategies has been limited.6 In EUROASPIRE, only cholesterol was lowered significantly; whereas all other risk factors could not be controlled.7 Diabetes and metabolic syndrome are growing problems in an increasingly obese society8,9 especially in the low-education population with low socioeconomic status.10 Despite good clinical evidence for the positive role of rehabilitation in the course and prognosis of CAD, this service is underused.11 The evidence for positive effects of disease management programmes for CAD is sparse.12 Thus, secondary prevention in CAD remains an unresolved issue. To our knowledge there are no data on special programmes for patients with low education. In Germany the success of short-term (3–4 weeks) in- or outpatient rehabilitation is good but the benefits are lost in the years after rehabilitation.13
The primary objective of this study was to evaluate the efficacy of a long-term secondary prevention programme following inpatient cardiovascular rehabilitation on cardiovascular risk profile. Secondary objectives were health-related quality of life (HRQL), and cardiovascular events (morbidity and mortality). The focus was on a cohort of low educational level compared to usual care.
Design and methods
Design
A prospective single-centre randomized controlled trial was conducted in order to evaluate the efficacy of a long-term secondary prevention programme in low educational level patients with CAD. Inclusion criteria included being younger than 58 years (to be sure to get the insurance data) and CAD proven by angiography. Patients with congestive heart failure (NYHA III and IV), severe lung disease (FEV1 < 35%), life-limiting disease, or severe disability (in terms of mobility or cognition) were excluded. All patients provided written informed consent before being enrolled in the study. The study protocol was approved by the ethics commission of the Medical Association of North Rhine.
Patients were randomly assigned by 1:1.25 ratio to either the intervention group (IG) or the control group (CG) in order to outweigh greater expected dropout in the CG using a computer-generated list stratified by gender. The randomization allocation list was concealed from the recruiters. Figure 1 provides a flow chart of the study allocation.
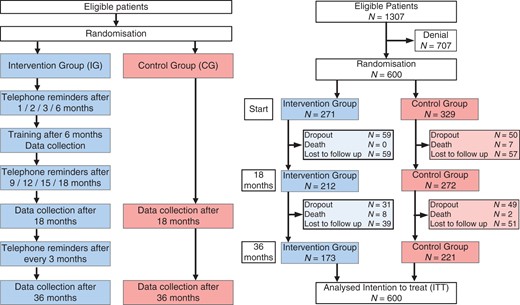
Study flow chart.
Measurements
PROCAM score (primary outcome), HRQL, intima-media thickness (IMT), clinical status, and cardiovascular events (secondary outcomes) were assessed at baseline (at the end of the in-hospital phase). Thereafter PROCAM score, HRQL, intima-media thickness, clinical status, cardiovascular events, and mortality data were collected at 6 (only the IG on the occasion of the rehabilitation day), 18, and 36 months. The PROCAM score14 is validated for primary prevention, but given the lack of secondary prevention scoring tools we decided to use this tool. A 10-year cardiovascular event rate of 1–10% indicates low risk, and 10–40% indicates high risk. IMT was measured 1 cm proximal to the bulb on the posterior side of the common carotid on each side with a Philips device (Hewlett Packard Sonos 5500 high-resolution B-mode ultrasound scanner equipped with a 7.5 to 12-MHz linear transducer). The scans were made by one experienced investigator, stored digitally, and the measurement was evaluated by two independent, experienced investigators (unaware of the clinical characteristics of the patients). The two results were averaged and the data of both sides pooled.15 Echocardiography was done with the same device (5-MHz transducer) by experienced investigators and judged semiquatitatively by ‘eyeballing’ ejection fraction as normal, mild, moderate, or severe left ventricular dysfunction. The EUROQOL 5 and visual analogue scale were used to evaluate HRQL, and the HADS was administered.16,17 Cardiovascular and other clinical events were recorded during the clinical evaluation at months 18 and 36. Mortality was checked by insurance data at 18 and 36 months and at the index date of 31 December 2010.
Intervention
Both groups (IG and CG) had 3 weeks of in-patient cardiac rehabilitation. They had the same amount of psychological and educational support. Physical training consisted of ergometry, walking, swimming, and resistance exercise. On average there were three units of exercise per day (30–60 minutes per unit). The physical activity was controlled for heart rate (0.6 × difference maximum symptom limited and resting heart rate added to the resting heart rate) The intervention consisted of an additional rehabilitation day at 6 months after the 3-week inpatient cardiovascular rehabilitation. After laboratory and treadmill exercise testing, there were group sessions (including risk factor management, coping strategies, diabetes, and smoking cessation) and individual counselling in fitness level (treadmill result) and the PROCAM score (visualized in red/yellow/green) was discussed. In addition there were telephone consultations over a period of 36 months (months 1, 2, and 3, rehabilitation day months 6, and subsequently quarterly, for 20 minutes on average). The telephone protocol involved assessment of events, blood pressure, body mass index, and medications. The quantity of physical activity was recorded. Particular emphasis was placed on developing specific plans and goals for each individual patient and the extent to which such goals had been met was used as the basis of discussion in the next telephone consultation. This supportive aspect was important and one non-physician health professional interviewer, with a single substitute when necessary, provided good continuity of care. The CG had ‘usual care’ by their physicians without contact to the hospital. We have no information on the frequency and quality of usual care.
Statistical analyses
The study was powered (95%) for the primary outcome (n = 275, p = 0.05, Δ/σ ∼ 0.36). Analyses were conducted on an intention-to-treat basis (ITT). To conform to ITT principles, outcome scores missing because of loss to follow up were entered using the last observation carried forward method. Baseline characteristics of IG and CG were compared using Pearson chi-squares tests for categorical factors and the Mann–Whitney U-test for continuous factors. The estimated 10-year risk of cardiovascular disease was calculated on the basis of the PROCAM risk score. The Mann–Whitney U-test was used for statistical comparison of the estimated 10-year risk of both groups. The significance level for all tests was set at 0.05 and all tests for continuous variables were two-tailed. All statistical analyses were performed using SPSS version 17 for Windows.
Results
Patients were recruited between September 2004 and November 2005 and data collection was completed in September 2008. There were 1307 eligible patients who fulfilled the inclusion criteria and 600 declared informed consent and were randomized to either the IG (n = 271) or CG (n = 329). In the IG, 90 patients were lost to follow up; in the CG, 99 were lost to follow up (Figure 1). The average age was nearly 50 years in both groups. Nearly 90% were male and 77% had less than 10 years of formal education. No significant differences existed between the groups in terms of clinical parameters (except slightly for body mass index, triglycerides, and blood pressure) and baseline EUROQOL and HADS. Baseline ventricular function was evaluated by echocardiography semiquantitatively, with no significant differences between the groups (Table 1).
Baseline data
| Characteristic | Control (n = 329) | Intervention (n = 271) |
|---|---|---|
| Age (years) | 49.1 ± 5.4 | 49.2 ± 5.7 |
| Sex (male) | 288 (87.5) | 246 (90.8) |
| Education | ||
| ≤10 years | 291 (88.4) | 244 (90) |
| 10–13 years | 21 (6.4) | 12 (4.4) |
| >13 years | 5 (1.5) | 8 (3) |
| Not specified | 12 (3.6) | 7 (2.6) |
| Coronary arteries affected | ||
| 0 | 3 (0.9) | 4 (1.5) |
| 1 | 141 (43.3) | 99 (37.5) |
| 2 | 86 (26.4) | 88 (33.3) |
| 3 | 96 (29.4) | 73 (27.7) |
| Left ventricular ejection fraction | ||
| Normal | 212 (64.4) | 174 (64.2) |
| Mild dysfunction | 64 (19.5) | 51 (18.8) |
| Moderate dysfunction | 41 (12.5) | 36 (13.3) |
| Severe dysfunction | 12 (3.6) | 10 (3.7) |
| Coronary artery bypass graft | 67 (20.4) | 54 (19.9) |
| PTCA/stent | 231 (70.2) | 191 (70.5) |
| Myocardial infarction | 154 (46.8) | 123 (45.4) |
| Systolic blood pressure (mmHg)a | 120.4 ± 12.7 | 118 ± 12.8 |
| Diastolic blood pressure (mmHg)a | 75.6 ± 8.2 | 73.8 ± 8 |
| Resting heart rate (bpm) | 70.3 ± 11.1 | 70.1 ± 10 |
| HDL-C (mg/dl) | 42.1 ± 11.5 | 42.4 ± 12.8 |
| LDL-C (mg/dl) | 83.2 ± 34.5 | 78.4 ± 29 |
| Triglycerides (mg/dl)a | 153.9 ± 90.1 | 146.9 ± 96.3 |
| Fasting glucose (mg/dl) | 97.5 ± 20.2 | 97.4 ± 20 |
| HbA1c (%) | 6.1 ± 0.7 | 6 ± 0.7 |
| C-reactive protein (mg/dl) | 5.6 ± 7.7 | 5.3 ± 6.8 |
| Body mass index (kg/m2)a | 28.6 ± 4.6 | 27.6 ± 3.8 |
| Smoker | 83 (25.2) | 54 (19.9) |
Continuous variables are reported as mean ± standard deviation (SD); categorical variables are presented as number and (%). aChi-square test and Wilcoxon–Mann–Whitney Test for discrete and continuous variables, respectively, p < 0.05 for comparisons of characteristics between groups at baseline data.
CV risk
The results of the 18-month visit did not differ significantly from the 3-year visit and therefore these data are not presented. The PROCAM score increased by 3.0 (from 3.0 to 6.0% for the IG) and by 3.7 (from 3.6 to 7.3% for the CG) between baseline and 3 years (p > 0.05; Table 2). The subgroups in the PROCAM score are of particular interest. In the high-risk groups (10-year risk 10–20% and 20–40%) the rise in score in the IG was only half that of the CG (Figure 2). Physical activity included occupational and leisure-time physical activity and was quantified in hours per week. The results after 18 months of intervention between the intervention and control groups were similar (IG with 15 hours and CG with 16). After 3 years of follow up, physical activity showed better increase in the IG (13.25 h/week) than in the CG (7 h/week; p = 0.083).
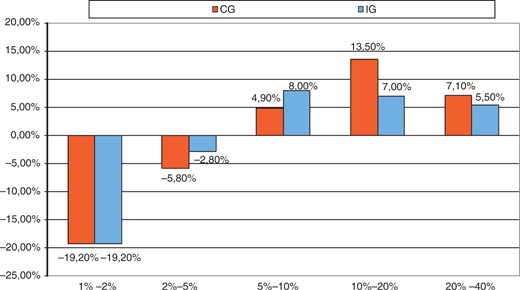
Changes in percentage of patients for different risk categories: PROCAM score after 36 month.
CG, control group; IG, intervention group.
PROCAM Score
| Characteristicsa,b | Baseline | After 36 months | Significancec | |
|---|---|---|---|---|
| PROCAM Score, % | CG | 3.61 ± 3.26 | 7.28 ± 6.80 | p > 0.05 |
| IG | 3.01 ± 2.50 | 5.97 ± 6.06 | ||
| Characteristicsa,b | Baseline | After 36 months | Significancec | |
|---|---|---|---|---|
| PROCAM Score, % | CG | 3.61 ± 3.26 | 7.28 ± 6.80 | p > 0.05 |
| IG | 3.01 ± 2.50 | 5.97 ± 6.06 | ||
aContinuous variables are reported as mean ± standard deviation (SD). bWilcoxon Mann Whitney Test for continuous variables, p < 0.05 for comparisons between groups at baseline and after 36 months. cFirst determinate the difference between data at Baseline and after 36 months than check differences between groups by Wilcoxon–Mann–Whitney Test in significance.
The medication did not differ between groups, either at baseline or at 36 months (Table 3). The high rate of adherence to medication after 3 years (about 90% for Acetylsalicylic acid, beta-blockers, and Cholesterol Synthesis Enzyme (CSE) inhibitors), even in the CG, was noteworthy. As a result of the high variability of medication prescription, we added a per-protocol analysis. There was no significant difference between both groups.
Medication change over 36 months
| Characteristic | Baseline | ITT at 36 months | PP at 36 months | ||
|---|---|---|---|---|---|
| n (%) | n (%) | p-value | n (%) | p-value | |
| Acetylsalicylic acid | |||||
| Control | 311 (94.5) | 307 (93.3) | NS | 201 (91.0) | NS |
| Intervention | 254 (93.7) | 250 (92.3) | NS | 159 (91.9) | NS |
| ACE inhibitor | |||||
| Control | 243 (73.9) | 223 (67.8) | NS | 146 (66.1) | NS |
| Intervention | 204 (75.3) | 188 (69.4) | NS | 117 (67.6) | NS |
| AT1 antagonist | |||||
| Control | 15 (4.6) | 23 (7.0) | NS | 17 (7.7) | NS |
| Intervention | 14 (5.2) | 18 (6.6) | NS | 15 (8.7) | NS |
| Beta-blockers | |||||
| Control | 312 (94.8) | 312 (94.8) | NS | 212 (95.9) | NS |
| Intervention | 261 (96.3) | 247 (91.1) | NS | 159 (91.9) | NS |
| CSE inhibitor | |||||
| Control | 297 (90.3) | 302 (91.8) | NS | 202 (91.4) | NS |
| Intervention | 243 (89.7) | 235 (86.7) | <0.05 | 153 (88.4) | NS |
p-values for change from baseline over 36 months
ACE, angiotensin-converting enzyme; CSE, cholesterol synthesis enzyme; ITT, intention-to-treat; PP, per-protocol.
The average IMT increased by 0.04 mm in the CG and there was a reduction of 0.03 mm in the IG (p = 0.014; Table 4).
Thickness of intima media (left + right, mm)
| Characteristicsa,b | Baseline | After 36 months | Significancec | |
|---|---|---|---|---|
| IMT pooling (left + right side) | CG | 1.44 ± 0.33 | 1.48 ± 0.35 | p = 0.014 |
| IG | 1.50 ± 0.33 | 1.47 ± 0.31 | ||
| Characteristicsa,b | Baseline | After 36 months | Significancec | |
|---|---|---|---|---|
| IMT pooling (left + right side) | CG | 1.44 ± 0.33 | 1.48 ± 0.35 | p = 0.014 |
| IG | 1.50 ± 0.33 | 1.47 ± 0.31 | ||
aContinuous variables are reported as mean ± standard deviation (SD). bWilcoxon Mann Whitney Test for continuous variables, p < 0.05 for comparisons between groups at baseline. cFirst determinate the difference between data at Baseline and after 36 months than check differences between groups by Wilcoxon–Mann–Whitney Test in significance.
Health-related quality of life
The IG showed significantly better outcomes in EUROQOL and HADS (Table 5). The difference in the visual analogue scale of EUROQOL in favour of the IG was highly significant (p = 0.000) with significance also in the five-dimension questionnaire (p = 0.052). The differences in the HADS were significant (anxiety p = 0.014; depression, p = 0.000).
EUROQOL and HADS: baseline and 36 months values by randomization group
| Characteristicsa | Baseline | After 36 months | Significanceb | |
|---|---|---|---|---|
| EQ-5D | CG | 75.9 (17.3) | 75.5 (18.7) | p = 0.052 |
| IG | 76 (16.8) | 78.6 (16.9) | ||
| EQ-5D VAS | CG | 61 (18.5) | 64.5 (18.9) | p = 0.000 |
| IG | 61.1 (18.5) | 72.2 (18.4) | ||
| HADS anxiety | CG | 7.7 (4.2) | 7.4 (4.8) | p = 0.014 |
| IG | 7.5 (4.1) | 6.6 (4.1) | ||
| HADS depression | CG | 6.0 (4) | 5.7 (4.3) | p = 0.000 |
| IG | 5.6 (3.8) | 4.6 (4.1) | ||
aContinuous variables are reported as mean ± standard deviation (SD); categorical variables are presented as number and (%). bFirst determinate the difference between data at baseline and after 36 months than check differences between groups by Wilcoxon–Mann–Whitney Test in significance.
CV events and mortality
As can be seen in Table 6, the IG and CG mortality (3- and 5-year), myocardial infarction, and stroke differences were not statistically significant. Other cardiac and non-cardiac events were significantly different (p < 0.05) between groups.
Clinical events during study period
| Event | Control (n = 272) | Intervention (n = 211) | p-value |
|---|---|---|---|
| Death during study perioda | 9 (2.4) | 8 (2.6) | NS |
| Death after 5-year follow upa | 19 (5.8) | 12 (4.4) | NS |
| Myocardial infarctionb | 54 (19.9) | 34 (16.1) | NS |
| Strokeb | 3 (1.1) | 2 (0.9) | NS |
| Other cardiac eventsb | 62 (22.8) | 28 (13.3) | <0.05 |
| Other non-cardiac eventsb | 52 (19.1) | 51 (24.2) | <0.05 |
Values are n (%)
Data from 600 patients (329 in control group and 271 in intervention group) after 3- and 5-year follow up
Data from 483 patients after baseline.
Cardiovascular events (myocardial infarction, stroke, and death) had occurred in 44 patients in the IG (14%) and in 66 in the CG (20%, p > 0.05) after 3 years (Table 6). Other cardiac events (coronary artery bypass graft surgery, intervention, and implantation of devices) occurred significantly more often in the CG (22.8%) than in the IG (13.3%) (p < 0.05). Non-cardiac events (i.e. degenerative, such as a herniated disk, or traumatic, such as fractures with hospitalization) were reported for 51 patients of the IG (24.2%) and 52 patients of the CG (19.1%) again with statistically significant differences between the groups (p < 0.05; Table 6).
During the 5 years to 31 December 2010, there were 12 deaths (4.4%) in the IG (four cardiac, four probably cardiac, one within a complication after a heart catheter, three carcinomas) and 19 (5.8%) in the CG (10 cardiac, five probably cardiac, four carcinomas) (p > 0.05; Table 6).
There were no reports of adverse side effects of the intervention. Analysis of the premature death group during the study period showed no significant differences in biological or socioeconomic characteristics, cardiovascular risk profiles, or severity of disease.
Discussion
The aim of this study was to evaluate the efficacy of a multiple follow-up secondary prevention programme, partly telemedical care, after inpatient cardiovascular rehabilitation on cardiovascular risk profile (primary objective), health-related quality of life, and cardiovascular events (morbidity and mortality) (secondary objectives) in patients with low educational status.
In this middle-aged, largely low-education cohort (less than 10 years of formal school education), HRQL was significantly better in the IG than in the CG group. Thus the benefit in low-education patients is pronounced for HRQL, what means this simple telephone-based intervention affects the emotional aspect more than the somatic, which may have influenced the good adherence. This seems to be able to perpetuate the positive effects of in-hospital rehabilitation for a long period by regular ‘boostering’.
As a marker for long-term CV risk, there was a significant difference in the development of IMT over time (progression in the CG, reduction in the IG). We observed a clear, but non-significant trend, towards benefit in terms of PROCAM score in the IG that had 1 day of in-hospital education after 6 months and 14 telephone follow-up sessions. The beneficial effect was pronounced in the high-risk groups (PROCAM score 10–20% and 20–40%). Thus in the future, these multiple contacts should be focused on low-education patients with higher risk.
In comparison to other reported data, the adherence to medication was very high, even in the CG. Thus the CG seemed to be surprisingly well motivated, which could have been associated with the better than expected outcomes in this group, thus making the difference between the CG and IG groups smaller than expected. Although there was no contact other than at 18 months (control visit) and 36 months (last visit), the values of the cardiovascular risk profile were better than the values from participants in the German section of the MONICA study.18
We think that this can be a result of better adherence to medication in this low-education cohort. Maybe lifestyle factors are not reflected sufficiently in the PROCAM score considering the ‘high-risk’ lifestyle in patients with low socioeconomic status. Although cardiovascular events and mortality tended to be lower, the study was not powered for morbidity and mortality. Other national studies show different results. These studies recruited fewer patients and did not endure for more than 18 months.19,20
The telemedical programme, like here, can be a successful instrument in the health care of secondary prevention risk intervention. Studies show significantly better results under telemedical care compared with patients without this instrument.21–24
The limitation of the study was that the data for the ITT analysis were incomplete (only data for mortality were complete). Nevertheless, two-thirds of the participants completed the study protocol. Another limitation was the low number of female participants, preventing generalization of the outcomes to women. This phenomenon is a result of the special German system of pension funding, which selects younger patients of low educational level still active in the working process (the primary aim of rehabilitation being return to work). This system was the cause for restricting inclusion to age lower than 58 years thus making the differences in hard clinical end points not significant.
Strengths of the study include the unique low-education cohort, homogeneity of the whole study group, and the consistent results (PROCAM, IMT, EUROQOL, HADS, cardiovascular events, mortality). The results extend the findings from other programmes. Further data should be gained by registries to verify the results in the ‘normal clinical practice’. Provision of this intervention for low-education, high-risk patients is strongly supported by our data. The economic benefits could be of high political relevance, given the inequities in the healthcare system.
Conclusion
We conclude that, particularly for these unique low-education CAD patients with high risk (PROCAM score 10–40%), this long-term secondary prevention programme with multiple individual, trusted contacts (‘boostering’) aiming at lifestyle factors is feasible and successful in terms of patient outcomes.
Acknowledgements
This trial has been registered at Current Controlled Trials (ISRCTN 15954342).
Funding
This research was supported by REFONET (www.refonet.de), the rehabilitation research network of Deutsche Rentenversicherung Rheinland, Germany.
Conflict of interest
None declared.

Comments