


Abstract
To identify the types of cardiovascular disease (CVD) and stroke prevention educational–behavioural programmes for people from culturally and/or linguistically diverse (CALD) backgrounds and investigate their effect on CVD risk factors and disease knowledge.
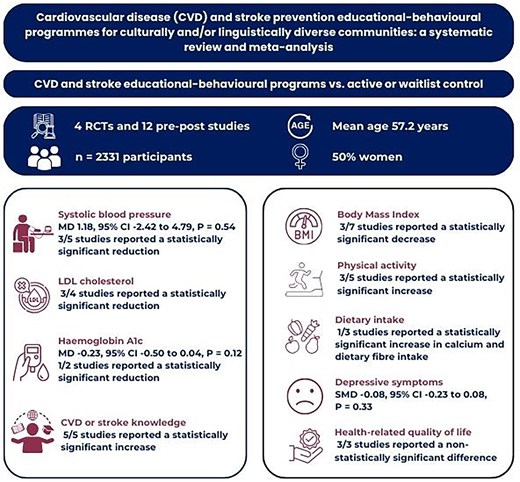
Four electronic databases were searched from inception to September 2023. Mean difference (MD) and standardized MD was calculated using random effects model, and heterogeneity were assessed using the I2 statistic. Studies that were not included in the meta-analysis were narratively described. The Cochrane Risk of Bias tool and Joana Briggs Institute Critical Appraisal checklist were used to assess the quality of the included studies. Sixteen studies originating from USA and UK (4 RCTs and 12 quasi-experimental pre-post studies) with n = 2331 participants (mean age 57.2 years, 50% women) were included. The programmes were multi-component, 15 of which were culturally adapted and 1 was co-designed. Most were delivered face-to-face in groups. In contrast to the results among the pre-post studies, the pooled analysis showed that educational–behavioural programmes may have little to no effect on SBP (MD 1.18 mmHg, 95% CI −2.42 to 4.79) and HbA1c (MD −0.29%, 95% CI −0.89 to 0.32). The results for LDL cholesterol, BMI, physical activity and dietary intake were also mixed except for CVD or stroke knowledge which demonstrated statistically significant improvements after the intervention.
The effect of educational–behavioural programmes on CVD risk factors is inconclusive but may improve CVD or stroke knowledge. Co-designing programmes underpinned by behaviour change theories/techniques with stakeholders and target CALD communities may enhance their potential impact. Future studies should use more rigorous study design i.e. RCTs, valid and reliable outcome measures to reduce inherent bias and strengthen the evidence base for the effectiveness of these programmes.
Lay Summary
Cardiovascular disease (CVD) and stroke prevention educational–behavioural programmes may reduce risk factors and change behaviours among culturally and/or linguistically diverse (CALD) individuals.
The effect of educational–behavioural programmes on CVD risk factors is inconclusive but may improve CVD or stroke knowledge.
There is a lack of robust evidence to support the provision of these programmes for CALD individuals emphasising the need for more rigorous studies to strengthen the evidence base for their effectiveness.
Introduction
Over the past five decades there has been an increase in the number of international migrants worldwide.1 In 2020, approximately 281 million people are living in a country other than their countries of birth.1 UK is one of the world’s ‘immigration nations’ along with Australia, New Zealand, Canada and USA.1 Figures from the UK 2021/22 census revealed that 16% (10.7 million) of the population was born overseas.2 The term ethnicity is widely used in the UK. Internationally, other terms, such as racial and ethnic minorities (widely used in USA); BAEM (Black and Asian Ethnic Minority); culturally and/or linguistically diverse (CALD, commonly used in Australia); minority ethnic groups; race; and specific names of ethnic backgrounds such as Asian, African, and Hispanic might replace this term.3 The term CALD which describes individuals who have specific cultural and/or linguistic affiliation with their country of birth, ancestry, ethnic origin, religion, preferred language, or language spoken at home, or because of their migrant parents’ identification4 is all encompassing and will be used throughout this paper.
Cardiovascular disease (CVD) remains the leading cause of death worldwide, claiming 17.9 million lives each year.5 In the UK, CVD accounted for 27% of all deaths which is equivalent to ≥170 000 deaths annually.6 The risk for CVD disproportionately affects people from CALD communities.7 These communities face unique challenges, including language barriers, prejudice, discrimination, and racism which can lead to suboptimal risk factor reduction and prevention of CVD.
Primary prevention plays a crucial role in reducing the morbidity and mortality associated with CVD.8 The World Health Organization estimates that over 75% of premature CVD is preventable with effective reduction of leading modifiable risk factors such as hypertension, dyslipidaemia, diabetes, obesity, tobacco smoking, unhealthy diet, and sedentary lifestyles.9 Educational–behavioural programmes are a foundational component of the primary prevention of CVD.10 These programmes aim to improve knowledge and awareness of cardiovascular risk factors, promote behaviour change, and empower individuals to adopt healthy lifestyles.11 They are delivered through various channels and approaches, such as mobile applications, face-to-face seminars, text messaging, internet-based tools, and written educational materials such as flyers and booklets.
Several systematic reviews have investigated the effect of educational–behavioural interventions in predominantly White populations, demonstrating mixed results.12–14 However, the impact of these interventions in CALD communities has not been widely investigated. In recent years, there has been increased attention to developing culturally and/or linguistically accessible educational–behavioural interventions. Therefore, the synthesis of published studies is warranted to enhance our understanding of the types of intervention, their components, mode of delivery and effect on modifiable CVD risk factors in this population.
The aim of this systematic review is to identify the types of educational–behavioural interventions, their core components and mode of delivery for people from CALD communities and quantify their effect on modifiable risk factors for CVD.
Methods
The systematic review is reported following the Preferred Reporting Items for Systematic Reviews and Meta-Analyses (PRISMA) statement.15 The protocol was prospectively developed and registered in PROSPERO on 15 October 2023 (CRD42023466853).
Eligibility criteria
We included randomized controlled trials (RCTs) of any design (e.g. parallel, cluster, and crossover), and quasi-experimental pre-post studies that evaluated CVD and/or stroke prevention educational–behavioural programmes for adults with risk factors for CVD or stroke but have not yet developed CVD or had a stroke from CALD backgrounds. Only studies in the English language were included. The main component of the programmes we included was CVD or stroke prevention education i.e. ‘what is CVD or stroke?’ and ways to prevent it. Multi-faceted programmes with behaviour change strategies e.g. goal setting, self-monitoring, and/or developed according to behaviour change theories or models e.g. COM-B model for behaviour change were also included.
We included programmes that were delivered face-to-face, in paper form such as booklet, video-based e.g. films or through digital platforms such as Short Message Service (SMS), mobile phone applications, or web-based compared with an active comparator i.e. delivered in another format or method to the intervention or a waitlist control where participants received the intervention at a later time.
The primary outcomes of interest were changes in systolic blood pressure (SBP), low-density lipoprotein cholesterol (LDL-C) and haemoglobin A1c (HbA1c) which are clinical markers of modifiable CVD risk factors, hypertension, dyslipidaemia and diabetes. Secondary outcomes were changes in CVD or stroke knowledge or preparedness (the ability to recognize stroke symptoms and the intent to activate emergency medical services) measured using validated outcome measures e.g. Heart Disease Knowledge Questionnaire or Stroke Knowledge Assessment Test or Stroke Action Test, body mass index (BMI), physical activity, dietary intake, psychological response (depression or anxiety) measured using validated outcome measures e.g. Patient Health Questionnaire-9 or Hospital Anxiety and Depression Scale, and health-related quality of life measured using validated outcome measures e.g. Short-Form 36.
We did not include indigenous people e.g. First Nations or Aboriginal and Torres Strait Islander people in Australia, Māori, indigenous Polynesian people of mainland New Zealand (Aotearoa) and Native Americans or American Indians as they do not meet the definition of CALD. We also excluded observational studies, literature reviews, systematic reviews, and qualitative studies. Reference lists of relevant reviews were checked for any additional, relevant primary studies. Conference abstracts, editorials, and commentaries were excluded.
Study screening and data extraction
Electronic databases including MEDLINE, CINAHL, Web of Science, and Scopus were searched from inception to September 2023. A health librarian assisted in developing the search strategy for this review. The complete search strategy for all databases is provided as Supplementary material online, Table S1.
Two review authors (A.A. and F.A.) independently screened the title and abstracts and full-text articles against the eligibility criteria using Covidence.16 Conflicts were resolved by discussion or by consulting a third review author (SA). See Figure 1 for the PRISMA flow diagram outlining the selection process.
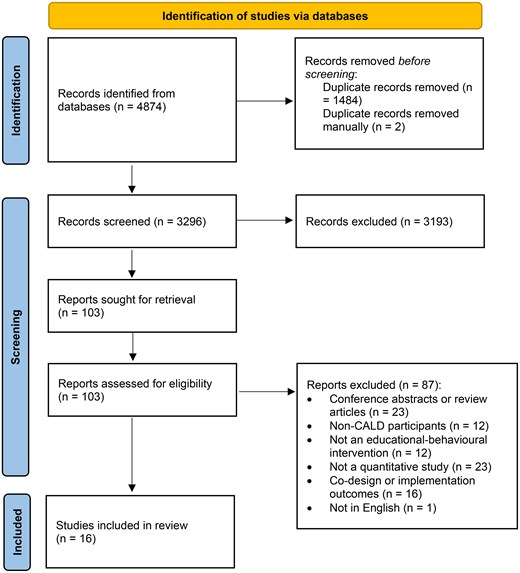
Preferred Reporting Items for Systematic Reviews and Meta-Analyses flow diagram.
A data extraction form was created in Covidence16 and piloted on one of the included studies and modified based on feedback from within the team. Two review authors (AA and SW) independently extracted the following data:
Study characteristics—author, publication year, country, setting, and study design.
Participants’ characteristics—sample size, risk factors, age, sex, and ethnicity.
Intervention and comparator—mode of delivery e.g. paper-based, intervention components i.e. exercise sessions, number, and type of behaviour change techniques used according to the Behaviour Change Wheel,17 who delivered the intervention, behaviour change theory used, type of comparator and the frequency and duration of the programme.
Primary and secondary outcomes—as reported above.
A third review author (S.A.) completed the consensus checking for discrepancies in data collected.
Assessment of risk of bias in included studies
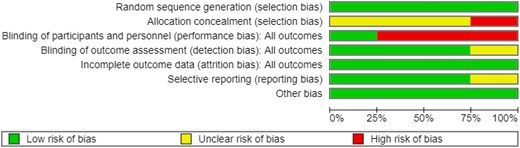
Two review authors (A.A. and S.W.) independently assessed the risk of bias for each included RCT using the Cochrane Risk of Bias (ROB) 1.0 tool.18 The following domains were assessed: selection bias (random sequence generation and allocation concealment), performance bias [blinding (participants and personnel and outcome assessment)], attrition bias (incomplete outcome data), reporting bias (selective reporting), and other sources of bias. Each potential sources of bias were graded as low, high, or unclear, and each judgement was supported by a quote from the study together with a justification for our judgement.
The methodological quality and the extent to which the included quasi-experimental studies have addressed the possibility of bias in the design, conduct and analysis were assessed independently by two review authors (A.A. and S.W.) using the Joana Briggs Institute (JBI) Critical Appraisal Tool for Quasi-Experimental Studies.19 A score was assigned for each item from zero for ‘No’ or ‘Unclear’ responses and a score of one for a ‘Yes’ response. The scores of the items for each study were summed to obtain a total quality score. Quality of the studies was then classified into three categories: low quality (high risk of bias) when the quality appraisal score ranged from 0 to 4, moderate quality (moderate risk of bias) from 5 to 7, and high quality (low risk of bias) from eight and above. Any disagreements were resolved by discussion or by referring to a third review author (S.A.).
Measurement of effect and data synthesis
Meta-analysis was only undertaken when ≥2 studies reported the same outcome. Dichotomous data were calculated as odds ratio (ORs) and continuous data as mean difference (MD) or standardized mean difference (SMD) with 95% confidence intervals (CI). The random effects model (inverse-variance method) in RevMan web20 was used as we anticipated heterogeneity among included studies. I2 statistic was used to measure heterogeneity.21 We assessed publication bias using funnel plot only if there were ≥10 trials included in the analysis. When meta-analysis was not feasible, studies were narratively described.
We also planned to do subgroup analyses by mode of delivery (face-to-face, paper-based, video-based, or through digital platforms), and programme duration (≤6 or ≥6 weeks), if there were sufficient data. We conducted sensitivity analyses by only including studies with a low risk of bias to test whether key methodological factors have affected the results. We excluded studies that were rated at a high or unclear risk of bias for random sequence generation, allocation concealment, and incomplete data.
Results
Our search identified 4784 records, of which 1485 duplicates were removed. We screened 3296 titles and abstracts and excluded 3193 records as irrelevant. After full-text screening of 103 records, 87 were excluded with reasons (see Supplementary material online, Table S2). A total of 16 studies were included in the review. Only three studies contributed to the meta-analysis (reporting at least one outcome)22–24 (Figure 1).
Characteristics of included studies
Three studies were individual parallel arm RCTs,22,23,25 1 was a cluster RCT,26 and 12 were quasi-experimental pre-post studies.25,27–37 The majority of the studies originated from the USA22,23,25–37 and one from the UK.24 Most studies were conducted in community-based settings such as local community health centres and places of worship.22,23,25–37 Only one was conducted in both community and primary health care settings.24
Participants’ characteristics
There were a total of 2331 participants across the 16 included studies. The mean age was 57.2 years and 50% (n = 1163) were women (Table 1). Participants were Hispanics (from Mexico, Dominican Republic, Central and South America), Southeast Asians (Philippines), South Asians (Bangladesh, India, and Pakistan), East Asians (China and South Korea), and African Americans. The majority of the participants either had hypertension, type 2 diabetes, high cholesterol or were overweight or obese. Only a small proportion were smokers. Of note, CVD risk factors among the participants were not consistently reported across the included studies.
Characteristics of included studies (n = 16)
| Author and Year | Study design | Participants | Location | Settings | ||||||
|---|---|---|---|---|---|---|---|---|---|---|
| Total | Intervention | Control | Age range/Mean age in years | Women (n=) | CVD risk factors | Ethnicity | ||||
| Alsukait et al. 202127 | Pre-post | 27 | 54.2 | 27 | NR | African American | USA | Community | ||
| Duraski 200628 | Pre-post | 177 | 52.0 | 64 | 6% smoker 12% diabetes | Mexican | USA | Community | ||
| Fernandes et al. 201229 | Pre-post | 99 | 68.5 | 83 | 81.5% HTN 35% DM 40% overweight 15% obese | Filipinos | USA | Community | ||
| Griffiths et al 200524 | RCT | 476 | 238 | 238 | 48.4 | 272 | 68% diabetes | Bengali | UK | Community and primary care |
| Kandula et al. 201522 | RCT | 63 | 31 | 32 | 50.0 | 25 | NR | Indian, Pakistani | USA | Community |
| Kim et al. 201331 | Pre-post | 28 | 55.3 | 12 | 75% HTN | South Koreans | USA | Community | ||
| Koniak-Griffin and Brecht 201525 | Pre-post | 90 | 42.6 | 90 | NR | Mexican, Central or South American | USA | Community | ||
| Menkin et al. 201923 | RCT | 223 | 120 | 113 | 73.9 | 161 | NR | African American, Latino, Chinese and South Koreans | USA | Community |
| Romero et al. 201632 | Pre-post | 32 | 61.7 | 32 | 62.5% HTN 47% high cholesterol 47% DM 9% smoker | Hispanic | USA | Community | ||
| Soto Mas et al. 201833 | Pre-post | 155 | 77 | 78 | 20- ≥ 46 | 125 | NR | Mexican | USA | Community |
| Tettey et al. 201734 | Pre-post | 199 | 18–80 | NR | NR | African American | USA | Community | ||
| Varges 201930 | Pre-post | 27 | 26–50 | 27 | NR | South Asians | USA | Community | ||
| Villablanca et al. 201635 | Pre-post | 42 | 59 | 42 | NR | African American | USA | Community | ||
| Visaria et al. 202136 | Pre-post | 357 | 59.6 | 205 | 41% HTN 30% DM | South Asians | USA | Community | ||
| Williams et al. 201926 | C-RCT | 311 | 160 | 151 | 58.6 | 246 | NR | Hispanic, African American | USA | Community |
| Williams et al. 201437 | Pre-post | 25 | 62 | 20 | NR | African American | USA | Community | ||
C-RCT, cluster randomized controlled trial; DM, diabetes mellitus; HTN, hypertension; NR, not reported; RCT, randomized controlled trial; UK, United Kingdom; USA, United States of America
Characteristics of intervention and control groups
The majority of the programmes were group-based delivered as a class/lecture22–25,27–36 with some also providing educational videos24 or booklets.33,35 Two studies delivered the intervention in the form of videos or films26,37 (Table 2). Most of the programmes primarily focused on CVD prevention. There were only two studies focused on stroke prevention. Twelve of the programmes were multi-component and elements went beyond the provision of education or educational materials. These programmes also involved risk assessment and goal setting, exercise sessions, social activities e.g. community gardening programmes, and interactive games. Only 1 educational–behavioural programme was co-designed33 with the majority culturally adapted for each community.22–32,34–37
Intervention characteristics
| Author and Year | Intervention chracteristicsa | Type of comparatorb | Frequency and duration | ||||||||||||||||||||
|---|---|---|---|---|---|---|---|---|---|---|---|---|---|---|---|---|---|---|---|---|---|---|---|
| Group-based | Individual | Culturally adaptedc | Co-designedd | Delivery of education | Intervention components | Intervention functione | Who provided the intervention | Theory driven | Active comparatorf | Waitlist controlg | |||||||||||||
| Paper-basedh | Video-basedi | Class/lecturej | Web/digitalk | Interactive activitiesl | Exercise sessionsm | Social activitesn | Risk assessment and goal settingo | Education | Persuasion | Incentivisation | Training | Enablement | Modelling | ||||||||||
| Alsukait et al. 202127 | ✓ | ✓p | ✓ | ✓ | ✓ | ✓ | ✓ | ✓ | ✓ | ✓ | ✓ | Trained programme leaders | 1, 2-hour weekly for 12 weeks | ||||||||||
| Duraski 200628 | ✓ | ✓q | ✓ | ✓ | ✓ | ✓ | ✓ | Project coordinator | 1, 30 min | ||||||||||||||
| Fernandes et al. 201229 | ✓ | ✓r | ✓ | ✓ | ✓ | ✓ | ✓ | ✓ | ✓ | ✓ | Community health workers | ✓s | 2 h weekly for 11 weeks | ||||||||||
| Griffiths et al 200524 | ✓ | ✓t | ✓u | ✓ | ✓ | ✓ | ✓ | ✓ | ✓ | Trained and accredited lay tutors | ✓v | ✓ | 3 h weekly for 6 weeks | ||||||||||
| Kandula et al. 201522 | ✓ | ✓w | ✓ | ✓ | ✓ | ✓ | ✓ | ✓ | ✓ | ✓ | ✓ | Research staff | ✓x | 1 h weekly for 16 weeks | |||||||||
| Kim et al. 201331 | ✓ | ✓y | ✓ | ✓ | ✓ | ✓ | ✓ | ✓ | Community health workers | 2 h weekly for 2 weeks | |||||||||||||
| Koniak-Griffin and Brecht 201525 | ✓ | ✓z | ✓ | ✓ | ✓ | ✓ | ✓ | ✓ | ✓ | ✓ | Community health workers ‘promotoras’ | 2 h weekly for 8 weeks | |||||||||||
| Menkin et al. 201923 | ✓ | ✓aa | ✓ | ✓ | ✓ | ✓ | ✓ | ✓ | Trained site case managers | ✓ab | ✓ | 1 h twice weekly for 4 weeks | |||||||||||
| Romero et al. 201632 | ✓ | ✓ac | ✓ | ✓ | ✓ | ✓ | ✓ | ✓ | ✓ | ✓ | Bilingual nurse educations | ✓ad | 90-minute session for 6 weeks | ||||||||||
| Soto Mas et al. 201833 | ✓ | ✓ae | ✓af | ✓ | ✓ | ✓ | ✓ | ✓ | ✓ | Bilingual research staff | 3.5 h weekly for 6 weeks | ||||||||||||
| Tettey et al. 201734 | ✓ | ✓ag | ✓ | ✓ | ✓ | ✓ | ✓ | ✓ | ✓ | ✓ | Church peer educators | 12 weeks | |||||||||||
| Varges 201930 | ✓ | NR | ✓ | ✓ | ✓ | ✓ | ✓ | Research staff | ✓ah | NR | |||||||||||||
| Villablanca et al. 201635 | ✓ | ✓ai | ✓aj | ✓ak | ✓ | ✓ | ✓ | ✓ | ✓ | ✓ | ✓ | Trained African American site leaders | 2 h twice weekly for 16 weeks | ||||||||||
| Visaria et al. 202136 | ✓ | ✓al | ✓ | ✓ | ✓ | ✓ | South Asian stroke trainers | 3 h weekly | |||||||||||||||
| Williams et al. 201926 | ✓ | ✓am | ✓an | ✓ | ✓ | ✓ | NA | ✓ao | ✓x | 1, 12 min | |||||||||||||
| Williams et al. 201437 | ✓ | ✓ap | ✓aq | ✓ | ✓ | ✓ | ✓ | ✓ | ✓ | Certified diabetes educator and nurse practitioner/case manager | ✓ar | 2 h weekly for 8 weeks | |||||||||||
aType of intervention of interest.
bType of comparator of interest.
cIntervention was translated and culturally adapted.
dCo-designed with communities.
eAdopted from the Behaviour Change Wheel.
fEducation provided in another format/method.
gWill receive the same intervention at a later time.
hPrinted materials (e.g. pamphlets, booklets).
iVideos or films.
jFace-to-face class or lectures, slide shows.
kWebsite, smartphone applications, text messages.
lHeart-healthy bingo, pop quizzes, games.
mInstructor-guided exercise or walking sessions.
nSocial events (e.g. morning tea).
oRisk assessment screening (e.g. blood pressure checks).
pCultural adaptation of Strong Women Healthy Hearts.
qThe programme was modified based on feedback from focus groups with the Hispanic community.
rAdapted from existing National Heart, Lung, and Blood Institute (NHLBI) community group education curricula (Healthy Heart, Healthy Family).
sTranstheoretical Model of Behaviour Change.
tAdaptation of the Chronic Disease Self-management Programme to Sylheti.
uSupporting videocassette.
vBandura’s theoretical model of self-efficacy.
wCultural adaptation based on feedback from mixed methods community-based research.
xPrinted educational materials.
yCultural adaptation of the Dietary Approaches to Stop Hypertension (DASH) to Korean.
zAdapted from NHLBI model curriculum for Latino, Su Corazon, Su Vida/Your Heart, Your Life.
aaModules 6 and 7 were culturally tailored to each group (Latino, Korean and Chinese).
abSocial Cognitive theory and attribution theory.
acAdaptation of Love Your Heart to Spanish.
adSelf-regulation model of disease.
aeNHLBI programme developed for the Hispanic communities, Salud para su corazon (Health for your Heart).
afBilingual (English Spanish) education materials.
agCulturally tailored faith-based cardiovascular health training programme, HeartSmarts.
ahPender’s Health Belief and Health Promotion model.
aiAdapted from the ‘Million hearts’ website of the Department of Health and Human Services Office on Women’s health and the ‘Heart Truth’ campaign website materials of the NHLBI.
ajStandardized educational materials.
akVideo presentations, health demonstrations and personal testimonials.
alDeveloped for the South Asian community, South Asian Health Awareness about Stroke (SAHAS, meaning ‘courage’).
amCulturally tailored using the Ecological Validity Model and a Narrative Performance Scale.
anDerrame Cerebral telenovela for Hispanic individuals and Gospel of Stroke musical film for black individuals.
aoEcological validity model and Health Belief model.
apCulturally tailored based on literature about Afro-centric culture and adapted to the local region based on pilot studies results.
aqVideotaped stories of typical problems faced by the African community.
arSocial Cognitive theory.
NA, not applicable.
NR, not reported.
Seven programmes were underpinned by behaviour change theory e.g. Self- regulation model of disease23,24,26,29,30,32,37 while the remaining programmes used various behaviour change techniques such as incentivisation, modelling and persuasion.22,25,27,28,31,33–36 Most programmes were delivered by bilingual community health workers or trained lay tutors.23–25,27,29,31,32,34–37 The frequency and duration of the programmes varied from 1–3-hour once or twice weekly sessions for 4–16 weeks.22–25,27,29–37 Follow-up timepoints ranged from immediately to 12 months after the intervention. Two of the trials compared the intervention with a waitlist control group23,24 while the other two with an active comparator in the form of traditional printed materials.22,26 One was translated into Spanish and the other was in English as participants were African Americans who spoke English.
Quality of the included trials
The overall risk of bias is high as all studies had at least one or more unclear or high risk of bias ratings in domains related to selection, performance and attrition bias. We present a graphical summary of risk of bias assessments for the included trials in Figure 2 and a summary of risk of bias for each included trial as Supplementary material online, Figure S1.
Risk of bias graph for all included RCTs.
Quality of the included quasi-experimental pre-post studies
Seven studies had a low-risk rating (score of 7–9) indicating high quality while the remaining five studies had moderate risk rating (score of 4–6). Refer to Supplementary material online, Table S3 for the critical appraisal result.
Primary outcomes
Change in systolic blood pressure
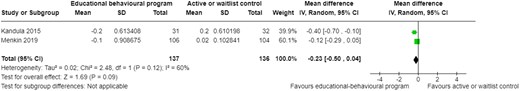
The pooled analysis showed that educational–behavioural programmes may have little to no effect on SBP compared to active (printed education materials) or waitlist control (MD 1.18, 95% CI −2.42 to 4.79, P = 0.54, I2 = 0%, 2 trials, 273 participants; Figure 3) at follow-up.22,23

Change in systolic blood pressure at follow-up. CI, confidence interval; SD, standard deviation.
In comparison, the results of the included pre-post studies were mixed. Three of the five studies showed a statistically significant reduction in SBP29,31,34 at follow-up (Table 3). Another study also reported a 3% decrease in SBP at 12 weeks post-intervention35 but was not statistically significant. In contrast to these studies, one study showed a non-statistically significant increase in SBP of 4.8 mmHg.27
Summary of findings for the primary outcomes
| Author and Year | Follow-up timepoint | Study design | How outcomes were assessed and reported | Outcomes |
|---|---|---|---|---|
| Change in systolic blood pressure | ||||
| Alsukait et al. 202127 | 14 weeks | Pre-post | Reported as mean change | ↑ mean change in SBP of 4.8 mmHg (NS) |
| Fernandes et al. 201229 | 6 months | Pre-post | Reported as mean and SE | ↓ mean change in SBP of −5.99 mmHg (P < 0.001)* |
| Kim et al. 201331 | 10 weeks | Pre-post | Ambulatory blood pressure monitoring Reported as mean change | ↓ mean change in SBP of −4.5 mmHg (P < 0.05)* |
| Tettey et al. 201734 | 12 weeks | Pre-post | Reported as mean change | ↓ mean change in SBP of −4.48 mmHg (P < 0.001)* |
| Villablanca et al. 201635 | 12 weeks | Pre-post | Reported as % reduction | ↓ in SBP by 3% (NS) |
| Kandula et al. 201522 | 3 months | RCT | Reported as mean change | ↑ MD 1.18, 95% CI −2.42 to 4.79, P = 0.54 |
| Menkin et al. 201923 | 2 months | RCT | Reported as mean change | |
| Change in low-density lipoprotein cholesterol | ||||
| Fernandes et al. 201229 | 12 months | Pre-post | Assessed as LDL-C Reported as mean and SE | ↓ mean change in LDL-C levels of −11.39 mg/dL (P = 0.013)* |
| Kim et al. 201331 | 10 weeks | Pre-post | Assessed as serum LDL-C Reported as mean and SD | ↓ mean change in LDL-C levels of −7.3 mg/dL (P = 0.05)* |
| Villablanca et al. 201635 | 12 weeks | Pre-post | Assessed as total LDL-C Reported as mean change | ↓ mean change in LDL-C levels of −10 mg/dL (P < 0.05)* |
| Williams et al. 201437 | 12 months | Pre-post | Assessed as LDL-C Reported as mean at follow-up | ↑ mean change in LDL-C levels of 4.24 mg/dL (P = 0.17) |
| Change in haemoglobin A1c | ||||
| Fernandes et al. 201229 | 12 months | Pre-post | Assessed as HbA1c % Reported as mean and SE | ↓ mean change in HbA1c of −0.04% (P = 0.045)* |
| Williams et al. 201437 | 12 months | Pre-post | Assessed as HbA1c % Reported as mean and SD | ↓ mean change in HbA1c of 0.56% (P = 0.26) |
| Kandula et al. 201522 | 3 months | RCT | Assessed as HbA1c % Reported as mean and 95% CI | ↓ HbA1c (MD −0.23, 95% CI −0.50 to 0.04, P = 0.12) |
| Menkin et al. 201923 | 2 months | RCT | Assessed as HbA1c % Reported as mean and 95% CI | |
CI, confidence interval; HbA1c, haemoglobin A1c; LDL-C, low-density lipoprotein cholesterol; MD, mean difference; NS, not significant; RCT, randomized controlled trial; SE, standard error; SD, standard deviation; SBP, systolic blood pressure.
*Statistically significant.
Change in low-density-lipoprotein cholesterol
Similarly, the results of the pre-post studies for LDL-C were mixed. Three out of four studies reported a statistically significant reduction in mean LDL-C levels29,31,35 post-intervention (Table 3). In contrast, one study reported a non-statistically significant difference in mean LDL-C (4.24 mg/dL; P = 0.17) at 12 months after the intervention.37
Change in haemoglobin A1c
The pooled analysis showed that educational–behavioural programmes may have little to no effect on HbA1c (MD −0.23, 95% CI −0.50 to 0.04, P = 0.12, I2 = 60%, 2 trials, 273 participants; Figure 4) at follow-up.22,23
Change in blood glucose levels at follow-up. CI, confidence interval; SD, standard deviation.
In comparison, the two pre-post studies showed mixed results.29,37 One found a statistically significant decrease in the mean HbA1c at 12 months post-intervention29 while the other also observed a decrease in HbA1c, although not significant37 (Table 3).
Secondary outcomes
Cardiovascular disease or stroke knowledge or preparedness
There were five studies that assessed CVD knowledge.25,30,33,34 One of the studies used the Heart Disease Knowledge Questionnaire which was reviewed for cultural and linguistic appropriateness by community health workers. The questionnaire was then translated into Spanish and then back translated. The content validity of both the Spanish and English versions was established by a six-member judge panel. Reliability of the questionnaires was acceptable (α = 0.80).25 Another study used Cuestionario de Salud Cardiovascular (CSC)33 to assess CVD knowledge. The questionnaire yielded a Cronbach’s α of 0.81 which suggests good inter-item correlation. The other study used a questionnaire developed by the study investigators34 while another used the Heart Disease and Fact Questionnaire.30 Validity and reliability of these questionnaires were not reported.
One study assessed stroke knowledge28 and another assessed stroke preparedness.26 Stroke knowledge was assessed using the Stroke Knowledge Questionnaire28 developed by the research team. Stroke preparedness was measured using the validated Stroke Action Test26 with an ordinal α reliability of 0.956.
All four studies that assessed CVD knowledge found a statistically significant increase in CVD knowledge post-intervention25,30,33,34 (Table 4). The one study that evaluated stroke knowledge also found a statistically significant increase (13.42 pre vs. 14.86 post; P < 0.001) after receiving the stroke prevention education.28 However, there was a non-statistically significant increase in stroke preparedness between the intervention (59.05% pre vs. 64.38% post) and control group (58.35% pre vs. 61.58% post) at 12 months.26
Summary of findings for the secondary outcomes
| Author and Year | Follow-up timepoint | Study design | How outcomes were assessed and reported | Outcomes |
|---|---|---|---|---|
| CVD or stroke knowledge | ||||
| Duraski 200628 | Unclear | Pre-post | Assessed using the Stroke Knowledge Questionnaire Reported as mean pre-post test score | ↑ mean scores (13.42 pre vs. 14.86 post; P < 0.001)* |
| Koniak-Griffin and Brecht 201525 | 6 months | Pre-post | Assessed using the Heart Disease Knowledge Questionnaire Reported as mean and SD | ↑ mean scores (7.9 pre vs. 9.4 post; P < 0.001)* |
| Soto Mas et al. 201833 | Unclear | RCT | Assessed using the Spanish Cardiovascular Health Questionnaire Reported as mean difference and 95% CI | ↑ mean scores in the intervention group compared to controls (MD 2.3, 95% CI 0.01–4.7, P = 0.049)* |
| Tettey et al. 201734 | 12 weeks | Pre-post | Assessed using a questionnaire developed by the study investigators Reported as means and mean difference | ↑ mean scores (5.6 pre vs. 18.34 post; P < 0.001)* |
| Varges 201930 | 3 months | Pre-post | Assessed using the Heart Disease and Fact Questionnaire Reported as mean and SD | ↑ mean scores (80.5 pre vs. 95.7 post; P = 0.00)* |
| Williams et al. 201926 | 12 months | Cluster RCT | Assessed using the Stroke Action Test Reported as % of questions answered correctly | ↑ % of questions answered correctly (64.38% intervention vs. 61.58% control; NS) in both groups |
| Change in BMI | ||||
| Alsukait et al. 202127 | 14 weeks | Pre-post | Reported as mean difference | ↑ mean BMI (0.3 kg/m2, 95% CI −0.9 to 7.2; NS) |
| Fernandes et al. 201229 | 12 months | Pre-post | Reported as mean and SE | ↑ mean BMI (28.56 pre vs. 30.73 post; SE 2.898; P = 0.457) |
| Menkin et al. 201923 | 2 months | RCT | Reported as mean and 95% CI | ↓ mean change BMI (Intervention: MD −0.14, 95% CI −0.33 to 0.05; NS) vs. (Control MD −0.01, 95% CI −0.20 to 0.18; NS) |
| Tettey et al. 201734 | 12 weeks | Pre-post | Reported as mean difference | ↓ mean BMI (MD −0.46 kg/m2; P = 0.001)* |
| Varges 201930 | 3 months | Pre-post | Reported as mean pre and post | ↓ mean BMI (24 pre vs. 23.7 post; P = 0.002)* |
| Villablanca et al. 201635 | 12 weeks | Pre-post | Reported as mean pre and post | ↓ mean BMI −1 kg/m2 (NS) |
| Williams et al. 201437 | 3 months | Pre-post | Reported as mean pre and post | ↓ mean BMI (38.5 pre vs. 38 post; P = 0.03)* |
| Change in physical activity | ||||
| Alsukait et al. 202127 | 14 weeks | Pre-post | Assessed as metabolic equivalent of task per week Reported as mean pre- and post-intervention | ↑ metabolic equivalent of task per week (2934 pre vs. 3544 post; NS) |
| Kandula et al. 201522 | 6 months | RCT | Assessed as bout-corrected moderate-vigorous physical activity, min/week Reported as mean and 95% CI | ↑ bout-corrected moderate-vigorous physical activity (Intervention: mean 9.5, 95% CI −19.49 to 38.53 vs. Control: mean 4.4, 95% CI −23.08 to 31.83; NS). |
| Menkin et al. 201923 | 2 months | RCT | Assessed as number of daily steps per day Reported as mean difference in daily steps per day | ↑ daily steps in the intervention group (489 mean steps/day) vs. ↓ in daily steps in the control group (−398 mean steps/day) (P = 0.008)* |
| Villablanca et al. 201635 | 12 weeks | Pre-post | Assessed as self-reported exercise Reported as % of participants self-reported exercise | ↑ self-reported exercise sessions of 30–60 min or longer than 60 min by 3% (P < 0.05)* ↑ % of participants reporting playing sports (2% increase; NS) ↑ % of participants engaging in aerobic exercise (2% increase; NS) |
| Williams et al. 201437 | 3 months | Pre-post | Assessed as self-reported exercise Reported as mean and SD | ↑ mean change self-reported exercise of 0.9 (P = 0.007)* |
| Change in dietary intake | ||||
| Alsukait et al. 202127 | 14 weeks | Pre-post | Assessed and reported as fruit and vegetables intake | ↓ fruit intake per day (MD −0.5 cups of fruit per day, 95% CI −1.1 to 0.3; NS) ↑ vegetables intake per day (MD 0.1 cups of vegetables per day, 95% CI −0.6 to 1.1; NS) |
| Kandula et al. 201522 | 6 months | RCT | Assessed as changes in caloric intake and fruit and vegetables intake Reported as mean difference and 95% CI | ↓ caloric intake (MD −74, 95% CI −223.03 to 74.84; NS) ↓ fruit and vegetables intake (MD −0.4, 95% CI −1.15 to 0.26; NS) |
| Kim et al. 201331 | 10 weeks | Pre-post | Assessed and reported as caloric intake, sodium, cholesterol, dietary fibre and micronutrients such as calcium | ↓ calories (−131.8 kcal/d), sodium (−169 mg/d), and cholesterol (−171.2 mg/d) (NS) ↑ consumption of all targeted micronutrients (NS) ↑ calcium (152 mg/d) and dietary fibre (4.8 g/d) intake (P < 0.05)* |
| Koniak-Griffin and Brecht 201525 | 6 months | Pre-post | Assessed and reported as relationship between CVD knowledge scores (number correct) and overall dietary habits score | Association with the subgroup of items related to salt consumption (r = 0.255, P = 0.015) |
| Psychological response | ||||
| Tettey et al. 201734 | Pre-post | Pre-post | Assessed using PHQ-2 Reported as mean difference | ↓ depression scores (MD 0.04; P = 0.574) |
| Griffiths et al 200524 | 4 months | RCT | Assessed using PHQ-9 Reported as mean change | ↓ depression scores (MD −0.08, 95% CI −0.23 to 0.08; P = 0.62) |
| Menkin et al. 201923 | 12 months | RCT | Assessed using the HADS Reported as mean change | |
| Quality of life | ||||
| Griffiths et al 200524 | 4 months | RCT | Assessed using EuroQoL EQ5D Reported as mean difference and 95% CI | ↑ health-related quality of life between the intervention and control group (MD 0.005, 95% CI −0.044 to 0.054; P = 0.827) |
| Menkin et al. 201923 | 2 months | RCT | Assessed using SF-12 Reported as mean difference and 95% CI | ↑ health-related quality of life between the intervention and control group (physical health (MD 0.31, 95% −2.0 to 2.5; P = 0.82) and mental health (MD −0.4, 95% CI −3.0 to 2.1; P = 0.73) |
| Williams et al. 201437 | 12 months | Pre-post | Assessed using SF-12 Reported as mean and SD | ↓ mean change in SF-12 Physical health scores of −3.77 (P = 0.06) ↑ mean change in SF-12 Mental health 2.59 (P = 0.09) |
BMI, body mass index; CI, confidence interval; DBP, diastolic blood pressure; EQ5D, EuroQoL 5-dimensions; HADS, Hospital Anxiety and Depression Scale; HbA1c, glycated haemoglobin-C; HDL-C, high-density lipoprotein cholesterol; LDL-C; low-density lipoprotein cholesterol; MD, mean difference; NS, not statistically significant; PHQ-2, Patient Health Questionnaire −2 item; PHQ-9, Patient Health Questionnaire− 9 item; SBP, systolic blood pressure; SD, standard deviation; SF-12, Short-Form-12 item.
*Statistically significant.
Reported change in body mass index
The results for BMI among the pre-post studies were also mixed. Three out of the 7 studies demonstrated a statistically significant reduction post-intervention30,34,37 (Table 4). Similarly, two studies also found a decrease in mean BMI post-intervention, but they were not statistically significant.23,35
In contrast, the remaining 2 studies found a non-statistically significant increase in the mean BMI post-intervention.27,29
Reported change in physical activity
Physical activity was measured in various ways. One study assessed physical activity through the number of daily steps using a pedometer and found a statistically significant difference in daily steps (489 vs. −398 mean steps/day; P = 0.008) between the intervention and control group immediately after the intervention was completed.23 Another study used an accelerometer to record the total physical activity and time spent at different intensities.22 They also observed a non-statistically significant increase in bout-corrected moderate-vigorous physical activity (min/week) between the intervention and control group at 6 months. Two studies reported a statistically significant increase in self-reported exercise.35,37 Another study administered the International Physical Activity Questionnaire to assess physical activity and found a non-statistically significant increase in metabolic equivalent of task per week after the intervention (2934 pre vs. 3544 post; P > 0.05).27
Reported change in dietary intake
Dietary intakes were measured by three sets of 24-h food recalls in three studies.22,27,31 One study used a 27-item instrument developed by the research team to measure heart-healthy dietary behaviours related to salt and sodium consumption and cholesterol and fat intake.25 Participants in one study reported a non-statistically significant change in fruit and vegetables intake per day (MD −0.5 cups of fruit per day, 95% CI −1.1 to 0.3 and 0.1 cups of vegetables per day, 95% CI −0.6 to 1.1) post-intervention.27 In another study, a dietary intake analysis after 10 weeks of intervention also found a non-statistically significant reduction in calories (−131.8 kcal/d), sodium (−169 mg/day), and cholesterol (−171.2 mg/day) and increased consumption of all targeted micronutrients.31 However, increase calcium (152 mg/day) and dietary fibre (4.8 g/d) intake was significant (P < 0.05).31 In contrast, another study reported the relationship between CVD knowledge scores (number of correct answers) and overall dietary habits score.25 They found that participants with higher CVD knowledge scores were more likely to ‘choose foods labelled low sodium, sodium free, or no salt added’.25
One trial observed no significant differences between the intervention and control groups for changes in total caloric intake (MD −74, 95% CI −223.03 to 74.84) and fruit and vegetables intake (MD −0.4, 95% CI −1.15 to 0.26) at 6- months follow-up.22
Psychological response—depression
Meta-analysis of two studies showed a non-statistically significant reduction in depression scores (SMD −0.08, 95% CI −0.23 to 0.08, P = 0.33, I2 = 0%, 2 trials, 649 participants; Figure 5) at follow-up.23,24 Depression was assessed using the Patient Health Questionnaire-923 and the Hospital Anxiety and Depression Scale.24
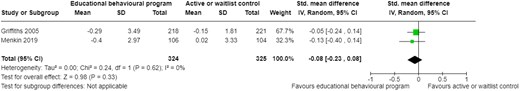
Change in depression scores at follow-up. CI, confidence interval; SD, standard deviation.
Similarly, one of the pre-post study also found a non-statistically significant reduction in depression scores measured using the Patient Health Questionnaire-2 (MD 0.04; P = 0.574) after the intervention.34
Health-related quality of life
Three studies assessed health-related quality of life, two using the Short-Form-1223,37 and another using the EuroQoL EQ5D.24 The two trials found a non-statistically significant difference in health-related quality of life between the intervention and control groups at follow-up [(MD 0.005, 95% CI −0.044 to 0.054; P = 0.827)24 and (physical health MD 0.31, 95% −2.0 to 2.5; P = 0.82 and mental health MD −0.4, 95% CI −3.0 to 2.1; P = 0.73).23] Similarly, the pre-post study also observed a non-statistically significant difference in health-related quality of life (mean SF-12 physical health 39.59, SD 12.24; P = 0.06 and mental health 41.20, SD 7.47; P = 0.09) after the intervention.37
Discussion
To our knowledge this is the first systematic review investigating the effect of CVD and/or stroke prevention educational–behavioural programmes for CALD communities. In this review, we included 16 studies (4 RCTs and 12 quasi-experimental pre-post studies) involving 2331 participants from different CALD backgrounds. Not all studies reported all outcomes of interest and not all outcomes were meta-analysable. Only three studies contributed to the meta-analysis (reporting at least one outcome). The heterogeneity in how outcomes were assessed and reported, and the lack of control groups for some of the studies precluded meta-analysis of several outcomes.
Our review found that the results between the pooled analysis and the included pre-post studies for the primary and secondary outcomes except for CVD or stroke knowledge, psychological response and health-related quality of life were mixed. The pooled analysis demonstrated little to no effect on outcomes such as SBP and HbA1c while most of the pre-post studies reported statistically significant improvements. These differences in findings may be attributed to the inherent bias associated with pre-post studies. The non-randomized nature of this study design tends to overestimate the effect size.38 It is also possible that some of the pre-post studies may have included a small proportion of people with CVD, potentially biasing the results. People with established CVD are more likely to accept changes in behaviour and often found to have better responses from educational–behavioural programmes.39 The validity and reliability of the measures may also explain the observed differences in findings. For instance, the majority of included studies did not provide information on how BP was measured, by whom, where and whether the BP monitors were validated. Only one study reported using ambulatory blood pressure measurements which is considered the gold standard in some countries as it better reflects clinical outcomes.40 It is also unclear whether LDL-C and HbA1c were measured while fasting through standard laboratory method or point of care testing. These factors may affect the accuracy of the findings or over- or under-estimate the true effect of the intervention. Furthermore, most of the studies relied on self-reported exercise data which may result in recall bias or over-reporting for fear of social disapproval.41 While another study used a validated physical activity questionnaire, this does not comprehensively capture an individual’s physical activity levels within their own environment and would often overlook less visible daily activities.42 Only two studies used wearable activity trackers (pedometer and accelerometer) which has gained support in recent years due to its objective and comprehensive approach to measuring physical activity.43 In terms of dietary intake assessments, most of the studies used a 24-h food recall. While this measure provides quantitative estimates of individual food consumption and nutrient intake, recall bias is still an issue and a single 24-h recall may not be representative of habitual diet.44
It is also likely that included studies may have failed to use behaviour change techniques that were more likely to lead to lifestyle changes. Previous reviews have reported that the use behaviour change techniques and theoretical underpinnings in intervention design are often poorly articulated, with little evidence to justify choice and which behaviour change techniques are being used to target which behaviours as part of the programme.45,46 We found that the studies that used four or more behaviour change techniques demonstrated improvements in physiological and lifestyle outcomes. This is well supported by previous research which indicates that combining behaviour change techniques within interventions allow synergistic effects and enhance their effectiveness.47 However, it is unclear which behaviour change theory is more effective than the rest as we found that some of the programmes with theoretical underpinnings did not influence any of the outcomes. This is consistent with the findings of another systematic review showing that interventions based on theories were not much more effective.45 Another possibility is that the programmes were not delivered as intended, although it is difficult to ascertain as treatment fidelity was not described in the included studies. Furthermore, it is unclear whether the frequency and duration of the programmes as well as the mode of delivery had any influence on the outcomes. More frequent and longer duration programmes are often associated with better outcomes,47 but we did not see this trend. For instance, one of the study that provided a 2-h weekly programme for 2 weeks resulted in improvements to a number of physiological and lifestyle outcomes (SBP, LDL-C and dietary intake)31 compared to another study with a programme of longer duration (2-h weekly for 12 weeks) which caused harm (increase in mean SBP and BMI) after the intervention.27 We also found that whether or not the studies used single (class or video-based) or multiple (class, paper, and video-based) modes of delivery, it still resulted in improvements to physiological and lifestyle outcomes. And lastly, the person who delivered the programme may have had influence on some of the observed lifestyle changes. However, we found that this was not the case which is inconsistent with findings of another systematic review of culturally appropriate interventions to manage or prevent chronic disease in CALD communities.48 They found that bi-lingual community health workers can promote greater uptake of prevention strategies.
It is not surprising that the interventions resulted in significant improvements to participant’s knowledge of CVD or stroke seeing as the main component of the programmes is provision of CVD or stroke prevention education. However, it is unclear whether improvements in CVD knowledge resulted in changes to lifestyle and physiological outcomes. Only one study evaluated this relationship and found a correlation, showing that participants with higher CVD knowledge scores were more likely to choose foods labelled with low sodium, sodium free, or no salt added.25
In comparison to the literature, our overall findings differ to previous systematic reviews demonstrating modest effect on CVD risk factors.12,14,49 However, these reviews primarily included white people, which limits comparison with our findings. We only found one other systematic literature review that examined the effectiveness of culturally appropriate interventions to manage or prevent chronic disease in CALD communities.48 Although, important differences in inclusion criteria i.e. they also included people with other chronic disease and outcomes investigated i.e. components of and utilization/satisfaction with the intervention, and the cultural competence of healthcare providers limit our ability to directly compare results.
Overall, there is a lack of robust evidence to support the provision of CVD and/or stroke prevention educational–behavioural programmes for CALD communities. This is because most studies were non-randomized, single-group studies, and the interventions delivered, personnel involved, target population, length of follow-up, outcomes and how they were assessed were heterogeneous. However, there were common elements in each intervention such as the provision of culturally appropriate CVD and stroke prevention education and use of behaviour change techniques. The majority of the programmes were culturally adapted rather than co-designed with each community which is a potential limitation. Cultural adaptation is the process of systematically adjusting an evidence-based intervention to consider language, cultural, and context in a way that is compatible with an individual’s cultural patterns, meaning and values50 while co-design involves collaboration between researchers, consumers and other stakeholders to identify gaps, develop, implement, and evaluate interventions.51 Culturally appropriate programmes that is co-designed or built from a bottom-up approach have been found to be more impactful compared to cultural adaptation where programme materials are often modified against observable superficial materials such as language, food or people or based on healthcare providers’ perceptions of community needs.50 The key concepts of co-design i.e. understanding ‘what works’ and ‘why and how it works in a specific cultural context’, are crucial for the success of educational–behavioural programme implementation, its scalability, and sustainability.52
Our findings have several implications for policy, practice and research. Co-designing educational–behavioural programmes with healthcare professionals, end-user organizations, local leaders and target CALD communities, using behaviour change theories to guide development, and mapping behaviour change techniques against target behaviours may enhance the potential impact of these programmes. Policies should emphasize the need for programmes to incorporate cultural sensitivity and relevance. This may involve tailoring content to address specific cultural beliefs, practices, languages and social determinants of health. Face-to-face group delivery was a common practice for most successful interventions. Healthcare professionals should continue to use this format, as it fosters peer support and motivation. However, there may also be room to integrate digital health tools, especially in light of increasing technological access among diverse communities. Future studies investigating the effects of educational–behavioural programmes should use more rigorous study design, such as RCTs to reduce inherent bias and strengthen the evidence base for their effectiveness. A clear definition of the target population in the inclusion and exclusion criteria and recruitment of an adequate number of participants according to the eligibility criteria would ensure directness of evidence and generalisability of the findings. Future studies should also clearly define a priori and unambiguous, measurable outcomes and use valid and reliable physiological, psychological and lifestyle outcome measures to reduce the risk of bias. A description of the programmes in sufficient detail will allow their replication. Furthermore, programmes should allow longer-term follow-up i.e. follow participants for longer than 3–6 months after the intervention. Follow-up consultations could not only help reinforce knowledge but also enable more concrete estimates of the relative benefits, costs and sustainability of the intervention. And lastly, studies should explore the association between knowledge and behaviour change as reporting improvements in knowledge alone is not a good indicator of change in behaviours.
Strengths and limitations
This review was carried out in accordance with the PRISMA recommendations and the Cochrane ROB and JBI tool were used to evaluate the quality of the included studies. A Health librarian assisted in developing the search strategy which ensures comprehensiveness.
The review has several limitations. Firstly, we only included articles published in English and did not include specific risk factors as search terms, so it is likely that some relevant publications were missed. Secondly, we were unable to assess the possibility of publication bias as there were too few meta-analysable studies. We were also unable to perform any subgroup analyses to investigate reasons for heterogeneity. Thirdly, as most of the studies were conducted in USA, the generalizability of our findings is limited. Furthermore, there was also limited information about how the programmes were carried out and would therefore limit reproducibility and the implementation of these programmes in primary care or community settings. And lastly, we were unable to perform any sensitivity analyses to control for risk of bias in included studies.
Conclusion
The effect of educational–behavioural programmes on CVD risk factors is inconclusive but may improve CVD or stroke knowledge. Co-designing programmes underpinned by behaviour change theories/techniques with stakeholders and target CALD communities may enhance their potential impact. Future studies should use more rigorous study design i.e. RCTs, valid and reliable outcome measures to reduce inherent bias and strengthen the evidence base for the effectiveness of these programmes.
Supplementary material
Supplementary material is available at European Journal of Preventive Cardiology.
Acknowledgements
C.F. is supported by a National Health and Medical Research Council 2020 Investigator (Emerging Leadership) Grant 2020–2025 Ref: 1196262.
The authors acknowledge the support of the Western Sydney Local Health District, Research & Education Network, Westmead, NSW, Australia.
The authors thank the University of Wollongong health librarian for her support with developing the search strategy for this review.
Authors’ contributions
S.A. contributed to the conception, study selection and screening, data extraction, analysis and interpretation, manuscript writing and revision for important intellectual content.
A.A. and S.W. contributed to the study selection and screening, data extraction, quality appraisal and critical review of the manuscript.
F.A. contributed to study selection and screening and critical review of the manuscript.
S.G. and C.F. contributed to manuscript writing and revision for important intellectual content. All gave final approval and agree to be accountable for all aspects of work ensuring integrity and accuracy.
Funding
This study did not receive funding.
Data availability
The authors confirm that the data supporting the findings of this study are available within the article and its Supplementary materials.
References
Author notes
Conflict of interest: none declared.

Comments