


Abstract
Nanomaterials (NMs) are thermodynamically unstable by nature, and exposure of soil organisms to NMs in the terrestrial environment cannot be assumed constant. Thus, steady‐state conditions may not apply to NMs, and bioaccumulation modeling for uptake should follow a dynamic approach. The one‐compartment model allows the uptake and elimination of a chemical to be determined, while also permitting changes in exposure and growth to be taken into account. The aim of the present study was to investigate the accumulation of Ag from different Ag NM types (20 nm Ag0 NMs, 50 nm Ag0 NMs, and 25 nm Ag2S NMs) in the crop plant wheat (Triticum aestivum). Seeds were emerged in contaminated soils (3 or 10 mg Ag/kg dry soil, nominal) and plants grown for up to 42 d postemergence. Plant roots and shoots were collected after 1, 7, 14, 21, and 42 d postemergence; and total Ag was measured. Soil porewater Ag concentrations were also measured at each sampling time. Using the plant growth rates in the different treatments and the changing porewater concentrations as parameters, the one‐compartment model was used to estimate the uptake and elimination of Ag from the plant tissues. The best fit of the model to the data included growth rate and porewater concentration decline, while showing elimination of Ag to be close to zero. Uptake was highest for Ag0 NMs, and size did not influence their uptake rates. Accumulation of Ag from Ag2S NMs was lower, as reflected by the lower porewater concentrations. Environ Toxicol Chem 2021;40:1859–1870. © 2021 The Authors. Environmental Toxicology and Chemistry published by Wiley Periodicals LLC on behalf of SETAC.
INTRODUCTION
Silver nanomaterials (Ag NMs) are used in numerous consumer products and are expected to be released to soils through the application of sewage sludge to agricultural soils following wastewater treatment. The NMs that pass through the wastewater‐treatment process undergo transformation, and these transformed materials are the form that is of most environmental relevance and interest. In soil, NMs can undergo chemical transformations, or their behavior can be dominated by processes such as homo‐ and heteroagglomeration and the release of ions through dissolution. Given the thermodynamically unstable nature of NMs, constant exposure cannot be assumed as the NMs undergo these processes and transformations in the soil or soil porewater, changing their availability to plants and other soil organisms (van den Brink et al. 2019).
Sulfidization is the most commonly observed transformation of Ag NMs, and this form (Ag2S NMs) has generally been found to be less reactive than the pristine or ionic Ag forms (Navarro et al. 2014; Settimio et al. 2014; Doolette et al. 2015; Sekine et al. 2015; Wang et al. 2018). Although often considered barely soluble and scarcely bioavailable, accumulation of Ag2S NMs in plants has been reported in several studies, both in hydroponic (Stegemeier et al. 2015; Pradas del Real et al. 2017; Wang et al. 2017) and in soil (Doolette et al. 2015; Judy et al. 2015; Pradas del Real et al. 2016; Schlich et al. 2018; Wu et al. 2018) exposures. These studies have found low translocation of Ag from roots to shoots and concluded that uptake largely depends on particle characteristics, as well as the plant species. The majority of these studies investigated accumulation at a single time point, and only a few also measured Ag in the porewater or available/extractable Ag in the soils to understand how NM fate and speciation in soils affect uptake.
Bioaccumulation in plants is the net result of competing uptake and elimination processes. Uptake for Ag NMs applied in soils will be via the plant roots accessing the soil porewater. Elimination will result in losses back to the environment through processes such as volatilization and exudation (Frantke et al. 2016). Growth dilution is not an elimination process per se because the chemical remains in the organism tissues; however, production of new biomass can lower internal concentrations as the accumulated chemical is spread over a greater biomass (Tudoreanu and Phillips 2004). Although accumulation factors (ratio between concentration in the plant and the surrounding soil/medium at a point in time) are the simplest ways of assessing uptake into plants, this assumes equilibrium between the plant and the surrounding environment. However, plant uptake may vary over a growing period; therefore, the uptake kinetics as a plant grows is a dynamic and non‐steady‐state process (Chen et al. 2008).
To investigate plant accumulation of NMs as a dynamic process and how these processes apply to different Ag forms and sizes, the present study examined the kinetics of Ag uptake into wheat over early growth stages (exponential growth) from 3 different Ag NMs: pristine NMs of 2 different sizes (20 and 50 nm) and an aged NM form, Ag2S (25 nm). Wheat (Triticum aestivum) is a monocot, with a fibrous root system, which tends to have a larger root surface area compared to dicots and thus the potential to be more sensitive to NM exposure (Su et al. 2019). Dynamically derived accumulation factors, based on kinetic exposure experiments, may be applicable to NMs because no equilibrium between organism and exposure medium is needed (van den Brink et al. 2019). The simplest kinetic model considers uptake and elimination to one biological compartment (e.g., plant or invertebrate), with an assumption of constant exposure concentration. For plant roots, it is expected that exposure to Ag NMs through the mass flow of porewater toward roots is more relevant than the total soil concentration (Bravin et al. 2010). It is possible to include the rate of change of Ag concentrations in the porewater, offering a potentially more realistic measure of exposure. There is also the possibility to include concentration dilution via growth by including the growth rate of the plant parts (roots and shoots). Together this allows for the assessment of how plant growth and changes in porewater concentrations can govern the availability or concentrations of Ag in plants exposed to Ag NMs and compare the availability of different Ag NM forms. The accumulation patterns of Ag from different Ag NMs were compared using a one‐compartment model, which takes the organism as one single compartment, with different Ag uptake rate constants for the surrounding media (total soil or soil porewater) and a single elimination rate constant (Diez‐Ortiz et al. 2015).
MATERIALS AND METHODS
Nanomaterials and their characterization
Silver nanoparticle (NP) colloids (Ag NMs) of 20 and 50 nm were synthesized following a seeded‐growth approach based on Bastús et al. (2014), to ensure high monodispersity. The Ag2S NMs, of nominal size 25 nm, were synthesized by hot injection of a concentrated AgNO3 solution to an aqueous solution containing Na2S and 55‐kDa polyvinylpyrrolidone (PVP). The 3 NMs were purified by centrifugation to remove unreacted precursors and redispersed in Milli‐Q water containing 1 mg/mL of 55‐kDa PVP as a coating and stabilizer. The Ag NMs had an additional content of sodium citrate (5 mM), acting as both a stabilizer and a reducing agent to enhance chemical stability during storage. All 3 NMs were used as colloidal dispersions with concentrations determined by inductively coupled plasma mass spectrometry: 6.18 mg Ag/mL for the 20‐nm Ag NMs, 7.56 mg Ag/mL for the 50‐nm Ag NMs, and 1.90 mg Ag/mL (2.18 mg Ag2S/mL) for the 25‐nm Ag2S NMs.
Size distribution was determined by transmission electron microscopy (TEM). Images were acquired using a JEOL1010 TEM working at 80 keV. For sample preparation, formvar‐coated and carbon‐stabilized, 200‐mesh copper grids (Ted Pella) were dipped in aliquots of the 3 NMs at a 1:10 dilution in Milli‐Q water and left to dry for at least 12 h. ImageJ software (National Institutes of Health) was used to process the acquired TEM images to calculate mean size and size distribution. The hydrodynamic diameter and the surface charge of the NMs were measured by dynamic light scattering and zeta potential on a Malvern Zetasizer Nano ZS90, which incorporates a zeta potential analyzer (Malvern Instruments). The Ag NM samples had to be diluted to 1:50 in Milli‐Q water, whereas the Ag2S NMs were measured at a 1:5 dilution in Milli‐Q water. The ultraviolet (UV)‐visible absorption spectra of the 3 NMs were determined using an Agilent Cary 60 UV‐Vis Spectrophotometer, setting spectra measuring limits between 300 and 800 nm. The 20‐ and 50‐nm Ag NMs spectra were measured at a 1:50 dilution in Milli‐Q water, whereas the spectra for the Ag2S NMs was measured at a 1:5 dilution in Milli‐Q water.
Soil and organisms
All exposures were carried out in a commercially supplied soil, LUFA 2.2 (Speyer). LUFA 2.2 soil is characterized as a sandy loam with pHCaCl2 5.6, 1.7% organic carbon, and 9 cmolc/kg cation exchange capacity. The soil was supplied fresh, sieved to <2 mm. Prior to experiments, the soil was air‐dried and the water holding capacity determined. Winter wheat, T. aestivum, seeds (KWS Dacanto) were used as the plant species for the experiments.
Experimental setup
Two nominal concentrations were chosen for the exposures, 3 and 10 mg Ag/kg dry soil. These concentrations were chosen because they are below most toxicity measurements for plants but above concentrations in the plant and porewater that could also be detected, even where biomass was relatively small. For spiking the soil, solutions were made from concentrated stocks of the NPs diluted in ultrapure water (Triple Red). A volume of 50 mL stock was added to 2 kg of soil and mixed thoroughly before the soil was wetted further to 60% of the water holding capacity with deionized water (dH2O). Two controls were also set up: one negative control without any Ag amendment and a coating control, which was the carrier solution for the Ag particles added to match the volume of solution added for the higher Ag concentration (10 mg Ag/kg). The soils were incubated for 7 d at 20 °C before seeds were planted.
The seeds were sown and emerged in seed plugs (plug dimensions, length × width × height = 2 × 2 × 3 cm) containing 6 g dry weight equivalent of spiked or control soils, appropriate to the treatment. There was one seed per plug, and sufficient plugs were used to ensure that enough seedlings were available for each treatment and sampling time point. Planted seeds were germinated in controlled greenhouse conditions, 20 ± 10 °C with a 16‐h photoperiod. Seed emergence was monitored twice daily, so only seeds that were emerged at a similar time (1 d postemergence) were taken forward for the rest of the uptake study time points. One day postemergence, seedlings were transferred (with soil in plugs intact) into columns containing appropriately spiked soil, where they were grown for the rest of the kinetic experiment. Five replicate plants were grown for each treatment and for each sampling time point. Plants were also sampled for analysis of Ag accumulation at 1 d after emergence.
Columns for the kinetics experiment were opaque plastic pipes cut in half lengthwise, giving the dimensions 2.4 × 32 cm (diameter × length). The flat side surface was sealed using a clear Perspex sheet (0.145 × 5 × 32 cm, depth × width × length). The Perspex was secured using cable ties and covered with opaque plastic film to obscure light from the soil. This approach was taken so that it was possible to directly access the plants and the soils by removing the Perspex and minimizing damage to the plants when removing them from the columns (Supplemental Data, Figure S1). An amount of 176.3 g (dry wt equivalent) spiked soil was added to each column and tamped to reach within 2 cm of the top of the column.
Once the plant plugs were transferred to the soil columns, they were watered every 2 to 3 d with dH2O. The amount of water given was determined by the average loss of mass from 3 planted soil columns from each treatment compared to the average weight gained by 2 plant vessels that contained a wick to maintain their moisture content at approximately 60% water holding capacity. The wick was a nylon cord (45 × 0.5 cm, length × diameter) placed in the soil with the end placed in a pot of dH2O so that the plant could access water and maintain the moisture content. This allowed for the determination of water loss from the soil due to plant growth (transpiration) and evaporation. The sampling time points for the plants were 1, 7, 14, 21, and 42 d postemergence of seedlings.
Soil and soil porewater sampling
After spiking, 3 soil samples per treatment were collected to measure soil Ag concentration. Soil porewater was collected for analysis of Ag concentrations on the day the seeds were planted and at each subsequent sampling time. For the plant plugs, the soil from 5 plugs was pooled to produce one replicate sample. For the subsequent sampling times, the soil from the sampled column was homogenized by hand mixing and a subsample of 34 g (wet wt) taken for porewater extraction. To determine the water content of the soil, a second 5‐g subsample of the soil was dried overnight in the oven. Knowing the water content for each sample, the 34‐g sample was then saturated to 100% of the water holding capacity with dH2O. The sample was gently mixed and then incubated for 16 h at 20 °C (Lahive et al. 2017).
To minimize Ag losses through adsorption, the 0.45‐µm PVDF filters (Thames Restek) and borosilicate glass wool (Acros Organics; 0.027 ± 0.1 g/tube) were pretreated by soaking in a 0.1 M CuSO4 solution (ThermoScientific). The glass wool was placed inside the filter insert to soak. The filter and glass wool were then centrifuged (Beckman Avanti J‐E; Beckman Coulter), followed by washing steps where ultrapure water was also centrifuged through to remove excess Cu from the system. The saturated soil was then placed on top of the glass wool in the filter inserts and centrifuged at 2000 g for 1 h. An aliquot of 1 mL was collected for Ag analysis. The 0.45‐µm filtered fraction included NMs and soluble Ag and is referred to as the “total Ag in the porewater.” The remaining porewater was then ultrafiltered through 10‐kDa polyethersulfone ultrafilters (Pierce™ protein concentrators; ThermoScientific). The ultrafilters were also pretreated with CuSO4 and rinsed with water before a 5‐mL porewater sample was placed in the filter insert to be centrifuged at 4000 g for 0.5 h to collect the ultrafiltrate.
Plant sampling
The plants sampled at 1 d postemergence were removed from the plug, and the soil was gently removed from the roots, after which it was carefully washed and rinsed in dH2O. The shoots were cut and the fresh weights of the roots and shoots measured separately (Cubis; Sartorius). To guarantee that there was enough plant material for Ag detection at the low concentrations expected, 5 plants were pooled to give one replicate. Five replicates (of 5 plants) were collected in total. The shoots and roots were then dried in an oven (Heratherm; Thermo Scientific) to a constant weight, after which the dry weight was measured. On all subsequent sampling days, the plants were taken individually from the soil columns. The Perspex sheet was first removed, and the plants were then gently taken from the soil and treated in the same manner as the 1‐d postemergence samples. The dried plant samples were then analyzed for total Ag in the roots and shoots.
Chemical analysis
All liquid samples were acidified at a 1:1 ratio of sample to reverse aqua‐regia (3:1 ratio 69% HNO3 [Sigma‐Aldrich]: 37% HCl [Merck, Germany]). Total and ultrafiltered porewater Ag concentrations were analyzed by flame atomic absorption spectroscopy (AAS; Perkin Elmer AAnalyst 100) or graphite furnace (GF‐AAS; Perkin Elmer PinAAcle 900Z), respectively. Digestion of soil and plant samples was performed by placing 130 mg of dry soil or up to 110 mg of cut dried plant tissue in Teflon bombs and adding 2 mL of destruction mixture (4:1 ratio, 37% HCl:69% HNO3) to each sample. After 15 min of incubation at room temperature, the bombs were closed and heated to 140 °C for 7 h. Once the samples had cooled down, 8 mL of dH2O was added, and Ag concentrations in the digest were measured by GF‐AAS. Where the plant sample total biomass was <100 mg (dry wt), whole samples were digested and only 4 mL of dH2O water added. Three reagent blanks were added per run as a procedural control. Sewage sludge LGC6181 was used as a reference material.
Data analysis
The plant Ag concentration data and the porewater Ag concentration data were checked for normality using the Anderson‐Darling test. Nonnormal data were log‐transformed where appropriate to carry out an analysis of variance. The influence of time and particle type on plant root Ag concentration and porewater Ag concentration were tested using a generalized linear model, with time and particle type (20 nm Ag0 NM, 50 Ag0 NM, or Ag2S NM) as factors. A post hoc Tukey test was used to find significant differences between time points and particle types. An F test was used to compare the variation in plant growth for the different Ag NM treatments and the control. All analyses were carried out using Minitab 18.
The total Ag concentrations in the roots were modeled using the one‐compartment model to derive uptake and elimination rates, using the following equation:
In Equation 1, C int is the Ag concentration in the roots at time t (micrograms of Ag per gram), k 1 is the uptake rate constant (grams of dry soil per gram dry wt of plant per day), k 2 is the elimination rate constant (per day), C 0 is the background Ag concentration in the plants (micrograms of Ag per gram), and C exp is the exposure Ag concentration (soil, milligrams of Ag per kilogram of dry soil).
Other derivations from the first‐order kinetic model were also used, by including the exponential growth rate (k g, per day) to account for growth dilution (Equation 3) and porewater Ag concentrations to account for the decrease in Ag concentration in the porewater over time (Equation 5).
When the mass of the plant increases during the exposure, growth dilution occurs, resulting in an overestimation of the actual elimination (Landrum et al. 1992). The model can be corrected for growth by adding a first‐order growth rate constant to the elimination rate constant. To estimate the growth rate, the biomass increase of the roots and shoots was described by an exponential growth curve (Equation 2).
In Equation 2, B t is the dry weight at the time t (grams), B 0 is the dry weight at 1 d postemergence (grams), k g is the growth rate (per day), and t is time (days).
The growth rate (k g) estimate was then included in the derived first‐order kinetic model:
The porewater data were fit using a first‐order decay model (Tervonen et al. 2010):
In Equation 4, C pw0 is the concentration of Ag in the porewater (micrograms of Ag per liter) when the seeds were planted, C pwt is the concentration at time t (micrograms of Ag per liter), and λ is the rate of loss of Ag from the porewater over time (per day; Tervonen et al. 2010).
The rate of loss of Ag from the porewater (λ) was also then included in the derived first‐order kinetic model alongside the growth rate:
In Equation 5, C pw0 is the soil porewater Ag concentration at the beginning of the exposure (micrograms of Ag per liter) and k 1pw is the uptake rate constant, which is system‐dependent. Also, k 1pw describes the fractional change in the total compound mass in the porewater over time and depends on the relative size of the organism and the porewater compartment (liters of soil porewater per gram of plant root per day; Landrum et al. 1992); k 2pw is the elimination rate constant considering porewater concentration decline (per day).
RESULTS
NP characterization
The supplied synthesized NM colloids were nominally 20 and 50 nm PVP‐coated Ag NMs and 25‐nm PVP‐coated Ag2S NMs. The mean size distributions measured by analysis of TEM images were 21.9 ± 3.6, 53.6 ± 6.6, and 23.5 ± 10.2 nm, respectively. Supplemental Data, Figure S2 and Table S1, show the most relevant characterization data to describe both the NM morphology and the colloidal suspension characteristics.
Soil concentration validation
The concentrations (mean ± standard deviation, n = 3) in the control soil (no Ag amendment) and the coating control soil were 0.05 ± 0.002 and 0.07 ± 0.005 mg Ag/kg dry soil, respectively. The concentrations of Ag in the spiked soils were lower than the nominal concentrations (3 and 10 mg Ag/kg) because of the supplied stock solutions being lower in Ag concentration than expected. The measured exposure concentrations for pristine 20‐nm Ag NMs were 2.22 ± 0.17 and 7.92 ± 1.2 mg Ag/kg dry soil and for pristine 50‐nm Ag NMs, 2.09 ± 0.054 and 6.57 ± 0.437 mg Ag/kg dry soil (Supplemental Data, Figure S3). The concentrations in the soil spiked with Ag2S NMs were considerably lower, 0.37 ± 0.02 and 1.26 ± 0.04 mg Ag/kg dry soil. Measurement of the stock solutions confirmed that these lower than nominal concentrations were due to low stock Ag concentration and not poor recovery of Ag from the soil (Supplemental Data, Figure S4). To distinguish between the higher and lower concentrations for each of the Ag treatments, the nominal concentrations 3 and 10 mg Ag/kg are referred to as “low” and “high,” respectively, hereafter.
Porewater concentrations
Markedly higher porewater Ag concentrations were found after 42 d postemergence compared to the starting time point in both the low and high treatments of the pristine NMs (20 and 50 nm NMs). There was no significant change in the porewater Ag concentrations between days 1 and 42 in the Ag2S NM treatment (F = 0.09, p > 0.05; Figure 1). The porewater at 42 d postemergence was also ultrafiltered to determine the concentration of soluble Ag. The soluble Ag concentrations were found to be low, and both the pristine Ag and Ag2S NMs had concentrations significantly lower than the control porewater (F = 17.6, p < 0.05; Supplemental Data, Figure S5).
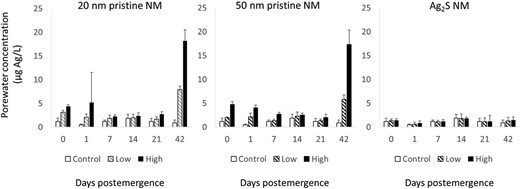
Concentrations of Ag in porewater extracted from soils over the 42 d during the wheat plant exposure to 20 and 50 nm pristine nanomaterials (NMs) and Ag2S NM. LUFA 2.2 soil was spiked with different Ag NMs at nominal concentrations of 3 (low) and 10 (high) mg Ag/kg dry soil. Day 0 was the day the seeds were planted in the soils (7 d after spiking), and the following sampling days are days postemergence of the seedlings. Data points are mean values and error bars, the standard deviations.
Over the first 21 d postemergence, there was a significant decline in porewater concentrations for both the pristine NMs in the high treatment (50 nm, F = 15.44, p < 0.05; 20 nm, F = 1.52, p < 0.05). The rates of decline in concentration (λ) were determined (Figure 2 and Table 1). The rates of decline of Ag from the porewater were 0.0208 ± 0.0035 (low) and 0.0232 ± 0.0037 d–1 (high) for the 20‐nm Ag NM and 0.0067 ± 0.0038 (low) and 0.0254 ± 0.0025 d–1 (high) for the 50‐nm Ag NM treatments. The Ag2S NM treatment and the low 20‐ and 50‐nm NM pristine treatments did not show a significant change in porewater concentration over the 21‐d exposure period (Ag2S, F = 1.03, p = 0.403; 50 nm, F = 2.67, p = 0.07; 20 nm, F = 2.52, p = 0.082).
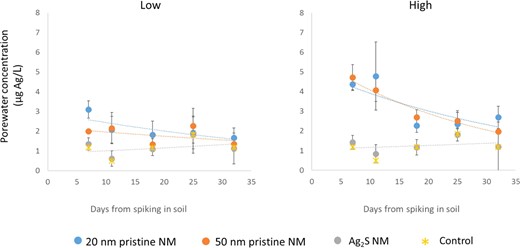
Concentration of Ag in porewater extracted from soils over the first 21 d of wheat plant exposure. LUFA 2.2 soil was spiked with different Ag nanomaterials at nominal concentrations of 3 (low) and 10 (high) mg Ag/kg dry soil. Data points are mean values and error bars, the standard deviations. Trend lines show the fitted first‐order decline of Ag in the porewater from which the rate constant for decline (λ) was calculated. The first sampling point (day 7 following spiking) is the day the seeds are planted in the soil and is termed “day 0” in the plant uptake experiments. NM = nanomaterial.
The rate constant describing the decline in Ag concentration in porewater over the 21‐d exposure period and the growth rate of the plant roots and shoots over the 21‐d exposure perioda
| Treatment | λ (1/d) | k g roots (1/d) | k g shoots (1/d) |
| 20 nm pristine NM (H) | 0.0232 ± 0.0037 | 0.099 ± 0.002 | 0.169 ± 0.002 |
| 20 nm pristine NM (L) | 0.0208 ± 0.0035 | 0.117 ± 0.002 | 0.175 ± 0.001 |
| 50 nm pristine NM (H) | 0.0254 ± 0.0025 | 0.114 ± 0.002 | 0.191 ± 0.001 |
| 50 nm pristine NM (L) | 0.0067 ± 0.0038 | 0.122 ± 0.003 | 0.193 ± 0.001 |
| Ag2S NM (H) | 0.002 ± 0.0053 | 0.108 ± 0.002 | 0.169 ± 0.004 |
| Ag2S NM (L) | 0.0089 ± 0.0041 | 0.117 ± 0.002 | 0.184 ± 0.004 |
| Control | — | 0.108 ± 0.004 | 0.185 ± 0.004 |
Plants were grown in LUFA 2.2 soil spiked with different Ag nanomaterials at nominal concentrations of 3 mg and 10 mg Ag/kg dry soil.
λ = rate constant; k g = growth rate; NM = nanomaterial; H = 10 mg Ag/kg dry soil; L = 3 mg Ag/kg dry soil.
Plant growth
The emergence rate of the seeds was >80%, indicating no effect of the Ag treatments on emergence. The growth rates, based on dry weights, for the roots and the shoots were calculated separately to determine the above‐ and belowground mass increases. The roots exhibited an exponential growth over the 42‐d growth period (Figure 3). Growth of plants in the Ag treatments did not significantly vary compared to the control plants, and growth rates (k g ± standard error) ranged from 0.096 ± 0.0007 to 0.103 ± 0.0008 d–1 across the control and Ag treatments, respectively (F test, p > 0.05; Table 1). The shoots followed an exponential growth curve up to day 21, after which the growth rate slowed between days 21 and 42 (Figure 3). Shoot growth rates up to day 21 were between 0.164 ± 0.002 and 0.193 ± 0.001 d–1, and plants in the Ag treatments did not significantly vary compared to the control plants (F test, p > 0.05; Table 1). The rate of biomass increase (assuming a linear increase) between days 21 and 42 was lower in the shoots than the roots, 0.201 ± 0.029 d–1 for shoots compared to 0.318 ± 0.07 d–1 for roots. Hence, although the shoot‐to‐root ratio increased with time from 0.98 at day 1 to 4.03 at day 21, the ratio had decreased to 2.6 by day 42 of exposure.
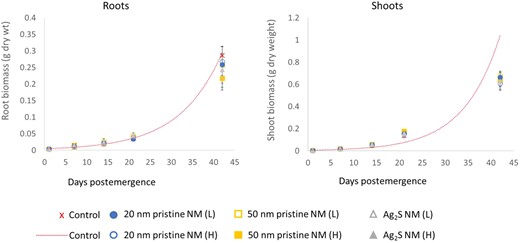
Biomass increase of plant roots and shoots over the 42‐d growth period, postemergence in LUFA 2.2 soil spiked with different Ag nanomaterials (NMs) at nominal concentrations of 3 (low) and 10 (high) mg Ag/kg dry soil. Closed circles indicate the higher‐exposure concentration and open circles, the lower concentration for each of the Ag NMs. Dotted line shows the predicted exponential growth curves for the control modelled over 42 d as a representative growth curve for plant roots and shoots, which were not significantly different. L = low; H = high.
Ag accumulation in plants
The concentration of Ag in the control plant did not vary significantly with time (F = 0.06, p > 0.05). There was significant accumulation of Ag in the roots of plants exposed to all Ag forms compared to control plants (p < 0.05). Measured tissue concentrations were dependent on the plant part (root or shoot), the Ag NM form, the exposure concentration, and the time of exposure in the soil (Figure 4). Compared to day 0, there were significantly higher Ag concentrations in roots exposed to 20‐ and 50‐nm Ag NMs at all times postemergence. For both pristine NMs, Ag concentrations were highest in the roots after 14 and 21 d, but by day 42 concentrations had fallen to values equivalent to those measured at day 7. For high Ag NM concentration exposures (nominal 10 mg Ag/kg), there was an increasing concentration of Ag in the plant roots up until day 21, but by day 42 it had decreased. For plants exposed to Ag2S NMs, the pattern of accumulation was also different from that observed for the 2 pristine Ag NMs. The root concentration at day 1 postemergence in the Ag2S NM treatment was significantly higher compared to day 0, after which the Ag concentrations did not vary significantly; and by day 42 the concentrations were not different from the control plants (F = 3.99, p = 0.011). It is notable that for the Ag2S NM treatment root concentrations were lower than those exposed to either of the pristine Ag NMs, but the soil Ag concentrations were also lower (approximately 5 times lower).
![Concentration of Ag in wheat roots and shoots exposed to 2 different concentrations (nominal concentration 3 [low] and 10 [high] mg Ag/kg dry LUFA 2.2 soil) of pristine Ag nanomaterials of 2 sizes (20 and 50 nm) and the aged form Ag2S (27 nm) over a 42‐d exposure period. Data points are mean values and error bars, the standard deviations. L = low; H = high.](https://oup.silverchair-cdn.com/oup/backfile/Content_public/Journal/etc/40/7/10.1002_etc.5031/3/m_etc5031-fig-0004-m.jpeg?Expires=1749187345&Signature=LA3V4YnVUWMlubXrwcKZaCIvac0s~aZuct0SYtn4CufkvEd7CMfq8qHEvKORAjHUB5GU~OeQoyV2HwBrz1ZGCgU59iw9FN66oSCToRd8dz1dOvzWYBw-49-eOHCKHAEJyJYQ8pyATjE3GDnQEf9yNY1jL3crgvGiQ2p-yeFDNzEZdRuAedfUKg0oyPe8sD0JX~025IQ8Qg1jarR19at0wwFEy149uJIMJ5No2GS~v1y8Mm4x2TnMFUFkYsUWkA8EPqlU0~EOG2Ia05R5pUMZqdFaYUt-mWRMG0ag~0Zbge9dxCQzMkKpfTf0x0aZEjPQVsZ-ZS-tsdl4MLm-vC8ifg__&Key-Pair-Id=APKAIE5G5CRDK6RD3PGA)
Concentration of Ag in wheat roots and shoots exposed to 2 different concentrations (nominal concentration 3 [low] and 10 [high] mg Ag/kg dry LUFA 2.2 soil) of pristine Ag nanomaterials of 2 sizes (20 and 50 nm) and the aged form Ag2S (27 nm) over a 42‐d exposure period. Data points are mean values and error bars, the standard deviations. L = low; H = high.
For the shoots, the background Ag concentration was 0.02 ± 0.004 µg Ag/g dry weight. There was a significant increase in the Ag concentration in the shoots of plants exposed to 20‐ and 50‐nm Ag NMs after 21 d compared to day 1 (20 nm, F = 10.81, p < 0.05; 50 nm, F = 6.31, p < 0.05), although at most sampling times concentrations did not differ from the controls (Figure 5). In both cases, shoot Ag concentration decreased between days 21 and 42, following a similar pattern to the root tissues. A significant increase in the Ag concentration was found in the shoots of plants exposed to Ag2S NMs over 21 d compared to day 1 (F = 6.31, p < 0.05); however, on most sampling days the shoot concentrations did not differ significantly from the controls (Figure 4).
![Concentration of Ag in plant roots exposed to 2 different concentrations (nominal concentration 3 mg [low] and 10 mg [high] Ag/kg dry soil) of Ag nanomaterials at 2 sizes (20 and 50 nm) over a 42‐d exposure period. Lines represent model fits for the one‐compartment model, which accounts for growth dilution and porewater concentration decreases based on model parameters from 21‐d exposure. Dots represent individual replicates. NM = nanomaterial; H = high; L = low.](https://oup.silverchair-cdn.com/oup/backfile/Content_public/Journal/etc/40/7/10.1002_etc.5031/3/m_etc5031-fig-0005-m.jpeg?Expires=1749187345&Signature=bzJc0YXywwgzTgZ6ZN1dVLkyrVd740HZczkkoz0Pflcm2aGU4QU7BPx1yUlzWaqQvyR5Eve7XiM5LNQOrflu2H0aPtCROjuRtnFT8H5D0vgQgceVJCx29NT4KMKGJU09TU6fiBESuc2pg8HwKK5tCN6gvd-ywHC11Jlx4ZYAHoyxk1969PfGmlO1X~s6D5hhe0ok9dN7m3vSumI0Y6xctTHe~3fswpAqRkM9JDoplW6fBbrWUgYKUtEOJJhFIqeMTmMhEHqUsFD-T4kk0N8oKeTGq68vYqg6pjjia35lWDDJf6ObXJl62DAh8ZcG9bi6GSzfUGOM4sLYY~uEJLsotQ__&Key-Pair-Id=APKAIE5G5CRDK6RD3PGA)
Concentration of Ag in plant roots exposed to 2 different concentrations (nominal concentration 3 mg [low] and 10 mg [high] Ag/kg dry soil) of Ag nanomaterials at 2 sizes (20 and 50 nm) over a 42‐d exposure period. Lines represent model fits for the one‐compartment model, which accounts for growth dilution and porewater concentration decreases based on model parameters from 21‐d exposure. Dots represent individual replicates. NM = nanomaterial; H = high; L = low.
The Ag concentrations measured in shoots and roots were compared to derive a shoot‐to‐root ratio (i.e., the translocation factor). The shoot‐to‐root ratio was relatively low for the 20‐ and 50‐nm NMs, with the Ag concentration in shoots being between 1 and 10% of the root concentrations, respectively. The lower Ag concentration in the roots of plants exposed to Ag2S NMs (maximum ~1 µg Ag/g) did not result in lower shoot concentrations; thus, the shoot‐to‐root ratios for plants in this treatment were higher. Shoot concentrations of plants exposed to Ag2S NMs were between 1 and 45% of those in the root between days 1 and 21.
Uptake kinetics to plant roots
The one‐compartment model was used to describe the toxicokinetics of Ag in the wheat roots. Models were fitted to tissue concentration data for samples up to 21 d postemergence (Equation 1). There were 2 reasons for focusing only on the data up to 21 d. Firstly, the growth rate could be well described by an exponential growth curve, something that was suitable for the additional consideration of growth dilution in the model. Secondly, over this time the Ag concentration in the porewater was found to show a first‐order decline, allowing porewater concentration change to be well accounted for in the model.
The rates of uptake of the 2 pristine particles in the high exposure were not significantly different, 0.181 ± 0.028 and 0.214 ± 0.051 g soil/g plant root/d for 20‐ and 50‐nm Ag NM, respectively (F test, p = 0.341; Table 2). The k 1 values did not vary with the inclusion of the growth (k g) term in the model, but k 2 values, sum of elimination processes, were reduced. Values of k 2 calculated for each of the pristine Ag NM treatments without the inclusion of growth dilution in the model suggested that the loss of Ag from the roots was approximate to the amount of uptake. However, when growth dilution was included in the model, the k 2 values were much lower (0.041 and 0.086 d–1), indicating that root elimination, by processes such as exudation and transfer to shoots, was likely slower than the overall rate of uptake. Including the decline in Ag porewater concentrations (λ) in the model reduced the k 2 term further, such that it was close to 0 (Table 2). Silver was measured in the shoots, so k 2 values for the roots had to be greater than 0 because this transfer acts as an elimination route from the roots. However, model parameterization indicated that the transfer rates are very low, supported by the fact that the concentration of Ag in the shoots was mostly between 1 and 10% of root values (Figure 5).
Accumulation (k 1) and elimination (k 2) rate constants for the uptake of Ag in wheat plants grown in LUFA 2.2 soil spiked with different Ag nanomaterials at nominal concentrations of 3 mg (L) and 10 mg (H) Ag/kg dry soila
| Including growth dilution | Including growth dilution and porewater decrease | |||
| k 1 | k 2 | k 1pw | k 2pw | |
| Treatment | (g soil/g plant root/day) | (1/day) | (L soil porewater/g plant root/day) | (1/day) |
| 20 nm pristine NM (H) | 0.181 ± 0.0305 | 0.041 ± 0.033 | 0.272 ± 0.0332 | 0 ± 0.022 |
| 20 nm pristine NM (L) | 0.684 ± 01756 | 0.702 ± 0.2177 | 0.139 ± 0.2552 | 0.037 ± 0.0368 |
| 50 nm pristine NM (H) | 0.214 ± 0.0513 | 0.086 ± 0.0590 | 0.299 ± 0.0532 | 0 ± 0.03 |
| 50 nm pristine NM (L) | 0.816 ± 0.3338 | 0.665 ± 0.333 | 0.283 ± 0.087 | 0.094 ± 0.0792 |
| Ag2S NM (H) | 5.269 | 17.653 | 5.225 | 13.958 |
| Ag2S NM (L) | — | — | — | — |
Rate constants were calculated via the one‐compartment model, based on total Ag in the soil including growth dilution (k 1, k 2) and based on total Ag in the porewater concentration including growth dilution.
Values are given with corresponding standard errors.
NM = nanomaterial; H = 10 mg Ag/kg dry soil; L = 3 mg Ag/kg dry soil; — = data were not available.
The concentration of Ag in the plant roots exposed to Ag2S NMs did not vary significantly from 1 d postexposure (F = 2.9, p = 0.057). The rate of uptake, k 1, was found to be high, 5.27 g soil/g plant root/d; and the elimination rate (k 2), where growth dilution was taken into account, was 17.7 d–1. There was effectively no change in porewater Ag concentration, so this did not influence model estimates of elimination rates. Compared to the pristine particles, there was much higher transfer of Ag from root to shoot, with the Ag concentration in the shoots being between 1 and 45% of the root concentration. This observation is in agreement with the higher estimated k 2 values for the Ag2S NMs. Overall the model fitting for Ag2S was less reliable compared with those determined for the pristine NMs.
Using the estimated k 1 and k 2 parameter values along with the k g and λ values calculated from the 21‐d exposure data, the toxicokinetic model was used to model expected tissue concentrations beyond day 21 to compare with the measured root tissue concentrations after 42 d of exposure. Model parameters estimated from the 21‐d exposure data were able to predict the concentrations in the roots measured at 42 d with good accuracy for the pristine NMs (Figure 5).
DISCUSSION
Studies on the bioaccumulation of NMs need to consider their environmental transformation occurring before (e.g., during wastewater treatment) or following entry into the environment. Further, the dynamic nature of NMs necessitates an understanding of how such transformations and processes affecting behavior (e.g., dissolution) will influence accumulation in organisms over time. Models for bioavailability developed for conventional chemicals have been considered in their application for NMs, specifically taking into consideration their dynamic nature (Vijver et al. 2018; van den Brink et al. 2019). In these cases, a strategic approach has been advocated in which simplified models should first be considered to explain observations where empirical evidence of complex processes is not available (Vijver et al. 2018). Steady‐state considerations are often applied (bioaccumulation factors); however, kinetic models offer the opportunity to include processes that have the potential to give insights into the dynamics of NM accumulation by organisms. In the present study, measurements of growth and porewater concentrations did not affect the rate of Ag uptake in the plant roots. However, the elimination of Ag was strongly influenced by these factors. Indeed, growth dilution and the decline in porewater concentration occurring over time reduced the estimated elimination rates to near zero.
Wheat plant shoot growth rate (kilograms) in all treatments followed a similar pattern, showing a slowing in exponential growth between days 21 and 42. This reduction in growth in the latter stages of the exposure was common across all the treatments including the control. This slowing in biomass production in the shoots after 21 d could potentially be due to nutrient limitation given its ubiquitous nature across all treatments. Plants were not fed during the growth experiment, and nutrient status has been shown to favor root over shoot biomass production, particularly in early growth stages (Gedroc et al. 1996; Mašková and Herben 2018). Although the plant root growth did follow the exponential growth curve closely up to day 42, the soil was dense with root material by the end of the exposure, which would support the depletion of nutrients. Wheat plant growth rate was not impacted by the presence of Ag NMs. Although toxicity of Ag NMs has been observed in plants, such observations have largely been in hydroponic or sand‐based studies (Yin et al. 2011; Dimkpa et al. 2013; Vannini et al. 2014; Wang et al. 2017) or at total Ag soil concentrations >100 mg/kg in artificial soil studies (Lee et al. 2012) compared to the 10 mg/kg (nominal) testing in the present study.
When NMs enter the soil, they are subject to reactions with the soil solution as well as with the soil solid phase. Their mobility and bioavailability will be affected by various processes such as attachment/sorption, dissolution, and heteroaggregation, which likely interact over the duration of the exposure with changes in NM form and state (Svendsen et al. 2020). The release of ions (dissolution) has been shown for Ag NMs in studies in various media including artificial soil solution, and dissolution rates have been shown to be altered (reduced) by the presence of organic matter (Cornelis et al. 2012; Klitzke et al. 2015). Dissolution rates for NMs in soil are often determined through batch tests. In these studies, the soil‐to‐soil solution ratio is higher than would be found in nonsaturated soils. However, in more concentrated soil solutions containing dissolved organic matter, dissolution in the extracted soil porewater (measured by assessing concentrations of Ag in 10‐kDa ultrafiltrate) was also found to be low, further supporting the assertion that the presence of organic matter reduces the release of Ag+ ions from Ag NMs in soil systems (Collin et al. 2014; Schultz et al. 2018). The soil porewater ultrafiltration and Ag measurements carried out at the end of the present study also showed low Ag concentrations in the ultrafiltrate, suggesting that low Ag+ concentrations in the porewater indicate low rates of dissolution. Further, the total Ag in the soil porewater also showed a further decline over the first 21 d for both of the pristine Ag NMs, in a size‐independent manner. This reduction matched the uptake pattern observed, where accumulation slowed following an initial rapid increase.
How NM size affects the uptake to plants has been the subject of investigations (Geisler‐Lee et al. 2012; Thuesombat et al. 2014; Schwabe et al. 2015; Geitner et al. 2018). The size ranges for the pristine NMs in the present study were distinct (53.6 ± 6.6 and 21.9 ± 3.6 nm), but there was no influence of size on the accumulation of Ag. The concentration of Ag in the plant roots plateaued quite quickly for all Ag forms, usually within 7 d of emergence; or in the case of Ag2S NMs, the tissue concentration did not vary after emergence. The pristine NMs were added directly to the soil, so any transformations were solely the result of incubation in the soil or of plant root influence on the soil. The pristine NMs were accumulated to a higher concentration compared with the chemically transformed Ag2S NMs. The observation of accumulation of Ag from Ag2S NMs is in agreement with other plant studies (Doolette et al. 2015; Schlich et al. 2017, 2018). Also in line with other studies, the transfer of Ag to the shoots was observed in the higher Ag2S NM treatment, despite the lower soil concentration in the Ag2S NM treatment compared with the pristine NMs in the present study. Lability of Ag2S NMs in soil was found to be low (Sekine et al. 2015). In the present study, porewater concentrations were not above the background concentrations in the porewaters of the control treatment, which suggests that uptake may have been the result of localized conditions around the roots.
Declining Ag concentrations in the porewater over the first 21 d of the study correspond to plateauing tissue concentrations; however, after 42 d there is a sharp increase in porewater Ag concentrations in the pristine Ag NM exposures. As stated, the plant roots dominated the soil matrix by this time in the exposure, and the growth of the shoots had slowed potentially because of nutrient limitation. The root environment (rhizosphere) can be chemically distinct from the bulk soil and so influence the availability of chemicals (Gao et al. 2018; McManus et al. 2018; Mousavi et al. 2018). For example, in the case of CuO NMs, dissolution was reduced because of the higher pH of the rhizosphere soil compared to the bulk soil (Gao et al. 2018). Another study, by contrast, showed that exudation of amino acids from roots increased with increasing CuO NM concentration in the soil, which enhanced dissolution compared to where plants were absent (McManus et al. 2018). Similar to the latter study, for Ag NMs it has been suggested that rhizosphere conditions can also act to remobilize Ag (Stegemeier et al. 2015; Pradas del Real et al. 2017). This could explain the large increase of Ag in the porewater at the end of the exposure compared to the earlier stages because the soil samples collected later in the exposure would represent mainly rhizosphere soil, rather than bulk soil as for the earlier sampling periods where roots were smaller. However, because soluble Ag was not measured above background concentrations in these porewaters, this does not suggest that remobilization is through dissolution. Despite the increase in measured porewater Ag concentrations at 42 d for the pristine Ag NMs, this did not result in higher tissue concentrations. The kinetics of the porewater concentrations over the first 21 d better predicted tissue concentrations. In the case of Ag2S NMs, these rhizosphere conditions may be playing a role in their availability. The bulk measurements do not allow us to assess this, but it could be that local conditions will change the availability of Ag from these NMs, resulting in uptake to the plant roots. However, higher‐resolution measurements in the rhizosphere would be needed to properly assess this.
Models have been developed to describe solute uptake by the roots, with Michaelis‐Menten kinetics and derivations of this most often used to predict solute uptake flux (Barber and Claassen 1977; Chen et al. 2008). These are usually derived from data of short‐term, hydroponic studies and assume the constant supply of chemical to the roots, with actual uptake being simply a function of solute concentration in the solution phase. However, in soils, this cannot be assumed; and along with the dynamic nature of plant growth and NMs themselves, these approaches may not be suitable for NMs. Quantifying transpiration would give a measure of mass flow toward the roots, which will ultimately determine the concentration at the roots and the acquisition of water and, thus, could be considered as additions to this simpler model. However, these measurements require more experimental effort and specialized equipment. Information on rhizospheric transformations would also be necessary for this to be more fully resolved. Ideally, there would be an experimentally determined elimination rate, which could theoretically be achieved by placing the exposed plants in clean soil and measuring the rate of decrease in concentration in the plant tissues, as is the norm in invertebrate studies (Diez‐Ortiz et al. 2015; Baccaro et al. 2018). This is, however, not practical in the case of soil‐based plant studies, where it is impossible to keep roots intact and undamaged during such a transfer process and the elimination would occur into the environment directly around the roots where they can simply be reabsorbed. Finally, some studies have successfully measured the distinct NM and dissolved forms of Ag in soil and hydroponic media with the aim of idenitifying the main form that is taken up (Baccaro et al. 2018; Dang et al. 2020). If accurate assessment of these can be made in time, inclusion of this information in the kinetic model would provide insights into the form of Ag which dominates uptake, distinguishing NM‐specific kinetics of uptake.
CONCLUSIONS
Less Ag was taken up from Ag2S NMs compared to pristine Ag NMs, but this was not negligible. Transfer of Ag to the shoots was comparable and the ratio of shoot‐to‐root was higher for Ag2S compared to the pristine NMs during the early growth phase. The initial particle size of the pristine NMs did not influence Ag porewater concentrations or the rate of uptake into the plant roots. Time was a significant factor influencing the uptake of Ag from pristine NMs, and including plant growth as an elimination process reduced total elimination, in line with the small transfer of Ag from roots to shoots. Conversely, porewater concentrations for soil spiked with the aged form, Ag2S NM, did not change with time. Uptake and elimination parameters determined from the 21‐d model fit can predict the decline in tissue concentration that was found in the plants after 42 d from emergence. However, the incongruous increase in the porewater concentration at this time point also indicates that the porewater itself might not be the only determinant and that water usage/transpiration, soil‐to‐root ratio, and rhizosphere‐specific conditions could influence the available Ag concentrations and the uptake to the plant roots.
Supplemental Data
The Supplemental Data are available on the Wiley Online Library at https://doi.org/10.1002/etc.5031.
Data Availability Statement
Data, associated metadata, and calculation tools are available from the corresponding author ([email protected]).
REFERENCES
