


Abstract
Little is known of the movement or presence of unregulated, emerging contaminants in top predators. The aim of the present study was to conduct the first screening of legacy and emerging contaminants in multiple tissues of killer whales (Orcinus orca) from Norway and investigate tissue partitioning and maternal transfer. Blubber was collected from 8 killer whales in 2015 to 2017, in addition to muscle from 5 of the individuals, and kidney, liver, heart, and spleen from a neonate. We screened for 4 unregulated brominated flame retardants and found pentabromotoluene (PBT) and hexabromobenzene (HBB) at low levels in the blubber of all individuals (median PBT 0.091 ng/g lipid wt, median HBB 1.4 ng/g lipid wt). Levels of PBT and HBB (wet wt) were twice as high in the blubber than the muscle for each individual, confirming preferential accumulation in lipid‐rich tissues. Perfluoroalkyl substances and total mercury levels were lower in the neonate than adults, suggesting less efficient maternal transfer of these substances. Polychlorinated biphenyl levels in blubber exceeded the threshold for onset of physiological effects (9 µg/g lipid wt) in 7 of the 8 whales, including the neonate. The presence of PBT and HBB in the neonate is the first evidence of maternal transfer of these unregulated contaminants in marine mammals. Our results are relevant for the continued environmental monitoring of contaminants in the Arctic. Environ Toxicol Chem 2021;40:1848–1858. © 2021 The Authors. Environmental Toxicology and Chemistry published by Wiley Periodicals LLC on behalf of SETAC.
Abstract

INTRODUCTION
The Stockholm Convention on Persistent Organic Pollutants and the Minamata Convention on Mercury were global responses to reduce anthropogenic pollution that can harm humans and wildlife (United Nations Environment Programme 2009, 2017). Persistent organic pollutants (POPs) are a group of halogenated organic compounds that are chemically stable, degrade slowly, can biomagnify in food chains, and cause harmful effects (Letcher et al. 2010). The compounds regulated by the Stockholm Convention are commonly known as legacy POPs because their present‐day contamination is a “legacy” of previous releases (Rigét et al. 2010).
In response to regional and global bans of legacy POPs like polychlorinated biphenyls (PCBs), pesticides like dichlorodiphenyltrichloroethane (DDT), and flame retardants like polybrominated diphenyl ethers (PBDEs), other chemicals have been produced to serve as replacements. These replacement chemicals, which are not yet regulated or included in routine monitoring programs, are termed “contaminants of emerging concern” or “emerging contaminants” (Lapworth et al. 2012). They can include either newly introduced compounds and their metabolites or compounds with previously unrecognized adverse effects on wildlife. Examples include new types of brominated flame retardants (BFRs), such as pentabromotoluene (PBT) and hexabromobenzene (HBB), and perfluoroalkyl substances (PFAS), which have been widely used as surface‐active agents in cosmetic products, ski wax, textiles/leather/paper impregnation, and foam‐based fire extinguishing agents (Swedish Chemical Agency 2015). Little is known about the maternal transfer or tissue partitioning of these emerging contaminants, although there is evidence that the new BFRs have similar lipophilic properties to other POPs and that PFAS tend to bind to proteins and are maternally transferred through the placenta (Jones et al. 2003; Arp et al. 2011; Grønnestad et al. 2017). The presence of these emerging contaminants in top predators in environments without clear local sources, such as the Arctic, is evidence that the chemicals can travel long distances and have persistent and biomagnifying properties (Arctic Monitoring and Assessment Programme 2016). Screening is thus important to establish the environmental risk of these contaminants for policy guidance.
Top predators such as the killer whale (Orcinus orca) are considered sentinel species for marine ecosystem health (Bossart 2011), and many killer whale populations have been evaluated as being at risk from the harmful effects of legacy POPs, such as PCBs (Jepson et al. 2016; Desforges et al. 2018). Levels of legacy POPs, emerging BFRs, and mercury (Hg) in biopsy samples from free‐ranging killer whales in northern Norway revealed that because of a part of the population eating higher–trophic level prey such as seals, in addition to fish, the population as a whole was at higher risk from health effects than expected from previous risk assessments (Andvik et al. 2020). There are presently only 2 reports on PFAS levels in killer whales worldwide, from Greenland (Gebbink et al. 2016) and the north Pacific Ocean (Fujii et al. 2018). There are, furthermore, very few data on the tissue partitioning and maternal transfer of emerging contaminants in killer whales, because of difficulty in obtaining suitable tissues.
Opportunistic sampling from stranded whales is the only way to obtain a range of tissue types from nonharvestable species or those that are not routinely caught as by‐catch in fisheries. However, interpretation and comparison of stranded animals are challenging if the cause of death is unknown. Pollutant levels are often higher in stranded animals than free‐ranging animals from the same population because stranded animals are often ill or emaciated when stranded (Noren and Mocklin 2012). For example, a study of 597 harbor porpoises (Phocoena phocoena) in the United Kingdom found that those that had died from starvation or infectious disease had between 1.5 and 3 times higher mean ΣPCB levels than animals that had died accidentally from physical trauma (Jepson et al. 2016). Because PCBs are associated with immune suppression (Desforges et al. 2016), an individual with higher PCBs is more likely to die from infectious diseases, and thus to be found stranded. Similarly, because PCBs are lipophilic, they become more concentrated in the blubber, until being remobilized into the bloodstream, when a marine mammal starves and utilizes the blubber as energy (Debier et al. 2006). The decomposition process of the carcass can also lead to altered contaminant patterns and ratios and the loss of some organochlorine compounds from degradation (Borrell and Aguilar 1990). However, a study of 238 harbor porpoises in the United Kingdom found no effect of the state of carcass decomposition on PCB levels (Jepson et al. 2005). This suggests that, in conjunction with other explanatory variables such as sex and age, cause of death is of greater importance than decomposition state in explaining contaminant levels.
The aims of the present study were 1) to conduct the first thorough screening of legacy and emerging contaminants in stranded killer whales from Norway, taking into account decomposition status and cause of death; 2) to investigate the maternal transfer of contaminants; and 3) to investigate the tissue partitioning of legacy and emerging contaminants by analyzing different tissue compartments. The results are relevant for an understanding of the prevalence and persistence of these contaminants in the Arctic.
MATERIALS AND METHODS
Sampling
Tissue samples were collected from 7 individual killer whales washed ashore and 1 individual by‐caught in a purse‐seine in the period 2015 to 2017 in northern Norway (Figure 1). Biometric information and tissue types collected from each individual were dependent on available resources and expertise and are therefore not complete (Table 1). The sex and age class of each specimen were determined based on morphological differences, per Ford et al. (2000). The decomposition state of each individual was coded from 1 to 4 based on established protocols (Kuiken and García Hartmann 1991). Code 1 represents live animals (which become code 2 at death), code 2 represents recently deceased animals that are extremely fresh (no bloating), code 3 represents deceased animals with moderate decomposition (bloating, skin peeling, but organs still intact), and code 4 represents deceased animals with advanced decomposition (major bloating, organs beyond recognition).
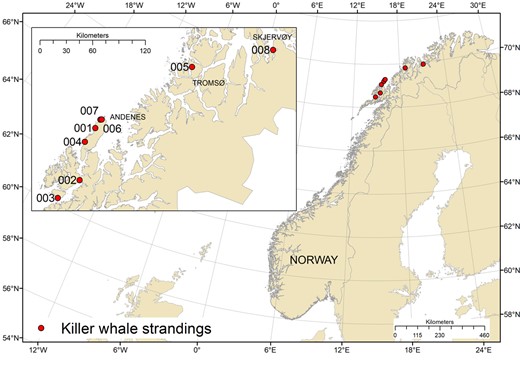
Locations of the 8 stranded or by‐caught killer whales (Orcinus orca) sampled 2015 to 2017 in northern Norway and included in the present study.
Biometrics and description of analyzed tissues in 8 killer whales (Orcinus orca) collected in northern Norway, 2015–2017
| IDa | Date sampled | Sex | Age class | Length (cm) | Decomposition state | OCs and BFRs | PFAS | T‐Hg | SIA | Notes from sampling |
| 001 | 14 June 2015 | Unknown | Adult | 550 | 4 | Blubber | NA | NA | NA | |
| 002 | 24 April 2016 | Female | Subadult | 400 | 3 | Blubber, muscle | Muscle | Muscle, skin | Muscle, skin | |
| 003 | 1 May 2016 | Female | Adult | 550 | 3 | Blubber, muscle | NA | Muscle, skin | Muscle, skin | |
| 004 | 5 June 2016 | Male | Adult | 600 | 4 | Blubber, muscle | NA | Muscle, skin | Muscle, skin | Seal hair found in throat |
| 005 | 5 December 2016 | Male | Subadult | 392 | 2 | Blubber | NA | Skin | Skin | |
| 006 | 27 January 2017 | Male | Neonate | 216 | 1 then 2 | Blubber, muscle, liver, kidney, heart, spleen | Liver | Liver, skin | Skin | Stranded alive (blunt trauma), full necropsy conducted after death and milk found in stomach |
| 007 | 16 June 2017 | Female | Adult | 580 | 3 | Blubber | NA | Skin | Skin | |
| 008 | 26 November 2017 | Male | Adult | Unknown | 1 then 2 | Blubber, muscle | Muscle | Muscle, skin | Muscle, skin | By‐caught in herring purse seine and drowned |
Assigned based on chronological order of sampling date and locations plotted in Figure 1.
OC = organochlorines; BFRs = brominated flame retardants; PFAS = perfluoroalkyl substances; T‐Hg = total mercury, SIA = stable isotope analysis; NA = no material available for analysis.
Causes of death could be determined for only 2 individuals: a neonate (ID 006) and an adult male (ID 008). Bruising was found on the body of the neonate, and it was reported as having stranded alive. The cause of death was determined to be blunt trauma as a result of the individual becoming stranded on rocks in a shallow area where its group was feeding (E. Jourdain, unpublished data). This was the only animal for which it was possible to complete a full necropsy and sampling of multiple organs. Milk was found in the stomach, and all teeth were still inside the gum, supporting the conclusion that ID 006 was a neonate with a sole diet of milk. The age was estimated at 10 d. An adult male (ID 008) died from drowning after becoming entangled in a herring purse seine.
The final notable finding during sample collection was seal hair in the throat of the adult male ID 004.
Laboratory analyses
Organic contaminant analysis was conducted at the Laboratory of Environmental Toxicology at the Norwegian University of Life Sciences (Oslo, Norway), and Hg and stable isotopes were determined at the University of Oslo (Oslo, Norway). We analyzed a total of 81 organohalogen contaminants: 49 organochlorines, including 34 PCBs and 15 organochlorine pesticides, 18 BFRs, including newer and unregulated compounds, and 14 PFAS, in addition to total Hg. A full list of analyzed compounds can be found in Supplemental Data, Table S1. The organochlorines and BFRs were analyzed using the multicomponent method and total Hg, by absorption spectrometry, with methods published in Andvik et al. (2020) and further described in the Supplemental Data, Methods section.
The PFAS were extracted by precipitation of proteins using methanol, cleaned up using graphitized nonporous carbon (ENVI‐CarbTM), and detected by liquid chromatography coupled with tandem mass spectrometry, as described for marine mammals in Grønnestad et al. (2017).
Stable isotope analysis of bulk nitrogen (δ15N) and carbon (δ13C) was conducted on skin and muscle samples, to be used as a dietary marker. Higher δ15N values indicate a higher relative trophic position (DeNiro and Epstein 1981; Hobson and Clark 1992) and higher δ13C values, a coastal/benthic as opposed to pelagic/offshore feeding area (Hobson et al. 1994; Cherel and Hobson 2007). The full method and quality assurances of the laboratory are described in Jourdain et al. (2020) and briefly described in the Supplemental Data, Methods section.
Data treatment
Data treatment and statistical analyses were performed using R, Ver 3.4.1 (R Development Core Team 2019). The organochlorines and BFRs detected in a minimum of 80% of the individual whale samples were included for statistical analysis, which excluded PCB‐56; trans‐chlordane; BDEs 183, 196, 202, 206, 207, 208, and 209; pentabromoethylbenzene (PBEB); and 3‐dibromopropyl‐2,4,6‐tribromophenyl ether (DPTE). Values below the instrument's limit of detection (LOD) were treated using multiple imputation and replaced with a random number between 0 and the LOD, assuming a beta distribution (α = 5, β = 1) to retain the pattern of the data set (Helsel 2010). In total, 7 values below the LOD were replaced, representing 0.7% of the organochlorine + BFR data set. All total Hg samples were above the LOD. The PFAS results were reported without any data treatment because there were only 3 samples available for analysis, thus precluding statistical analysis.
Paired 2‐sample t tests were used to assess differences in contaminant patterns between different compartments. Because of the low sample size, the effects of sex, age, and decomposition state were not tested statistically in the present study.
RESULTS AND DISCUSSION
Emerging contaminants
BFRs
We screened for 4 emerging BFRs in all available individuals and tissue types in the present study. Both PBEB and DPTE were below the LOD in all samples. Both HBB and PBT were found in the blubber of all individuals, with the HBB levels (median 1.4 ng/g lipid wt) over an order of magnitude higher than the PBT levels (median 0.091 ng/g lipid wt). In addition, HBB was found in all tissue types analyzed and PBT, in the muscle of a male and female adult whale (ID 008 and ID 002; Table 2).
Wet weight and lipid weight levels of organochlorine and brominated contaminants in different organs of 8 killer whales (Orcinus orca) stranded or by‐caught in northern Norway, 2015–2017a
| Legacy contaminants | Emerging contaminants | |||||||||||||||||||||||
| Organochlorines | Brominated flame retardants | |||||||||||||||||||||||
| ID | Tissue | Lipid % | ΣPCBs (µg/g) | ΣDDT (µg/g) | ΣCHLs (µg/g) | HCB (ng/g) | ΣHCHs (ng/g) | Mirex (ng/g) | ΣPBDEs (ng/g) | HBCDD (ng/g) | PBT (ng/g) | HBB (ng/g) | ΣOCs + BFRs (µg/g) | |||||||||||
| Wet wt | Lipid wt | Wet wt | Lipid wt | Wet wt | Lipid wt | Wet wt | Lipid wt | Wet wt | Lipid wt | Wet wt | Lipid wt | Wet wt | Lipid wt | Wet wt | Lipid wt | Wet wt | Lipid wt | Wet wt | Lipid wt | Wet wt | Lipid wt | |||
| 001 | Blubber | 61 | 5.9 | 9.8 | 2.9 | 4.7 | 1.4 | 2.3 | 170 | 280 | 29 | 49 | 38 | 63 | 160 | 260 | 40 | 65 | 0.075 | 0.12 | 0.79 | 1.3 | 11 | 18 |
| 002 | Blubber | 93 | 28 | 30 | 12 | 13 | 5.9 | 6.3 | 620 | 670 | 89 | 95 | 180 | 190 | 570 | 610 | 160 | 170 | 0.27 | 0.30 | 1.5 | 1.6 | 47 | 51 |
| Muscle | 13 | 4.1 | 33 | 1.7 | 13 | 0.80 | 6.3 | 83 | 660 | 6.9 | 55 | 33 | 260 | 110 | 860 | 26 | 200 | 0.040 | 0.32 | 0.69 | 5.5 | 6.9 | 54 | |
| 003 | Blubber | 75 | 9.3 | 12 | 3.4 | 4.6 | 1.7 | 2.2 | 210 | 280 | 33 | 44 | 240 | 330 | 130 | 170 | 51 | 68 | 0.046 | 0.061 | 0.42 | 0.60 | 15 | 20 |
| Muscle | 3.1 | 0.42 | 14 | 0.20 | 6.6 | 0.081 | 2.6 | 8.2 | 260 | 0.8 | 26 | 12 | 390 | 7.0 | 210 | 2.6 | 85 | n.d. | n.d. | 0.13 | 4.3 | 0.74 | 24 | |
| 004 | Blubber | 35 | 35 | 100 | 20 | 59 | 7.4 | 21 | 200 | 590 | 63 | 180 | 420 | 1200 | 570 | 1700 | 68 | 200 | 0.075 | 0.20 | 3.5 | 10 | 64 | 180 |
| Muscle | 2.0 | 2.1 | 100 | 1.1 | 54 | 0.42 | 21 | 11 | 560 | 2.3 | 110 | 35 | 1700 | 51 | 2500 | 7.3 | 360 | n.d. | n.d. | 0.3 | 15 | 3.7 | 180 | |
| 005 | Blubber | 77 | 5.0 | 6.5 | 3.0 | 3.9 | 1.4 | 1.8 | 410 | 530 | 37 | 48 | 39 | 50 | 130 | 170 | 59 | 77 | 0.028 | 0.036 | 0.96 | 1.3 | 10 | 13 |
| 006 | Blubber | 59 | 5.3 | 9.0 | 3.2 | 5.4 | 1.6 | 2.6 | 250 | 420 | 38 | 64 | 12 | 20 | 240 | 410 | 28 | 47 | 0.030 | 0.05 | 0.38 | 0.64 | 11 | 18 |
| Muscle | 1.7 | 0.19 | 11 | 0.11 | 6.4 | 0.052 | 3.0 | 6.9 | 400 | 0.87 | 50 | 1.6 | 94 | 12 | 670 | 0.87 | 50 | n.d. | n.d. | 0.036 | 2.1 | 0.38 | 22 | |
| Liver | 3.7 | 0.22 | 5.9 | 0.12 | 3.3 | 0.050 | 1.4 | 16 | 420 | 6.2 | 170 | 2.0 | 54 | 11 | 300 | 0.17 | 4.6 | n.d. | n.d. | 0.042 | 1.2 | 0.42 | 12 | |
| Kidney | 2.8 | 0.20 | 7.3 | 0.11 | 4.2 | 0.052 | 1.9 | 8.7 | 310 | 1.7 | 62 | 1.5 | 56 | 11 | 410 | 1.1 | 40 | n.d. | n.d. | 0.049 | 1.8 | 0.39 | 14 | |
| Heart | 25 | 2.8 | 11 | 2.2 | 8.9 | 0.97 | 4.0 | 100 | 420 | 18 | 74 | 8.6 | 35 | 140 | 570 | 28 | 120 | n.d. | n.d. | 0.48 | 2.0 | 6.2 | 25 | |
| Spleen | 1.4 | 0.12 | 8.5 | 0.065 | 4.8 | 0.031 | 2.3 | 4.2 | 310 | 1.0 | 76 | 0.88 | 65 | 6.2 | 470 | 0.49 | 36 | n.d. | n.d. | 0.062 | 4.6 | 0.22 | 17 | |
| 007 | Blubber | 75 | 13 | 18 | 6.5 | 8.7 | 2.9 | 3.9 | 190 | 250 | 49 | 66 | 230 | 310 | 220 | 290 | n.d. | n.d. | 0.046 | 0.061 | 2.3 | 3.0 | 23 | 31 |
| 008 | Blubber | 72 | 47 | 65 | 59 | 82 | 5.8 | 8.0 | 220 | 300 | 58 | 81 | 74 | 100 | 860 | 1200 | 75 | 100 | 0.20 | 0.27 | 1.4 | 2.0 | 110 | 160 |
| Muscle | 7 | 4.0 | 57 | 5.3 | 75 | 0.50 | 7.2 | 19 | 270 | 3.0 | 42 | 7.0 | 100 | 80 | 1100 | 4.5 | 63 | 0.017 | 0.24 | 0.41 | 5.8 | 9.9 | 140 | |
| Median (range) | Blubber | 73 (35–93) | 11 (5–47) | 15 (6.5–100) | 5.0 (2.9–59) | 7.0 (3.9–82) | 2.3 (1.4–7.4) | 3.3 (1.8–21) | 210 (170–620) | 360(250–670) | 43 (29–89) | 65 (44–180) | 130 (12–420) | 150 (20–1200) | 230 (130–860) | 350 (170–1700) | 55 (n.d.–160) | 73 (n.d.–196) | 0.060 (0.028–0.27) | 0.091 (0.036–0.32) | 1.2 (0.38–3.5) | 1.4 (0.56–10) | 19 (10–110) | 26 (13–180) |
| Median (range) | Muscle | 3.1 (1.7–13) | 2.1 (0.19–4.1) | 33 (11–100) | 1.1 (0.11–5.3) | 13 (6.4–75) | 0.42 (0.052–0.80) | 6.3 (2.6–21) | 11 (6.9–83) | 400 (260–660) | 2.3 (0.80–6.9) | 50 (26–110) | 12 (1.6–35) | 260 (94–1700) | 51 (6.5–110) | 860 (210–2500) | 4.5 (0.87–26) | 85 (50–360) | 0.030 (n.d.–0.040) | 0.28 (n.d.–0.32) | 0.30 (0.036–0.69) | 5.5 (2.1–15) | 3.7 (0.38–9.9) | 54 (21–180) |
Some contaminants are recorded as micrograms per gram and others as nanograms per gram. Contaminant sums defined in Materials and Methods.
PCBs = polychlorinated biphenyls; DDT = dichlorodiphenyltrichloroethane; CHL = chlorpyrifos; HCB = hexachlorobenzene; HCHs = hexachlorocyclohexanes; PBDEs = polybrominated diphenyl ethers; HBCDD = hexabromocyclododecane; PBT = pentabromotoluene; HBB = hexabromobenzene; OC = organochlorine; BFR = brominated flame retardant; n.d. = levels under the limit of detection.
Mainly used in Asia as an additive to paper, plastic, and electronic goods, HBB is manufactured and/or imported into Europe in confidential amounts (European Chemicals Agency 2020). Currently, PBT is used as a flame retardant in textiles and paint emulsions. Both substances have previously been reported in marine mammals (see Mckinney et al. 2010; Montie et al. 2010; Andvik et al. 2020). Median HBB blubber levels in the 8 killer whales of the present study (1.4 ng/g lipid wt) were generally higher than in the blubber of other marine mammals studied in other northern oceans (Figure 2). To our knowledge, the highest level of HBB documented in a marine mammal, 43.4 ng/g lipid weight, was in a female franciscana dolphin (Pontoporia blainvillei) from an industrialized and urban area of Brazil (Alonso et al. 2012). This is nearly 30 times higher than the median HBB blubber levels for the killer whales from the present study and 4 times higher than our highest blubber level of 10 ng/g lipid weight in the adult male sampled with seal hair in the throat (ID 004; Tables 1 and 2). Killer whales feeding on marine mammals are known to have higher pollutant burdens (Andvik et al. 2020).
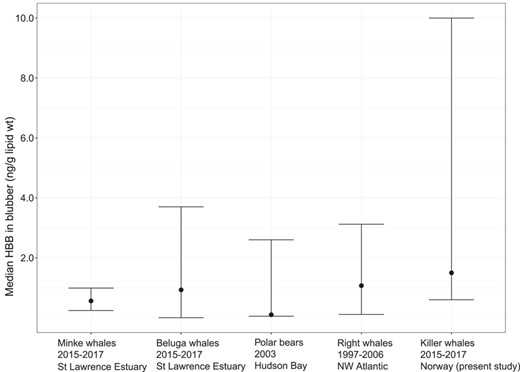
Hexabromobenzene levels in blubber in the 8 killer whales (Orcinus orca) from the present study (2015–2017) compared to minke whales (2015–2017, n = 11) and beluga whales (2015–2017, n = 45) from the St Lawrence estuary, Canada (Simond et al. 2019); polar bears from West Hudson Bay, Canada (2003, n = 12; Mckinney et al. 2010); and right whales from the northwest Atlantic Ocean (1997–2006, n = 5; Montie et al. 2010). The dot represents the median value, except for the beluga and minke whales, where the dot is the mean. The upper tail is the maximum value recorded and the lower tail, the minimum. The lower value for the minke whales, polar bears, and right whales is the limit of detection; and the minimum value was under this level. HBB = hexabromobenzene.
The toxicity of emerging BFRs has been little studied; however, associations have been found in cetaceans between HBB and the transcription of thyroid‐ and/or steroid‐related genes (Simond et al. 2019). Levels of emerging BFRs in the present study are, however, several orders of magnitude lower than those of the legacy PBDEs, contributing just 0.4% of the total ΣBFR levels in the blubber and only 0.01% of the total Σorganochlorine + ΣBFR levels in the blubber (Figure 3).
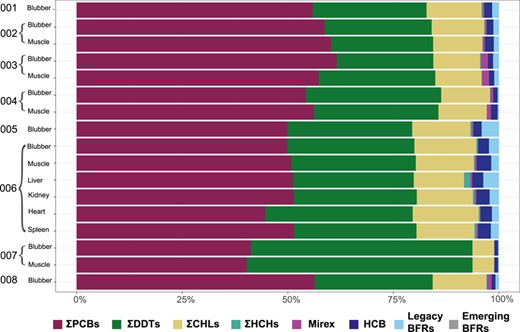
Contaminant patterns of the lipophilic pollutants in different tissues of 8 stranded or by‐caught killer whales (Orcinus orca) from northern Norway, with individual whale identifiers (from Table 1) and tissue type (not all tissue types were available from each whale). Perfluoroalkyl substances were not included because they were only analyzed in 3 samples. PCB = polychlorinated biphenyl; DDT = dichlorodiphenyltrichloroethane; CHL = chlorpyrifos; HCH = hexachlorocyclohexane; HCB = hexachlorobenzene; BFR = brominated flame retardant.
PFAS
Nine out of 14 PFAS compounds were found above the LOD in the 2 muscle samples (ID 002 and 008) and 1 liver sample (ID 006) available for analysis in the present study (Table 1) and are presented in Figure 4 and Supplemental Data, Table S2. Perfluorooctanoic acid was under the LOD in all samples. It was banned in Norway in 2013 and restricted worldwide through the Stockholm Convention in 2019. In addition, the PFAS compounds perfluorobutanoic acid, perfluorohexanoic acid (PFHxA), perfluoroheptanoic acid, and perfluorobutanesulfonic acid (PFBS) were below the limit of detection in all samples. Both PFHxA and PFBS are on the Norwegian priority list for chemicals that should soon be phased out but are not yet regulated in Europe.
![Perfluoroalkyl substance levels and patterns in (A) the muscle and (B) the liver of stranded or by‐caught killer whales (Orcinus orca) sampled from northern Norway 2015 to 2017 compared to pilot whales (Globicephala melas) from the Faroe Islands (2010–2013, n = 33 [Dassuncao et al. 2017]), killer whales from Greenland (2012–2013, n = 6 [Gebbink et al. 2016]), killer whales from the north Pacific (2010–2014, n = 2 [Fujii et al. 2018]), and a killer whale from the Sea of Japan (2010–2014, n = 1 [Fujii et al. 2018]). Note the different scales on the y‐axis. PFAS = perfluoroalkyl substances; PFDA = perfluorodecanoic acid; PFDoDA = perfluorododecanoic acid; PFHxS = perfluorohexane sulfonic acid; PFNA = perfluorononanoic acid; PFOS = perfluorooctane sulfonic acid; PFOSA = perfluorooctane sulfonamide; PFTeDA = perfluorotetradecanoic acid; PFTrDA = perfluorotridecanoic acid; PFUnDA = perfluoroundecanoic acid.](https://oup.silverchair-cdn.com/oup/backfile/Content_public/Journal/etc/40/7/10.1002_etc.5064/3/m_etc5064-fig-0004-m.jpeg?Expires=1750210651&Signature=X1MeMWTUBnkDKxo4uI5PL-DOg2SisCvDrdFdGBTfhEvj1ujSDSFKFqRvUV2MCKHk0Et3hfin4pvwjWZDjcYNOsNthhZSf3oQrmiNsLcpazjwpz-uJ9fLIQ-tUsvpEyYRtzYIyCOunBU2caaIDDxN46r6cuCNXC71cV4Ux2pZwn62VCWX9qM8c1OCKObzBwKIDsn01BpgmlnN9RtuZLtRO6JCHhZBcjRkVhZ~ILKqa8Tbin2sPO3OH3v76BeKztp78bD8zSrrEDDgVoWG6FhyF95zovAZ~WJ2rmxF5bssdQPTFbewchDhxYPsMiO2iHr3sxW6zHenaY1dZf2o7djmsQ__&Key-Pair-Id=APKAIE5G5CRDK6RD3PGA)
Perfluoroalkyl substance levels and patterns in (A) the muscle and (B) the liver of stranded or by‐caught killer whales (Orcinus orca) sampled from northern Norway 2015 to 2017 compared to pilot whales (Globicephala melas) from the Faroe Islands (2010–2013, n = 33 [Dassuncao et al. 2017]), killer whales from Greenland (2012–2013, n = 6 [Gebbink et al. 2016]), killer whales from the north Pacific (2010–2014, n = 2 [Fujii et al. 2018]), and a killer whale from the Sea of Japan (2010–2014, n = 1 [Fujii et al. 2018]). Note the different scales on the y‐axis. PFAS = perfluoroalkyl substances; PFDA = perfluorodecanoic acid; PFDoDA = perfluorododecanoic acid; PFHxS = perfluorohexane sulfonic acid; PFNA = perfluorononanoic acid; PFOS = perfluorooctane sulfonic acid; PFOSA = perfluorooctane sulfonamide; PFTeDA = perfluorotetradecanoic acid; PFTrDA = perfluorotridecanoic acid; PFUnDA = perfluoroundecanoic acid.
Consistent with other studies of PFAS in cetaceans (Fujii et al. 2018), perfluorooctane sulfonic acid (PFOS) was the dominant congener in the muscle of the adult female (ID 002; 36% of ΣPFAS). The dominant PFAS congener in the liver of the neonate (ID 006) and muscle of the by‐caught adult male (ID 008), however, was perfluorooctane sulfonamide (PFOSA; 42% and 57% of ΣPFAS, respectively; Figure 4). Although PFOSA is a precursor of PFOS, cetaceans lack the enzyme to metabolize PFOSA to PFOS; and thus, levels are representative of exposure to each compound (Galatius et al. 2013; Gebbink et al. 2016). The differences between these individuals can thus be representative of individual exposure through diet and/or geographic range or proximity to primary sources. In 2009, PFOS was added to the Stockholm Convention, so its future presence in biota will be important to monitor.
The PFAS levels in the muscle of the 2 adult whales (ID 002 and 008; Table 1) from the present study were comparable with the muscle levels measured in adult pilot whales from the Faroe Islands between 2010 and 2013 (Figure 4A; Dassuncao et al. 2017). Levels of PFAS from the liver of the neonate (ID 006; Table 1) were lower than in the liver of killer whales from Greenland, the north Pacific Ocean, and the coast of Japan (Figure 4B).
Thresholds for health effects of PFAS in marine mammals are not established, but PFAS levels have been linked to estrogenic, reproductive, and endocrine effects in wildlife (Reiner and Place 2015).
Legacy contaminants
The sum of PCBs (ΣPCBs) made up between 40 and 62% of the total contaminant levels in each individual and tissue type (Figure 3, excluding PFAS and Hg). In blubber, ΣPCB levels for 7 of the 8 killer whales exceeded the most widely used proposed threshold for toxicological effects in marine mammals (9 µg/g lipid wt), for which adverse physiological effects such as variation in thyroid hormone concentrations can be expected (Kannan et al. 2000; adapted by Jepson et al. 2016). This included the neonate (ID 006; Tables 1 and 2). Levels near to or exceeding health effect thresholds in such a young animal are worrying, considering that the endocrine and immune systems are still developing, thereby increasing the risk of developmental deficiencies and calf mortality (Hall et al. 2018). Furthermore, 2 adult males had ΣPCB blubber levels exceeding 41 µg/g lipid weight, the threshold for which profound reproductive impairment was observed in ringed seals (Phoca hispida) in the Baltic Sea (Helle et al. 1976; adapted by Kannan et al. 2000).
Hepatic Hg levels of the neonate (ID 006, 0.73 µg/g wet wt; Figure 5 and Supplemental Data, Table S3) were well below the liver threshold level for a risk of health effects in marine mammals (16 µg/g wet wt; Dietz et al. 2019), based on toxic hepatitis, uremia, and renal failure observed in harp seals (Pagophilus groenlandicus; Ronald et al. 1977).
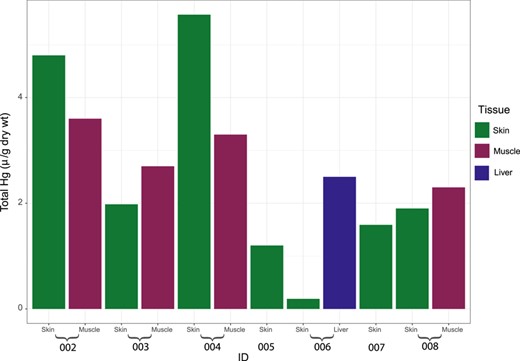
Total Hg levels in 7 killer whales (Orcinus orca) stranded or by‐caught in northern Norway, 2015 to 2017.
Maternal transfer
We found both legacy and emerging contaminants in the nursing neonate (ID 006; Tables 1 and 2 and Figure 3), which, given its young age (approximately 10 d) and the finding of milk in the stomach, is indicative of the maternal transfer of contaminants. Legacy organochlorines and BFRs have been well documented to be transferred from mother to calf in killer whales, through both the placenta and the lipid‐rich milk (Ylitalo et al. 2001; Haraguchi et al. 2009; Krahn et al. 2009; Pedro et al. 2017).
The present study is the first to document the presence of emerging BFRs in the offspring of marine mammals, indicating their maternal transfer. There have previously been indications that emerging BFRs can be transferred maternally in humans, birds, and sharks, with PBT and HBB found in human milk in Europe, including Norway (Cechova et al. 2017), and in glaucous gull eggs in the Norwegian Arctic (Verreault et al. 2007). Hexabromobenzene has also shown to be transferred maternally in sharks (Marler et al. 2018). Given that the neonate killer whale in the present study had similar levels of PBT and HBB to the subadult and adult individuals (Table 2), it is likely that a substantial amount of contaminants is transferred maternally. Further studies of mother–fetus/calf pairs would be needed to assess the relative contribution from placental or lactational transfer.
Previously, PFAS has been found in the liver of killer whale fetuses in Greenland, with transfer rates from mother to fetus estimated to be 2.2 to 11% (Gebbink et al. 2016). Maternal transfer of PFAS has also been reported in melon‐headed whales (Peponocephala electra; Hart et al. 2008) and hooded seal (Cystophora cristata; Grønnestad et al. 2018). Maternal transfer of PFAS in hooded seal mother–pup pairs was determined to be predominantly placental but also partly from lactation, with higher PFAS levels found in plasma than milk (Grønnestad et al. 2018). The presence of PFAS in the liver of the neonate in the present study is further indication that this emerging contaminant can be transferred to offspring.
Levels of ΣPCBs in the neonate from the present study were similar to levels in fetuses from Greenland; however, pesticide levels (ΣDDTs, Σchlorpyrifos, and Mirex) were approximately 4 times higher in the Greenland fetuses, which could be a reflection of a higher proportion of marine mammal prey, proximity to point sources, and/or transportation routes of contaminants (Pedro et al. 2017).
Mercury was found at much lower levels in the neonate than the older individuals (Figure 5), indicating relatively low transfer of Hg from mother to offspring compared to POPs. Analysis of a blue whale earplug concluded that Hg is not maternally transferred to the same degree as POPs in cetaceans and that lifetime levels are rather correlated to regional environmental and/or anthropogenic increases in Hg (Trumble et al. 2013). Similarly, in pinnipeds, maternal transfer of Hg is less efficient than for lipophilic PCBs (Hitchcock et al. 2017).
In 2016, a neonate killer whale of the same sex and approximate age as our neonate stranded in northern Germany, with mitochondrial DNA suggesting it belonged to the north Atlantic population (Schnitzler et al. 2019). In blubber, the ΣPCB levels were 25 times higher (225 µg/g lipid wt), p,p'‐dichlorodiphenyldichloroethylene over 50 times higher (226 µg/g lipid wt), and ΣPBDEs 12 times higher (5 µg/g lipid wt) than those in the neonate in the present study. The level of total Hg in the liver was also 6 times higher in the individual from northern Germany than our neonate (1.1 µg/g dry wt). The neonate's cause of death in the present study was determined to be accidental, and thus contaminant levels were not influenced by starvation. In contrast, the neonate from Germany was in poor body condition and found in an area where killer whale encounters are not common. Because starvation has been associated with higher PCB levels in marine mammals (Jepson et al. 2016), the poor body condition of the neonate from Germany could be the primary reason for its higher contaminant levels, so it would not be a fair representative of the population.
Tissue partitioning
Organochlorine contaminants and legacy BFRs are lipophilic, and thus known to preferentially partition in the lipid‐rich tissues such as blubber in marine mammals (Metcalfe et al. 1999; Wafo et al. 2005). In the present study, the lipid content was higher in the blubber (35–93% lipid) than muscle (1.7–13%), and for all chlorinated and brominated contaminants tested, levels were higher on a wet‐weight basis in the blubber than in muscle. When lipid‐normalized, however, levels in muscle were similar to or higher than those in the blubber (Table 2), because of the low muscle lipid content.
Little is known about the tissue partitioning of emerging BFRs in marine mammals. We found HBB in all tissues sampled, including blubber, muscle, kidney, heart, and spleen from the neonate (Table 2). The tissue distribution from our results suggests that they behave in a similar way to the lipophilic recalcitrant legacy organochlorines and BFRs. We found higher amounts of the newer BFRs in the blubber on a wet‐weight basis as opposed to other tissues and in the fatty heart of the neonate, indicating that they have lipophilic properties and supporting lipid partitioning as an indicator of body distribution. Like with the legacy contaminants, lipid adjusting led to similar amounts of these compounds across tissue types (Table 2).
We found no difference in the proportion of ΣPCBs and ΣDDTs between the muscle and blubber of individuals (paired t test blubber vs muscle: %ΣPCBs, t = –0.137498, p = 0.897 and %ΣDDTs, t = –0.191565, p = 0.857). This indicates a similar distribution of the pollutants between the organs, albeit in different total levels (Figure 3 and Table 2).
Effect of diet
Some individuals/groups of killer whales in Norway eat animals from higher trophic levels, such as marine mammals, in addition to fish, as supported by field observations and higher measured δ15N values in skin (Jourdain et al. 2017, 2020). Owing to feeding at higher trophic levels, individuals that also ate seals were shown to have 4 times higher PCB levels and twice the Hg levels as fish‐eating killer whales that frequent the same waters (Andvik et al. 2020). The highest ΣPCB levels in the present study, as measured in 2 adult males (IDs 004 and 008; Table 2) and an adult female (ID 002; Table 2), fell within the range of levels found in the blubber of live biopsied seal‐eating killer whales (Supplemental Data, Figure S1A; Andvik et al. 2020). The same adult female (ID 002; Figure 5) and one of the adult males (ID 004; Figure 5) also had the highest Hg levels in the skin, comparable to those measured in live seal‐eating killer whales (Supplemental Data, Figure S1B; Andvik et al. 2020). One of the adult males (ID 004) had seal hair in the throat, indicating that he had recently been feeding on a seal. His skin δ15N values, higher than those of any other specimen in the present study (excluding the neonate) and 0.7‰ higher than the mean value of live seal‐eating killer whales previously biopsy‐sampled (Jourdain et al. 2020), indicated that feeding on pinniped prey was a recurrent behavior/feeding habit (Table 3) and the likely explanation for the high contaminant levels. The other adult male (by‐caught) and the adult female had lower δ15N values within the range previously measured in fish‐eating killer whales (Jourdain et al. 2020; Table 3). Their high contaminant levels could thus be due to other explanatory variables, such as age, sex, birth order, or that while they eat marine mammal prey at other times of the year, their δ15N reflected a recent diet of fish.
Stable isotope values (‰) of δ15N (bulk) and δ13C (lipid‐extracted) in 8 killer whales (Orcinus orca) sampled in northern Norway, 2015–2017a
| 002 | 003 | 004 | 005 | 006 | 007 | 008 | Seal‐eaters μ±SDb (n = 10) | Fish‐eaters μ±SDc (n = 28) | ||
| δ15N | Skin | 11.8 | 12.1 | 13.3 | 11.3 | 14.4 | 11.8 | 12.8 | 12.6 ± 0.3 | 11.7 ± 0.2 |
| Muscle | 11.9 | 11.9 | 11.7 | NA | NA | NA | 11.8 | NA | NA | |
| δ13C | Skin | –19.8 | –19.7 | –16.4 | –20.5 | –19.7 | –19.7 | –18.8 | –19.0 ± 0.6 | –18.9 ± 0.6 |
| Muscle | –19.6 | –19.3 | –19.1 | NA | NA | NA | –18.8 | NA | NA |
CONCLUSIONS
Polychlorinated biphenyls, which have long been banned, pose a potential risk to population growth for the majority of known killer whale populations around the world (Desforges et al. 2018). The presence of unregulated emerging contaminants in their tissues, in addition to the legacy compounds, gives cause for concern. Levels of pollutants in top predators give an indication not only of ecosystem health but also of the persistence of chemicals, passive mobility in the environment, and active biotransport with migrating animals. The present study is the first to document the maternal transfer of emerging BFRs in marine mammals and to quantify levels of PFAS in Norwegian killer whales. Our results are relevant for continued biomonitoring of the Arctic marine ecosystem and provide further evidence of the persistent and bioaccumulative properties of emerging contaminants.
Supplemental Data
The Supplemental Data are available on the Wiley Online Library at https://doi.org/10.1002/etc.5064.
Acknowledgment
We thank D. Vongraven for making the map in Figure 1. We thank K. Kotz, A. Reckendorf, R. Lott, and D. Vongraven for help in sample collection and the Norwegian Institute for Marine Research for supplying samples for individual 007. Thanks to R. Wenning for reading through an earlier version of the manuscript. The present study was funded by the Norwegian Ministry of Climate and Environment's Arctic2030 program (grant QZA‐15/0137). Sample collection was funded by grants from the Sea World and Busch Gardens Conservation fund and Sea World and Parks Entertainment to Norwegian Orca Survey.
Disclaimer
The authors declare no competing interests. This manuscript is original, has not been published before, and is not currently being considered for publication elsewhere.
Data Availability Statement
Data, associated metadata, and calculation tools are available from the corresponding author ([email protected]).
REFERENCES
